Table of contents
- Qinheng CH32V208 (1): CH32V208WBU6 evaluation board hands-on report and Win10 environment configuration
- Qinheng CH32V208 (2): CH32V208 storage structure, startup mode and clock
- Qinheng CH32V208 (3): CH32V208 Ubuntu22.04 Makefile VSCode environment configuration
- Qinheng CH32V208 (4): CH32V208 network DHCP sample code analysis
- Qinheng CH32V208 (five): Instructions for CH32V208 running FreeRTOS examples
Hardware parts
- CH32V208WBU6 Evaluation Board
- WCH-LinkE or WCH-Link
The hardware environment is the same as that under Windows, so we won’t introduce it in detail
software part
Qinheng has open-sourced the WCH-Link protocol, so the options for this part will be very rich. Here we will take Qinheng's official customized version of RISC-V Embedded GCC and OpenOCD as examples for illustration.
download
Download the latest toolchain from http://mounriver.com/download . The current version is MRS_Toolchain_Linux_X64_V170.tar.xz, for CH32V208, V1.60 is also supported. The compressed package contains RISC-V Embedded GCC and OpenOCD.
configuration
Unzip the toolchain,
sudo tar -xvf MRS_Toolchain_Linux_X64_V170.tar.xz
There is a README in the decompressed directory. This file is more important. Because every time Qinheng releases a new version, there may be some changes, making the cfg or command line of the previous version unusable. This README will list the available versions of the current version. Burning and debug commands need attention.
Move the toolchain to an appropriate location, and modify the owner to root to avoid accidental modification
sudo mkdir -p /opt/gcc-riscv/
sudo mv "MRS_Toolchain_Linux_x64_V1.70/RISC-V Embedded GCC" /opt/gcc-riscv/riscv-wch-embedded-gcc-v1.70
sudo chown -R root:root /opt/gcc-riscv/riscv-wch-embedded-gcc-v1.70

sudo mkdir -p /opt/openocd/
sudo mv MRS_Toolchain_Linux_x64_V1.70/OpenOCD /opt/openocd/wch-openocd-v1.70
sudo chown -R root:root /opt/openocd/wch-openocd-v1.70
For the extra dynamic link library, copy it directly to /usr/lib in beforeinstall/start.sh. To be on the safe side, create a separate directory and put it in
sudo mkdir -p /usr/lib/wch/
sudo cp -P beforeinstall/lib* /usr/lib/wch/
sudo ldconfig
Configure device permissions
According to the commands executed in start.sh, two rule files need to be copied to /etc/udev/rules.d.
First check whether there are related configurations under /etc/udev/, and if so, you need to match these two Integrate the rules, if not, just copy and update
sudo cp beforeinstall/50-wch.rules /etc/udev/rules.d
sudo cp beforeinstall/60-openocd.rules  /etc/udev/rules.d
# Reload rules
sudo udevadm control  --reload-rules
verify
You should be able to see the correct output after executing these two commands. If there is an error, you need to troubleshoot the problem first.
~$ /opt/gcc-riscv/riscv-wch-embedded-gcc-v1.70/bin/riscv-none-embed-gcc --version
riscv-none-embed-gcc (xPack GNU RISC-V Embedded GCC, 64-bit) 8.2.0
Copyright (C) 2018 Free Software Foundation, Inc.
This is free software; see the source for copying conditions.  There is NO
warranty; not even for MERCHANTABILITY or FITNESS FOR A PARTICULAR PURPOSE.

~$ /opt/openocd/wch-openocd-v1.70/bin/openocd --version
Open On-Chip Debugger 0.11.0+dev-02415-gfad123a16-dirty (2023-02-22-15:09)
Licensed under GNU GPL v2
For bug reports, read
	http://openocd.org/doc/doxygen/bugs.html
Run the example project
Based on the CH32V20x reference example https://www.wch.cn/downloads/CH32V20xEVT_ZIP.html , adjust the structure and add Makefile, which has been submitted to GitHub, and can be directly exported for compilation and burning.
Project address: https://github.com/IOsetting/ch32v208-template
Export project from GitHub
git clone https://github.com/IOsetting/ch32v208-template.git
According to your own environment, adjust the path information in the Makefile, and other content can keep the default
##### Toolchains #######

GCC_TOOCHAIN	?= /opt/gcc-riscv/riscv-wch-embedded-gcc-v1.70/bin

OPENOCD_PATH	?= /opt/openocd/wch-openocd-v1.70/bin
execute compile
make clean
make
If the CH32V208 evaluation board has been connected to the PC through WCH-Link, you can execute the following command to burn
make flash
GDB Debug
Open the terminal, start the GDB Server with the openocd made by Qinheng, pay attention to connect to the WCH-Link, otherwise the Server will report an error and exit.
/opt/openocd/wch-openocd-v1.70/bin$ ./openocd -f wch-riscv.cfg
Open On-Chip Debugger 0.11.0+dev-02415-gfad123a16-dirty (2023-02-22-15:09)
Licensed under GNU GPL v2
For bug reports, read
	http://openocd.org/doc/doxygen/bugs.html
Info : only one transport option; autoselect 'sdi'
Warn : Transport "sdi" was already selected
Ready for Remote Connections
Info : Listening on port 6666 for tcl connections
Info : Listening on port 4444 for telnet connections
Info : WCH-Link-CH549  mode:RV version 2.8
Info : wlink_init ok
Info : clock speed 6000 kHz
Info : [wch_riscv.cpu.0] datacount=2 progbufsize=8
Info : [wch_riscv.cpu.0] Examined RISC-V core; found 1 harts
Info : [wch_riscv.cpu.0]  XLEN=32, misa=0x40901105
[wch_riscv.cpu.0] Target successfully examined.
Info : starting gdb server for wch_riscv.cpu.0 on 3333
Info : Listening on port 3333 for gdb connections
In a second terminal, start the GDB Client
/opt/gcc-riscv/riscv-wch-embedded-gcc-v1.70/bin/riscv-none-embed-gdb Build/app.elf
GNU gdb (xPack GNU RISC-V Embedded GCC, 64-bit) 8.3
Copyright (C) 2019 Free Software Foundation, Inc.
License GPLv3+: GNU GPL version 3 or later <http://gnu.org/licenses/gpl.html>
This is free software: you are free to change and redistribute it.
There is NO WARRANTY, to the extent permitted by law.
Type "show copying" and "show warranty" for details.
This GDB was configured as "--host=x86_64-unknown-linux-gnu --target=riscv-none-embed".
Type "show configuration" for configuration details.
For bug reporting instructions, please see:
<https://github.com/sifive/freedom-tools/issues>.
Find the GDB manual and other documentation resources online at:
    <http://www.gnu.org/software/gdb/documentation/>.

For help, type "help".
Type "apropos word" to search for commands related to "word"...
Reading symbols from Build/app.elf...
Set GDB parameters
(gdb) set mem inaccessible-by-default off
(gdb) set remotetimeout unlimited
(gdb) set architecture riscv:rv32
The target architecture is assumed to be riscv:rv32
Connect to GDB service, load to load program, b to set breakpoint, c to continue execution, ir to view registers, i local to view all local variables, list to view code. You can use Ctrl+C to pause during c process, quit to exit
(gdb) target remote localhost:3333
Remote debugging using localhost:3333
0x00000428 in Delay_Ms (n=n@entry=1000) at Debug/debug.c:74
74	    while((SysTick->SR & (1 << 0)) != (1 << 0));
(gdb) i r pc
pc             0x428	0x428 <Delay_Ms+46>
(gdb) load
Loading section .init, size 0x38 lma 0x0
Loading section .vector, size 0x148 lma 0x38
Loading section .text, size 0x1e4c lma 0x180
Loading section .data, size 0x88 lma 0x1fcc
Start address 0x0, load size 8276
Transfer rate: 4 KB/sec, 2069 bytes/write.
(gdb) i r pc
pc             0x0	0x0 <_start>
(gdb) b main
Breakpoint 1 at 0x25e: file User/main.c, line 55.
(gdb) c
Continuing.
Note: automatically using hardware breakpoints for read-only addresses.

Breakpoint 1, main () at User/main.c:55
55	    NVIC_PriorityGroupConfig(NVIC_PriorityGroup_2);
(gdb) i r pc
pc             0x25e	0x25e <main>
(gdb) list
50	 */
51	int main(void)
52	{


53	    u8 i = 0;
54
55	    NVIC_PriorityGroupConfig(NVIC_PriorityGroup_2);
56	    Delay_Init();
57	    USART_Printf_Init(115200);
58	    printf("SystemClk:%ld\r\n", SystemCoreClock);
59
(gdb)
Configure VSCode development environment
If the above steps have been successfully completed, you can directly open the project directory in VSCode. The Makefile extension of VSCode will automatically identify the corresponding tool chain and dependent libraries, and code hints and highlighting are available out of the box.
What needs to be configured is the shortcut command for compiling and burning. You can call up the menu through Ctrl+Shift+P, use Tasks:Configure Task to configure, or directly create tasks.json in the .vscode directory for configuration
Examples of tasks.json
{


    // See https://go.microsoft.com/fwlink/?LinkId=733558
    // for the documentation about the tasks.json format
    "version": "2.0.0",
    "tasks": [
        {


            "label": "clean & build",
            "type": "shell",
            "command": "make clean; make -j4",
            "problemMatcher": []
        },
        {


            "label": "build",
            "type": "shell",
            "command": "make -j4"
        },
        {


            "label": "build & download",
            "type": "shell",
            "command": "make -j4; make flash"
        }
    ]
}
After configuration, you can call up the task menu through Alt + Shift + F10, and select the corresponding task to compile or download.
Configure VSCode Cortex Debug
VSCode's Cortex Debug can be used to debug CH32V208, but it cannot be used directly and needs some adjustments.
Cortex Debug downgrade to 1.4.4
The first is the version of Cortex Debug, the current version is 1.10.0, this version will prompt the following error when running Qinheng’s gdb client
ERROR: GDB major version should be >= 9, yours is 8; GDB could not start as expected. Bad installation or version mismatch. See if you can start gdb from a shell prompt and check its version (Must be >= 9)
The gcc made by Qinheng has been 8.3 for a long time. It is not realistic to wait for Qinheng to upgrade. We can only downgrade Cortex Debug to 1.4.4. This is the last version that supports gcc 8. Open Cortex Debug in the extension of VSCode On the introduction page, click the small arrow on the right side of Uninstall to expand, and you can see the menu of Install Another Version, select 1.4.4 to install it
Configuration file launch.json
Create a new file launch.json in the .vscode directory, the configuration I use is as follows
{


    // Use IntelliSense to learn about possible attributes.
    // Hover to view descriptions of existing attributes.
    // For more information, visit: https://go.microsoft.com/fwlink/?linkid=830387
    "version": "0.2.0",
    "configurations": [
        {


            "name": "Cortex Debug",
            "cwd": "${workspaceFolder}",
            "executable": "${workspaceFolder}/Build/app.elf",
            "request": "launch",
            "type": "cortex-debug",
            "servertype": "openocd",
            "serverpath": "/opt/openocd/wch-openocd-v1.70/bin/openocd",
            "configFiles": [
                "${workspaceFolder}/Misc/wch-riscv.cfg.v1.70"
            ],
            "runToEntryPoint": "main",
            "runToMain": true,          // false: run to reset handler
            "preLaunchTask": "build",   // task from tasks.json
            // "preLaunchCommands": ["Build all"], if not using preLaunchTask
            "showDevDebugOutput": "raw", // log level: parsed, raw, vscode(include vscode and raw)
            "device": "CH32V208",
            "svdFile": "${workspaceFolder}/Misc/ch32v208xx.svd",
            "toolchainPrefix": "/opt/gcc-riscv/riscv-wch-embedded-gcc-v1.70/bin/riscv-none-embed"
        }
    ]
}
Description of configuration items:
- executable: points to the elf file generated by the current project
- servertype: only openocd
- serverpath: This is very important, it must point to the openocd executable file made by Qin constant
- configFiles: The current openocd version is 1.70, you can use the cfg in the warehouse, or use the wch-ricsv.cfg in the same directory of openocd
- preLaunchTask: fill in the task configured in tasks.json, if the task cannot be found, there will be a prompt when starting
- showDevDebugOutput: Used to output GDB logs in the DEBUG CONSOLE below, you can choose both, parsed, raw, none, where raw is to display the original content, parsed is formatted, and both is to display both
- device: For openocd, it seems that you can fill it in casually
- svdFile: A file that identifies the relationship between the name and address of the peripheral register. When debugging, you can directly view the value of the corresponding address through the register name. The svd in the warehouse is copied from Qinheng's MounRiver development environment.
- toolchainPrefix: point to the constant gcc system, note that it is a prefix, no need to bring the latter
-gcc
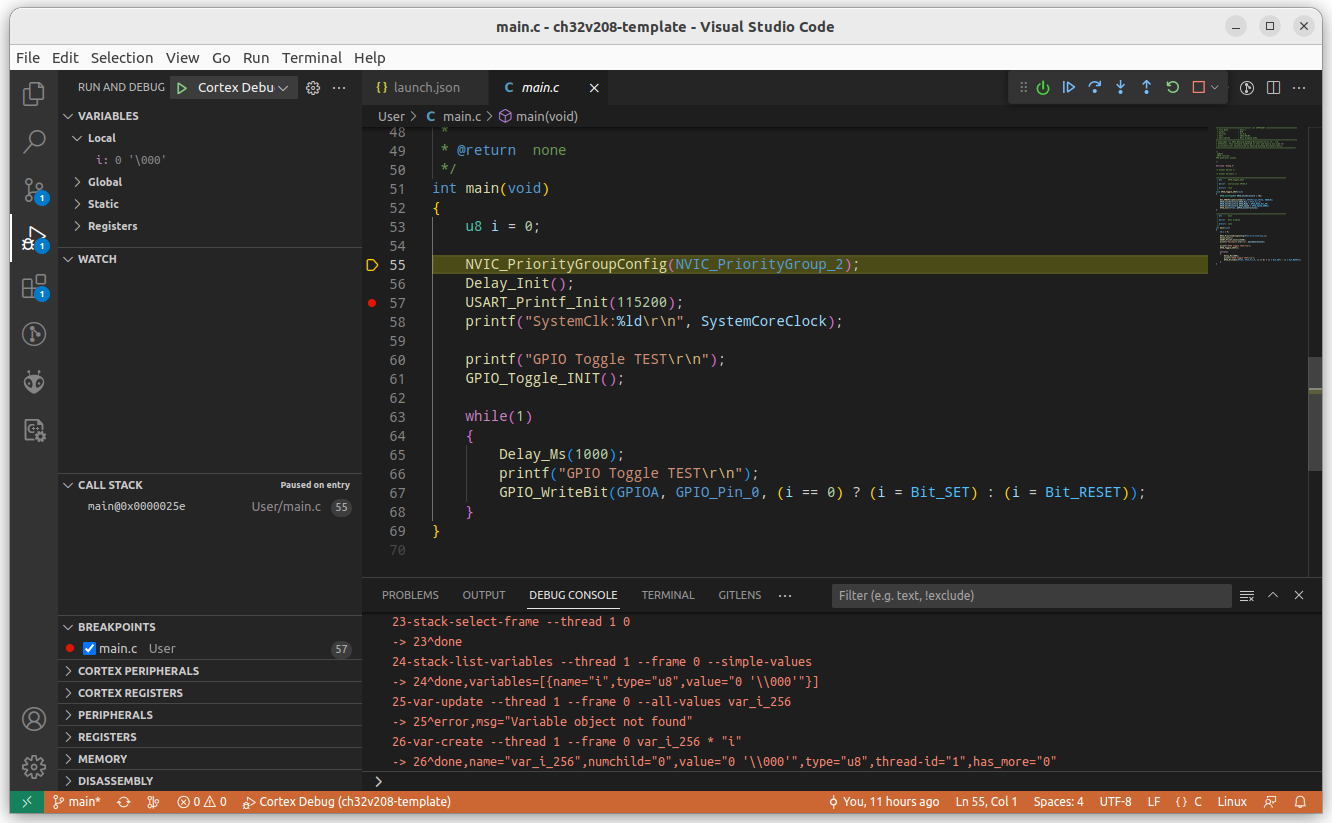
Run Debug
After the configuration is complete, you can start debugging. You can click the green triangle to start through the Run And Debug panel on the right, or press F5 to start. I use IntelliJ IDEA Keybinding, so the debug shortcut key is the same as IDEA, single-step F8, continue to F9, enter F7. On the left side of the Run And Debug panel, you can observe the values corresponding to variables and peripheral registers. Very convenient.