"Introduction to the author": CSDN top100, Alibaba Cloud blog expert, Huawei cloud share expert, high-quality creators in the field of network
security
I'm very irritable today because my sleep was disturbed.
A friend called me in the middle of the night, saying that her cloud server had been hacked, and sent me a screenshot.
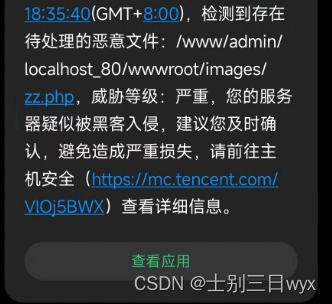
I saw that I was beaten at six o'clock in the afternoon, and you only called me in the middle of the night. Isn't the reflex arc a bit too long?
She was anxious at the time, and said that she contacted the official customer service, and the customer service gave her a set of solutions (checking ports and so on), and she followed the process for a long time to check but found nothing, so the customer service asked her to reset the system.
She quarreled with the customer service for a long time (presumably she didn't win the quarrel), but she was so angry that she came to me.
I have always been a warm-hearted person, so I quickly went to delete the back door remotely, found the back door IP from the log and blocked it.
Here I would like to share with you the emergency thinking of the uploaded backdoor (webshell).
webshell emergency response
1. What is webshell?
A webshell is a code execution environment that usually exists in the form of web pages such as asp, php, and jsp.
Hackers usually upload the webshell file to the web directory of the server as a backdoor file, and use a browser or a dedicated client to connect to control the website server.
Two, webshell classification
According to the script type, it can be divided into three types: jsp, asp, and php.
1) jsp (Java Server Pages) is often used with the Java language to embed dynamic Java code into static HTML pages, and the file name is xx.jsp.
(One-sentence Trojan horse) code example:
<%Runtime.getRuntime().exec(request.getParameter("shell"));%>
2) asp (Active Server Pages) is often used in the development of small page applications, some ancient websites are still in use, and the file name is xx.aspand xx.apsx.
(One-sentence Trojan horse) code example:
<%eval request("shell")%>
3) php (Hypertext Preprocessor) is the best language in the world, the file name is xx.php.
(One-sentence Trojan horse) code example:
<?php @eval($_GET["shell"]); ?>
Three, webshell processing process
1) According to the creation time of the webshell file, judge the attack time.
2) Check the website web logs before and after the attack time to find the attack path.
3) For the interface of the attack path, check the vulnerabilities of the website.
4) Reproduce the vulnerability and restore the attack path.
5) Clear the webshell file and fix the vulnerability.
4. Web log analysis
There are two common web logs: W3C log format and NCSA log format.
The W3C log format is mainly used in IIS; web containers such as Apache, Tomcat, and Nginx mainly use the NCSA format. Here IIS and Apache are taken as examples to explain the formats of the two logs.
1. IIS log
Default location: %systemroot%\system32\logfiles\,
for example:C:\WINDOWS\system32\LogFiles\W3SVC20110218
Log file: ex+年份的末两位数字+月份+日期 .log
For example, the log on July 30, 2010:ex100730.log
One log per day by default.
IIS adopts the W3C log format, and the recorded fields can be checked as needed.
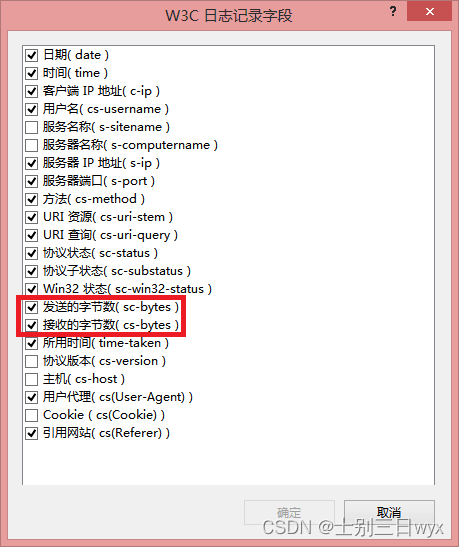
The content of the log file is as shown in the figure below. The first few lines record the version and log creation time.
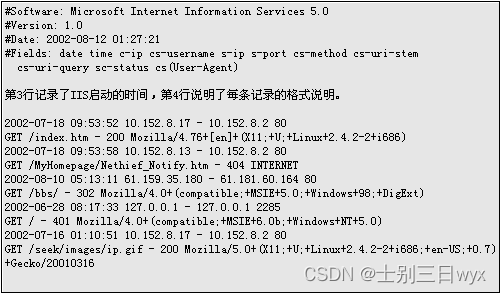
Explanation of core fields (from left to right):
- 2002-07-18 09:53:52: Request time
- 10.152.8.17 - 10.152.8.2 80: The client IP accesses port 80 of the server IP.
- GET: request method
- /index.htm: request URL
- -:200: response status code
- Client UA information
2. Apache logs
Default location (Linux): /usr/local/apache/logs
Default location (Windows):Apache安装目录/logs/
Log file (Linux): access_log, error_log
Log file (Windows): access.log,error_log
access records website access logs, and error records server error logs.
Access logs are usually in this format:
192.168.115.5 - - [01/Apr/2018:10:37:19 +0800] "GET / HTTP/1.1" 200 45
Explanation of core fields:
- 192.168.115.5: Request IP (the IP of the visiting website)
- -: E-mail, it is empty here.
- -: Login name, which is empty here.
- [01/Apr/2018:10:37:19 +0800]: Request time
- "GET / HTTP/1.1": request method and protocol
- 200: Response status code
- 45: number of bytes