| * | # |
|---|---|
| Link | https://ieeexplore.ieee.org/abstract/document/9585846 |
| topic | A Classification of Augmented Reality Approaches for Spatial Data |
VisualizationKeywords
| Geographic visualization
core point
Although we can find multiple taxonomy schemes for AR applications in the AR literature, to the best of our knowledge there is currently no taxonomy specifically addressing the spatial aspects of AR applications, namely visualization size, scale, and acknowledgment and alignment to the user's physical environment . Therefore, no classification of AR specifically applicable to geospatial science exists.
1. The main problems and solutions to be solved in the article:
1) Problems to be solved
There is currently no taxonomy that specifically and broadly discusses the spatial aspects of augmented reality.
2) The main work of the article
A taxonomy is provided by identifying different spatial properties of AR.
literature review
Hugues [13] now classifies AR methods: one aims to augment reality by presenting information related to a real element, the other aims to create an artificial environment that does not correspond to a real element at all.
Normand [30] conducted a meta-review of existing AR taxonomy and identified four main categories of AR taxonomy (technology-centric, user-centric, information-centric, and interaction-centric). They further propose a new taxonomy consisting of three core axes and an optional item (degrees of freedom required for tracking, visualization mode, temporal basis of content, and optional presentation mode).
M¨uller et al. [28] proposed a taxonomy of visualization methods that link digital information with real-world objects, focusing in particular on the different methods used to communicate the spatial relationship between virtual and real.
Zollmann et al. [45] proposed a more comprehensive taxonomy of AR visualization, aiming to provide AR researchers and developers without extensive technical background the necessary information to apply AR visualization techniques. Their taxonomy of AR visualizations identifies six distinct recurring axes: visualization purpose, virtual data visibility, virtual cues, data filtering, visual abstraction, and composition.
2. Category axis
he four axes we have identified are:
1.the visualization size that relates to the extents of the visualization itself; 2.the visualization scale that relates to how much larger or smaller the presented virtual data is in relation to the real world system that it is describing;
3.the level of acknowledgement of the user’s physical environment
that relates to whether the AR application takes into account the
morphology of the physical environment within which it is deployed
4/the view alignment methods that relate to how the AR
application attempts to align the virtual objects with the physical
environment around them.
三、 Visualization Size
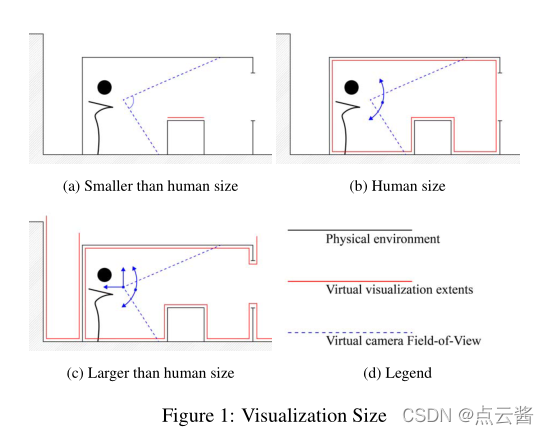
The size of the visualization is related to the scope of the visualization
a) The visualization size is smaller than a person. The entirety of a virtual object can be perceived from one angle without changing perspective or position. Such examples can be found in 3D object reconstruction [44] and augmentation of paper maps via AR [1].
b) The visual size is about the same as that of a human. This visualization does not need to change the position to experience the virtual world, but it needs to change the direction of the camera, that is, the user needs to rotate the camera to fully perceive the visualization. In augmented reality, this approach often takes place in a separate room
c) The visualization size is larger than a person. Changes in position and orientation are required to fully understand the visualization in its entirety. In the geospatial domain, this visualization often spans the size of large buildings or urban environments. Examples of such methods are found in work investigating wide-area virtual environments [34], wayfinding and navigation [29], and urban augmented reality methods [17,31].
Visualization Scale
 1:1 –> this means they render without changing size to the viewer. Examples of this type can be found in3D object reconstructionFound in [44], the reconstructed objects are rendered over the source (real-world) objects.
Small size –> scaled down.geospatial sciencemost used in .
Zoom in on the size –> This visualization usually occurs when focusing onfield of microsystems, whose inner workings and interrelationships are not apparent to the human eye, typical examples of this type of visualization includebiologyAugmented reality applications in .
Acknowledgement of User Physical Environment
The most obvious problems are occlusion (real objects must obscure parts of virtual objects) and reflections (virtual reflective surfaces reflect real-world surroundings).
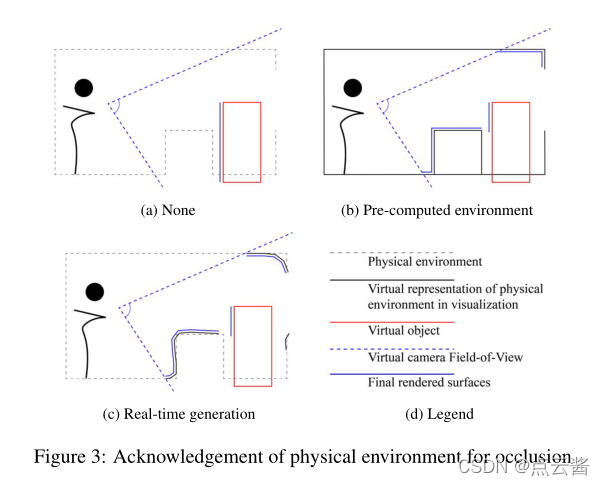
1) Not sure about virtual environments at all. AR applications have no information about the real-world environment, all rendering concerns ignore this, and virtual objects are often rendered in the physical environment even when the viewer expects them to be occluded by physical objects.
2) The second type is a pre-computational environment, where the physical properties of the environment are available to the AR application in advance, and the application can retrieve this information at runtime, allowing virtual objects to respond as needed and providing a more precise link between the virtual and the real. The "true" hybrid view. In occluded scenarios, this will cause virtual objects to be occluded by real objects "in front" (Fig. 3b), usually bypre-developed physical environment3D model to achieve. In scenes involving reflections, this is achieved by pre-capturing the lighting conditions in the environment in high dynamic range (HDR) to generate an HDR map.
3) Generated in real time. In these cases, AR applications use algorithms at runtime to identify and generate live environments, whether generating virtual 3D meshes of real-world objects [33] or capturing lighting conditions for reflections [41].
View Alignment Methods
1) Not aligned. AR apps don't align virtual space with physical space in any meaningful way.
2) Based on marker alignment. They utilize fiducial markers to align the virtual environment with the physical environment. An AR application configures it in some form through its imaging sensor, such as a camera, to recognize these objects. With this setup, when an AR app recognizes that a physical marker is in view, it can calculate the angle of view and the distance of the device relative to the marker, enabling alignment between the physical and virtual views.
3) Calibration by physical shape. Enables virtual and physical environments by identifying unique morphological features in the physical environment around the user as captured by the AR device's imaging sensors, and subsequently tracking changes in the device's position and pose relative to the frame-identified features. For example: SLAM.
4) Geographical alignment. The device's GPS sensor is used to first place the virtual environment at a specific location on the earth's surface, followed by the use of inertial and other sensors (accelerometer, compass, etc.) to track the device's movement in space.
4. Summary and Discussion
We believe that two axes have fully defined the scope of the category, one has been basically defined, and one is still open. More specifically, both the first two axes (visualizing size and scale) and spatial properties have been extensively studied and explored in other fields (notably geography and cognitive psychology) and within fields that have been defined so that Considered to be a fully defined range.
For the third axis (acknowledging the physical environment), we expect the categories presented here to encompass all possible choices (one category for precomputed methods, one category for real-time methods, and one category for non-existent methods), with segmented by technology.
The final axis (view alignment method) is one that is primarily driven by technological innovation, so we determined that major changes may need to be introduced later, so we consider this category axis to remain open.
The classification axes proposed in this paper are considered to be independent of each other, which means that AR applications can be described by any combination of axis classes, with no obvious restrictions between axes.
For example, if the purpose of AR visualization is to provide a detailed view of some complex machinery in a zoomed-in view, physical ambient occlusion can be ignored, since physical boundaries will only hinder the visualization. On the other hand, an AR system for indoor navigation and wayfinding needs to take into account the user's physical environment at all times to visually and more clearly show directions relative to the user's environment.