Article Directory
foreword
There are many ways to download Sentinel 2 (Sentinel2). At present, the following three types are collected:
- USGS Download
https://earthexplorer.usgs.gov/ - ESA official website download
https://scihub.copernicus.eu/dhus/#/home - Download ONDA website
https://catalogue.onda-dias.eu/catalogue/
Attentive netizens found that when they opened the webpage, many friends did not know how to operate it because the webpage was in English.
This article mainly introduces the registration method and data download process of the USGS official website, and then introduces the registration and download process of ESA and ONDA accordingly.
1. Website Registration
-
Open the USGS official website, and the following interface will appear. Click the red frame in the picture to enter the next interface.

-
The following interface pops up. Figure 1 is for the case of having an account (of course we have not registered here), and Figure 2 is for the case of not having an account. Click here to register an account.

-
The following interface pops up, fill in the user name and password, note that the user name requires 4-30 characters, and the password requires 12-24 characters, then click the red box 3 in the figure to enter the next interface.

-
The following interface pops up. This page mainly fills in some information about data usage and research fields, and you can fill in according to your real situation (attach my filling records).

The following is my filling record.


After filling in the information, click the red box in the picture to enter the next interface.
5. The following interface pops up. This interface mainly fills in personal registration information, such as name, company/institution, address, zip code, email address, phone number, etc. Faxes can be left blank. After filling in, click the red box in the picture to enter the next interface.

- When the following confirmation interface pops up, click Submit.

- The following interface will pop up, and then you will receive an email (the email you filled in earlier), open the link in the email to activate the account and complete the registration.

2. Successful registration
- Check the email and click the link to complete the verification.

- Open the following interface, enter the account password, and click Login.

- The login is successful, and the red box in the picture shows the login account. At this point, congratulations, it has indicated that you have successfully registered.

3. Data download
1. Overall description
The red box in the figure mainly shows the conditions that need to be set when downloading images, which will be explained one by one below. The red frame 1 is the search condition, which mainly includes the conditions for data filtering; the red frame 2 is the data set, which is mainly for the selection of the data set.

2. Selection of the research area
In order to accurately obtain the image data of the desired research area, the USGS official website provides two methods, namely geocoding and kml//shp file upload .

(1) Geocoding
In the figure 1, you can select the geocoding method, which provides features (GNIS), address/location, and path/line options, and you can choose the corresponding method according to your needs. There are two options of American features/world features in the figure 2. The submenu below can select the corresponding country according to your own needs, feature type (administrative boundary, hydrology, area, terrain, seabed, vegetation feature, etc.), feature type ( bays, shipways, drains, etc.) and other options.
(2) Kml/shp file upload
This part provides two types of kml and shp, you can upload the corresponding file according to your needs, and load it on the map.

Secondly, if there are no kml and shp files (or the upload fails), don’t be afraid, this module also provides selection methods such as polygons and circles .
The so-called polygon method is to select and input the corresponding latitude and longitude coordinates, and then connect them to form a polygon, so as to select the research area. The default is 4 points. If you need to add points, click Add Coordinate below.


The circle method is similar to the above. As the name implies, a circle is drawn with a point as the center and a certain radius. In the figure, 1 is the center latitude, 2 is the center longitude, and 3 is the radius. After the setting is complete, click Load.

3. Date and cloud coverage settings
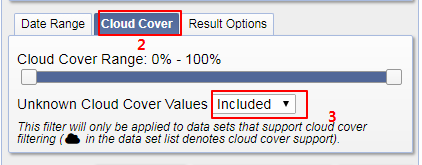
1 in the figure is the date range setting , which provides the specific range of the date search, and the search month is also provided below.

Figure 2 is the cloud cover range setting , you can set the corresponding cloud cover range according to your needs, Figure 3 is the unknown cloud value, mainly for some cases where the cloud amount is not known, this place provides inclusion and exclusion Both ways (include by default).
4. Click Results to complete the download.

4. Detailed explanation of the selection of the research area
This section mainly elaborates on (2. Selection of research area) in the third chapter. The first geocoding is relatively rigid and will not be described anymore, just filter according to the Features provided in each menu. Here we mainly explain the kml/shp of the second place .
1. Question 1 (problems that need to be paid attention to when uploading shp files)
must use the ZIP archive format to compress the shapefile into a single file, and must contain shape format files (.shp), shape index format files (.shx) and attribute format files ( .dbf). A shapefile can also contain an optional projection format file (.prj). In short, the same file under the shp file needs to be compressed . It is not necessary to upload kml (you can't upload it if you compress it).
2. Question 2 (shangchuanPlease limit your Shapefile to one polygon/polyline.)
When we compress the shp file, or convert the shp file into a kml file, and upload it, it prompts to upload Please limit your Shapefile to one polygon/polyline (please set Your shapefile is limited to one polygon/polyline). Because my shp file contains many areas, such as several cities and counties, and contains internal area lines.

3. Question 3
Later, I merged multiple counties and urban areas to form a vector file with only the outermost circle (to turn the shp file into a polygon). After uploading, I found that it was still restricted and prompted that Files are limited to one record containing one polygon or line string with a maximum of 500 points (limited to one record containing one polygon or line string with a maximum of 500 points). This shows that the merged polygon line still exceeds the 500 points limit of the system.

4. Solution
① In order to reduce the line string of points . Open the vector map in ArcGIS, create a new shp file, select polyline as the feature type , set the spatial coordinate system, and click OK.

②In ArcGIS, click to start editing, select the layer created in the previous step, redraw a linear file on the periphery according to the scope of the original research area, and click Save.

③Export the data of the generated layer, open the folder where the data is located, compress it into a zip file, and select the shp file in the website to upload. You can also use the toolbox to select the conversion tool (convert to kml → layer to kml) to generate a kml file. Note that the generated kml file does not need to be compressed, just upload it directly. The upload result is as follows. In fact, we found that this is the same as the polygon method described above. Here, the linear characters of the points are directly uploaded in the form of a file. If the research area of friends is relatively regular or small, you can also directly use the polygon below. Enter latitude and longitude manually.

④ Selection of data sets. After uploading the study area file, set the cloud coverage and time, and the next step is to select the data set. Here we choose Sentinel2.

⑤Additional parameters, which include the following cloud cover ( please note that this is different from the cloud cover coverage above), track number, track direction, platform and other parameters, here only the cloud cover is set.

⑥Click Results to load the image.

⑦ Download data. 1 in the figure is the L1C product (Level-1C: atmospheric apparent reflectance product after orthorectification and sub-pixel geometric fine correction), and 2 in the figure are 20-meter resolution false-color images (band 4 , 8A and 11), download according to your own needs.

Summarize
This article describes how to download Sentinel2 from the USGS official website. It mainly includes the registration and download process of the USGS official website, as well as the problems and solutions in the selected research area. I believe by seeing this, you have learned how to download data from USGS. Next, we will explain how to download image data from the ESA and ONDA websites.