Please correct me if I am wrong
After thinking about it for a long time, I finally figured out a little bit,
1. Design a function to give a real continuous x to get a real continuous y
2. Randomly generate a batch of discontinuous discrete x for testing and put the test x into the function and add a certain deviation to get the test y
3. At this time, assuming that the expression of the function is not known, only test x and test y are used to punctuate the graph
3.1 In the simplest case, take the average of all tests y and make a straight line to fit the original function. This is also called average convergence, and the result is obviously not acceptable.
3.2 The reason for the average convergence failure is that the input xi is ignored
4. We copy the real x to 50 columns, which means that all the columns in a row are the same, and each row is different to form a real x matrix of (50,50) size
The real x matrix (referred to as a matrix) is subtracted from the x_train to be predicted, and the broadcasting mechanism is applied
The result is, for example, the number of columns in row 0 of a matrix (every number is the same), minus the vector x_train

In fact, the meaning of the a matrix is to look at the distance between each real x and x_train, and we can see that only the first value has the shortest distance.
It can also be known that there is only one number in each line that is the minimum distance between x and x_train, and in order to prevent the distance from being too large, for example, a number as long as 9999999 may appear in the future value, use softmaxt to normalize, the simple idea is that each number occupies The largest is a percentage of . After normalization, the matrix can be made much smaller. In order to facilitate the viewing of the distance of this matrix, draw a picture and mark it with color
5. Get the weight map, we can find that the two x vectors are sorted from small to large
The similar idea is that y is approximately equal to x, but here the y axis is reversed, so it is similar to the way y is equal to -x and pulled up, on this straight line. The closer the two values are
And the darker the color means the shorter the distance, but there is no case where two x are equal in the data, that is, the case where x_test is equal to x_train, so there is no value of color 1, and the maximum is less than 0.2

6. So what is the use of this matrix
From the value of 3.1, we can make a straight line from the average value of y to describe and fit this curve, but it lacks thinking about xi. For example, at xi, the average value should increase or decrease a little to the yi corresponding to xi. value, so that this line is more in line with a value for the current yi. If the value of xi is filled up, it will directly become yi, that is, the attention will be full, but it cannot be seen in this way for the overall situation, so it needs to be watched For other values of x, make a global view, so it needs to be made into a matrix a
That is, when looking at xi, focus on xi, but also pay attention to other x that are next to xi or even far away, but the farther you go, the more you need to disperse your attention, and then apply to these y and then change the value of y , so that the final fitted curve will not be too fitting for yi, nor will it look like underfitting
Besides, the fitted line takes into account the overall situation and the situation at that time, but the attention is mainly focused on the situation at that time.
eg1.
If the average is converged directly, the average value is 2.1868, the real value is 0, and the y of the train at that time is only 0.4415, which is much smaller than this value, but the other y is large, so the average is a bit outrageous, so use the attention mechanism In the final fitting, the y of the point should look more at the current yi and less at other values (if all beings are equal, everyone’s values are treated equally and the average is y_mean, which is very large), so that other very large y can be reduced The effect of the value on this yi value


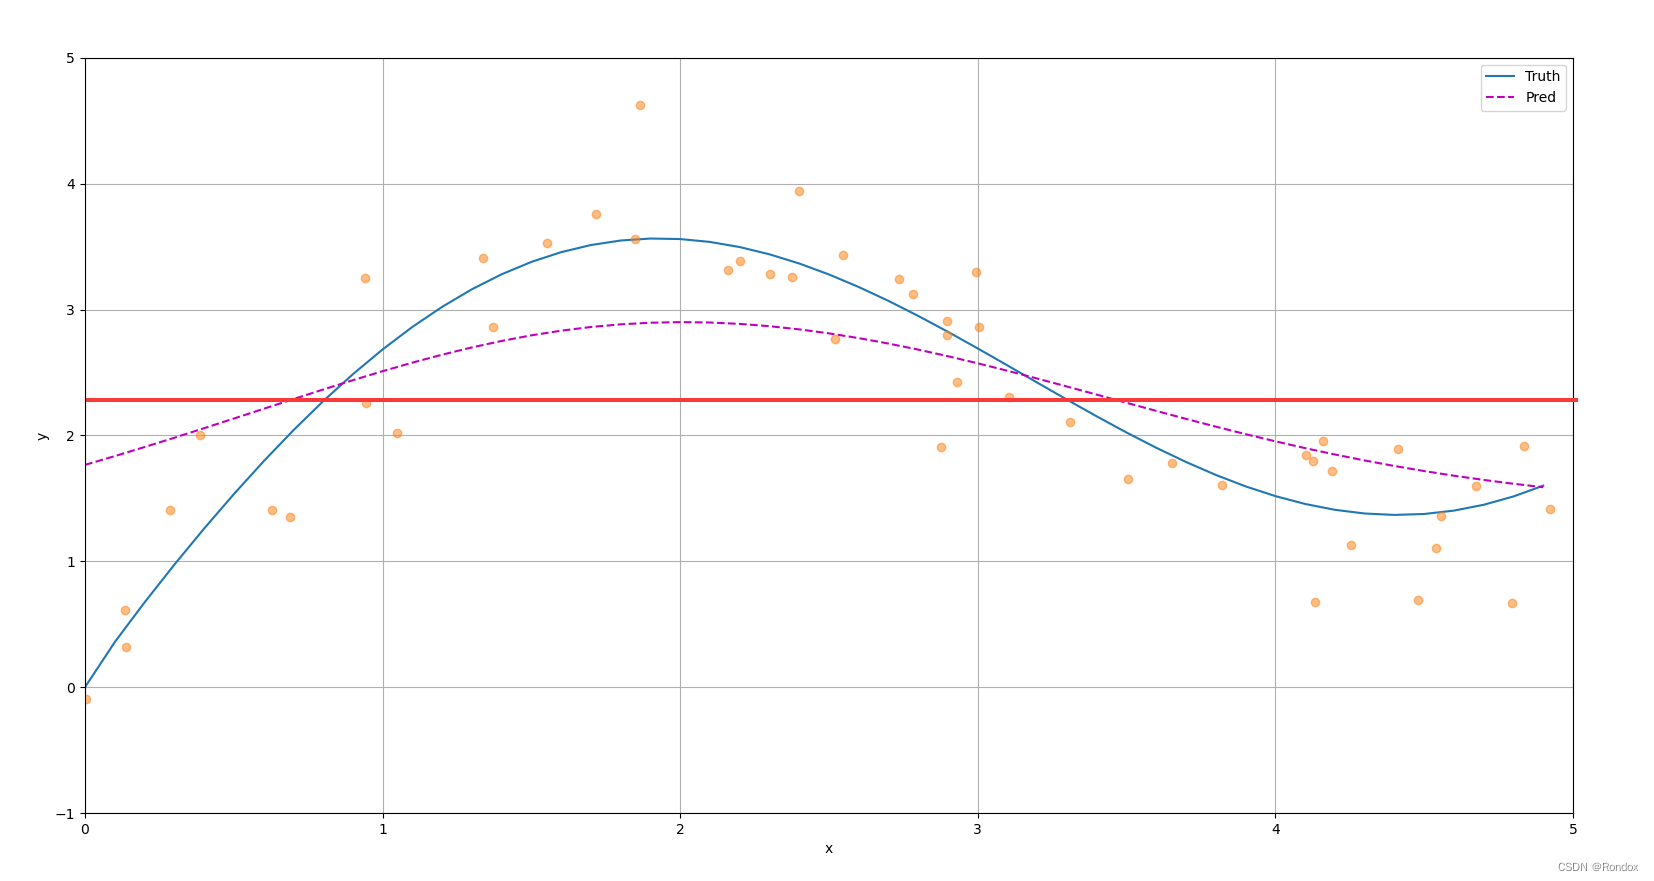
Purple is the last fitted line, stretching the mean value for different y according to different attention
I always feel that the above words are not human
import torch
from torch import nn
from d2l import torch as d2l

n_train = 50  # 训练样本数
x_train, _ = torch.sort(torch.rand(n_train) * 5)   # 排序后的训练样本 rand是0到1之间 生成50个再*5 就是取0-5之间50个数

def f(x):
    return 2 * torch.sin(x) + x**0.8

y_train = f(x_train) + torch.normal(0.0, 0.5, (n_train,))  # 训练样本的输出
x_test = torch.arange(0, 5, 0.1)  # 测试样本
y_truth = f(x_test)  # 测试样本的真实输出
n_test = len(x_test)  # 测试样本数
n_test

def plot_kernel_reg(y_hat):
    d2l.plot(x_test, [y_truth, y_hat], 'x', 'y', legend=['Truth', 'Pred'],
             xlim=[0, 5], ylim=[-1, 5])
    d2l.plt.plot(x_train, y_train, 'o', alpha=0.5);

y_hat = torch.repeat_interleave(y_train.mean(), n_test)
plot_kernel_reg(y_hat)
d2l.plt.show();
# X_repeat的形状:(n_test,n_train),
# 每一行都包含着相同的测试输入(例如:同样的查询)
X_repeat = x_test.repeat_interleave(n_train).reshape((-1, n_train))
# x_train包含着键。attention_weights的形状:(n_test,n_train),
# 每一行都包含着要在给定的每个查询的值(y_train)之间分配的注意力权重.   x_test每个值对x_train所有值的影响和关联
attention_weights = nn.functional.softmax(-(X_repeat - x_train)**2 / 2, dim=1)
# y_hat的每个元素都是值的加权平均值,其中的权重是注意力权重
y_hat = torch.matmul(attention_weights, y_train)
plot_kernel_reg(y_hat)

d2l.show_heatmaps(attention_weights.unsqueeze(0).unsqueeze(0),
                  xlabel='Sorted training inputs',
                  ylabel='Sorted testing inputs')

X = torch.ones((2, 1, 4))
Y = torch.ones((2, 4, 6))
torch.bmm(X, Y).shape

weights = torch.ones((2, 10)) * 0.1
values = torch.arange(20.0).reshape((2, 10))
torch.bmm(weights.unsqueeze(1), values.unsqueeze(-1))

class NWKernelRegression(nn.Module):
    def __init__(self, **kwargs):
        super().__init__(**kwargs)
        self.w = nn.Parameter(torch.rand((1,), requires_grad=True))

    def forward(self, queries, keys, values):
        # queries和attention_weights的形状为(查询个数,“键-值”对个数)
        queries = queries.repeat_interleave(keys.shape[1]).reshape((-1, keys.shape[1]))
        self.attention_weights = nn.functional.softmax(
            -((queries - keys) * self.w)**2 / 2, dim=1)
        # values的形状为(查询个数,“键-值”对个数)
        return torch.bmm(self.attention_weights.unsqueeze(1),
                         values.unsqueeze(-1)).reshape(-1)

# X_tile的形状:(n_train,n_train),每一行都包含着相同的训练输入
X_tile = x_train.repeat((n_train, 1))
# Y_tile的形状:(n_train,n_train),每一行都包含着相同的训练输出
Y_tile = y_train.repeat((n_train, 1))
# keys的形状:('n_train','n_train'-1)
keys = X_tile[(1 - torch.eye(n_train)).type(torch.bool)].reshape((n_train, -1))
# values的形状:('n_train','n_train'-1)
values = Y_tile[(1 - torch.eye(n_train)).type(torch.bool)].reshape((n_train, -1))

net = NWKernelRegression()
loss = nn.MSELoss(reduction='none')
trainer = torch.optim.SGD(net.parameters(), lr=0.5)
animator = d2l.Animator(xlabel='epoch', ylabel='loss', xlim=[1, 5])

for epoch in range(5):
    trainer.zero_grad()
    l = loss(net(x_train, keys, values), y_train)
    l.sum().backward()
    trainer.step()
    print(f'epoch {epoch + 1}, loss {float(l.sum()):.6f}')
    animator.add(epoch + 1, float(l.sum()))

# keys的形状:(n_test,n_train),每一行包含着相同的训练输入(例如,相同的键)
keys = x_train.repeat((n_test, 1))
# value的形状:(n_test,n_train)
values = y_train.repeat((n_test, 1))
y_hat = net(x_test, keys, values).unsqueeze(1).detach()
plot_kernel_reg(y_hat)

d2l.show_heatmaps(net.attention_weights.unsqueeze(0).unsqueeze(0),
                  xlabel='Sorted training inputs',
                  ylabel='Sorted testing inputs')
d2l.plt.show();