sequence:
1. At this step, I don’t know how many people have been persuaded to quit, and how many blog posts the blogger has searched are all from mac, but it turns out that they are all wrong!
First look at the final effect demo
Follow each of my steps carefully, you will not be able to miss an environment!
text
1. First look at the blogger's c/c++ operating environment configuration diagram (window article)_Snow Wolf Night's Blog-CSDN Blog
If you finish installing by yourself, you have to write down the path of MinGW to be used later (key points!!!)
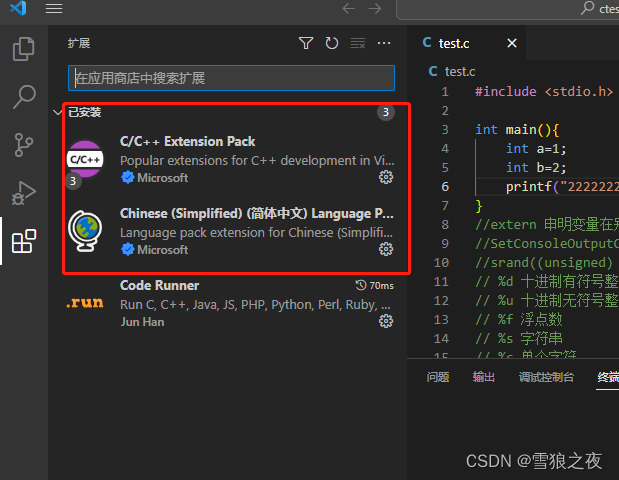
2. First install the plug-in Code Runner and C/C++ Extension Pack
3. Don’t worry about other things after installation, follow me step by step
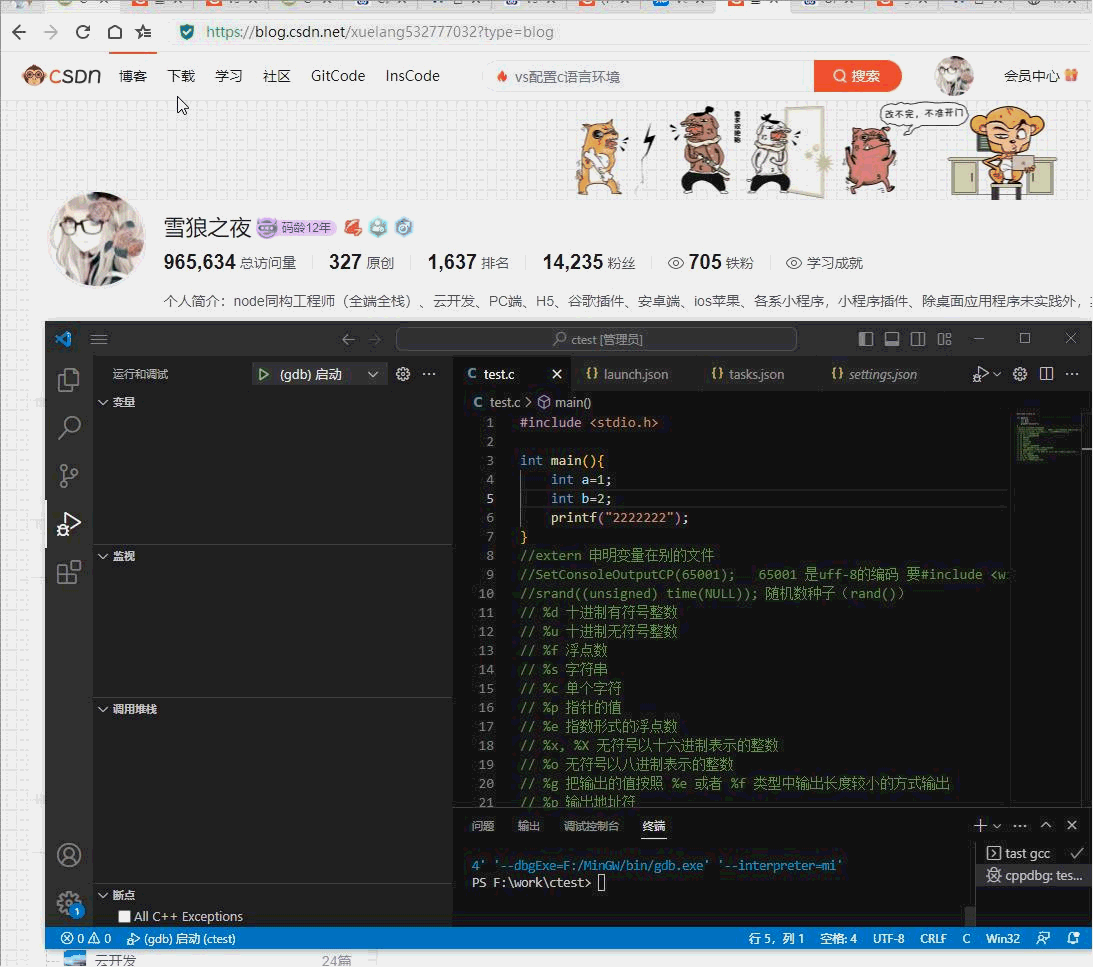
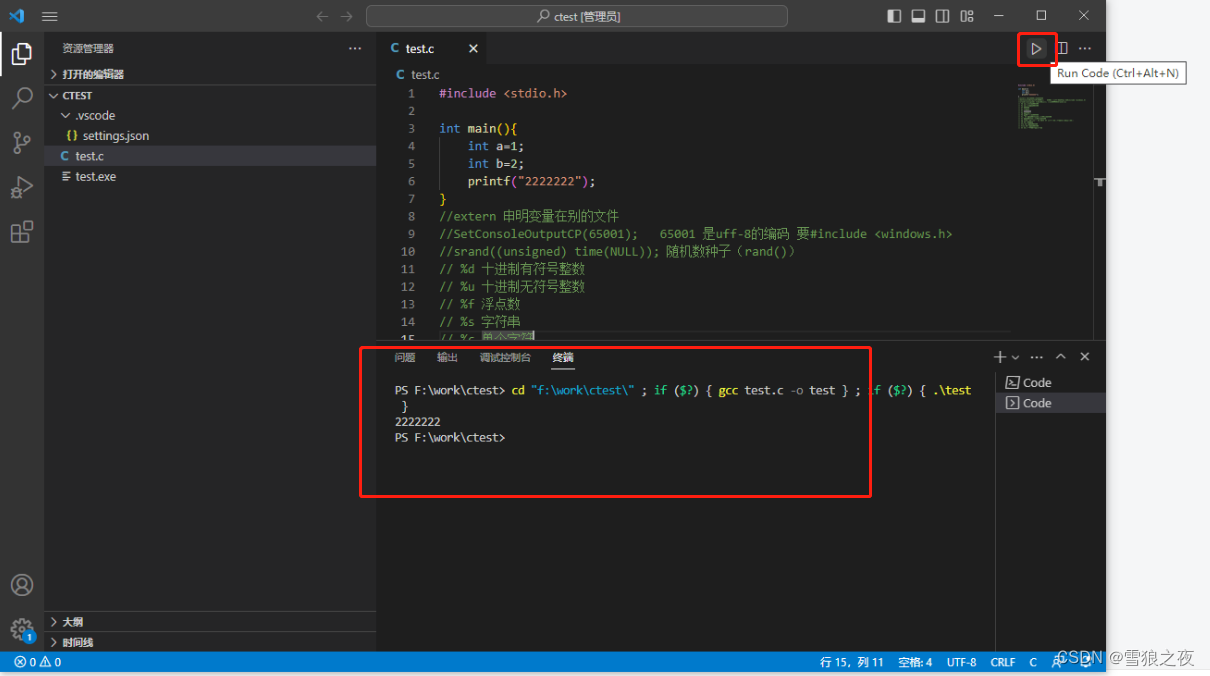
4. Create a new test.c file, and then use vs to open the directory where the file is located. The code is as follows
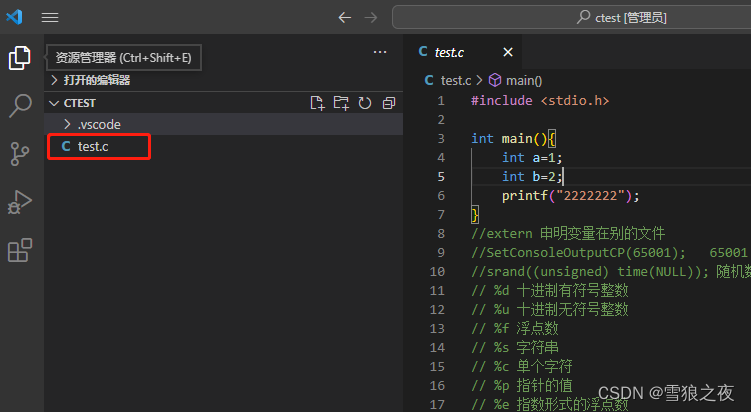
#include <stdio.h>
int main(){
int a=1;
int b=2;
printf("2222222");
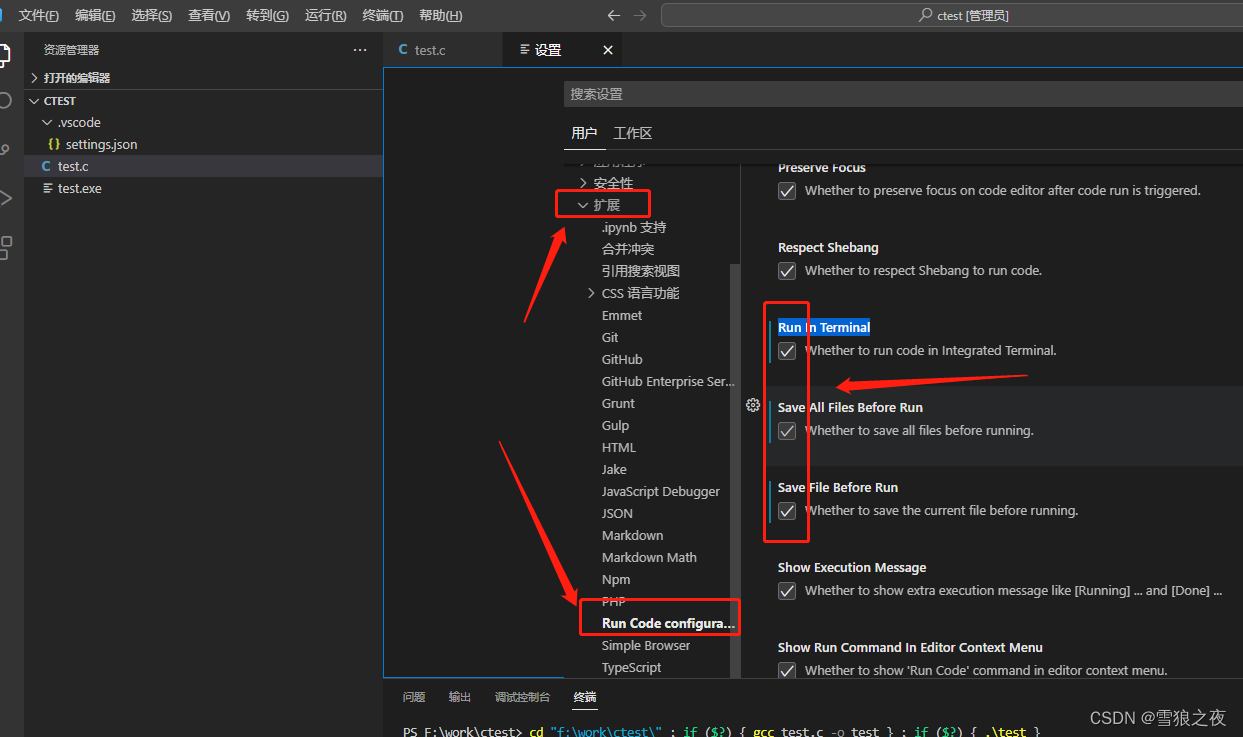
}5. Vscode menu -> Settings - tick the following three first, save
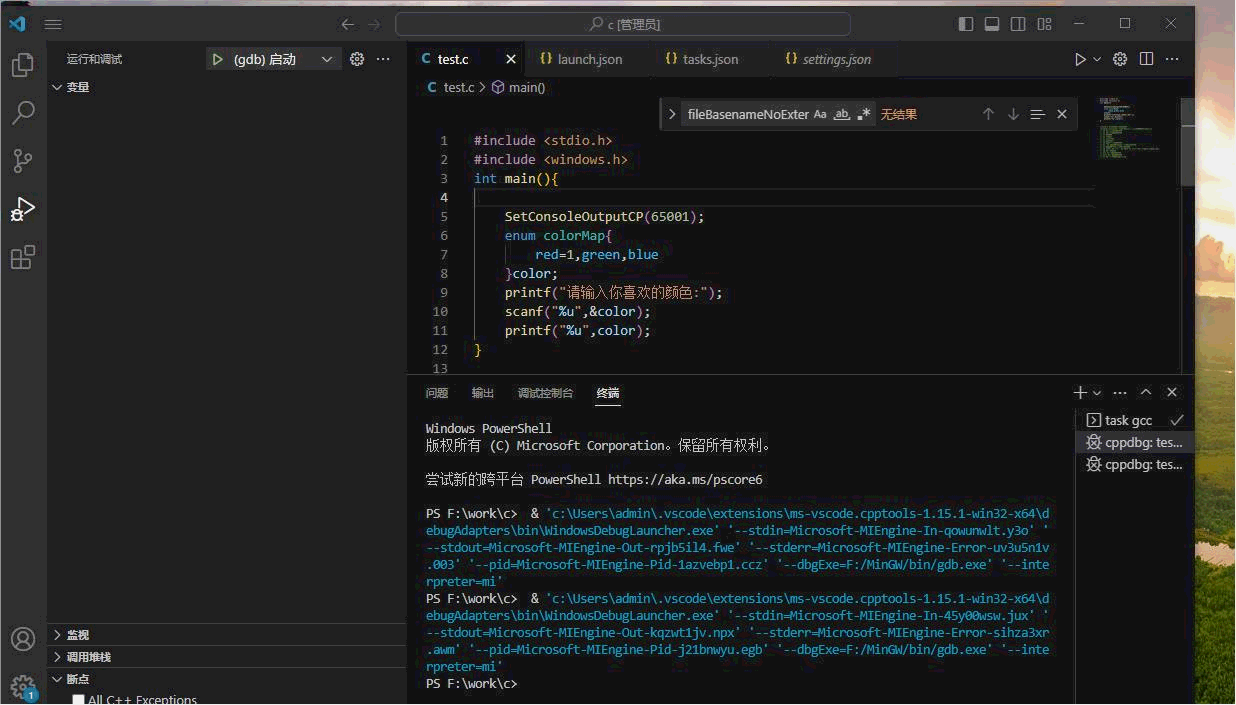
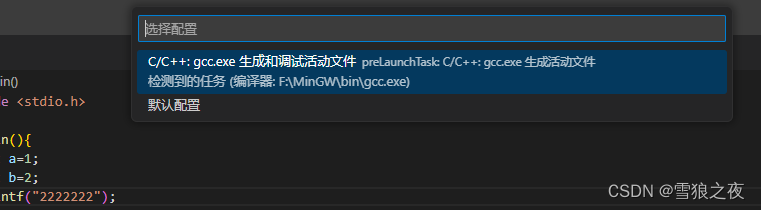
6. Run it first to see if it can move
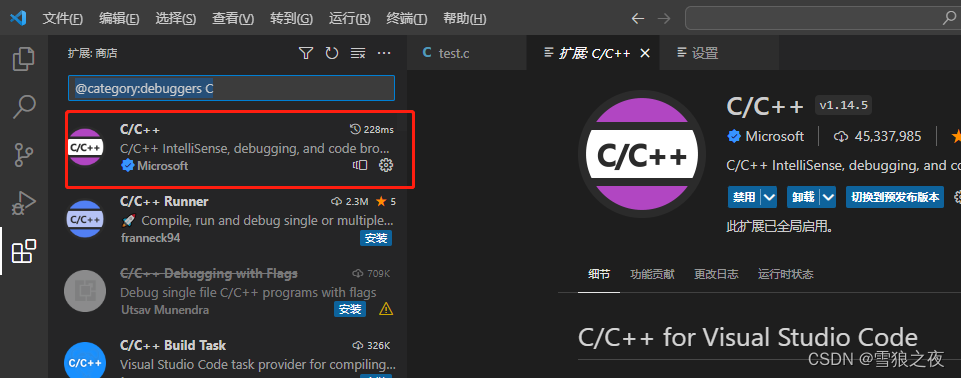
7. Install c to debug @category:debuggers C
7. Choose c++ (GDB/LLDB)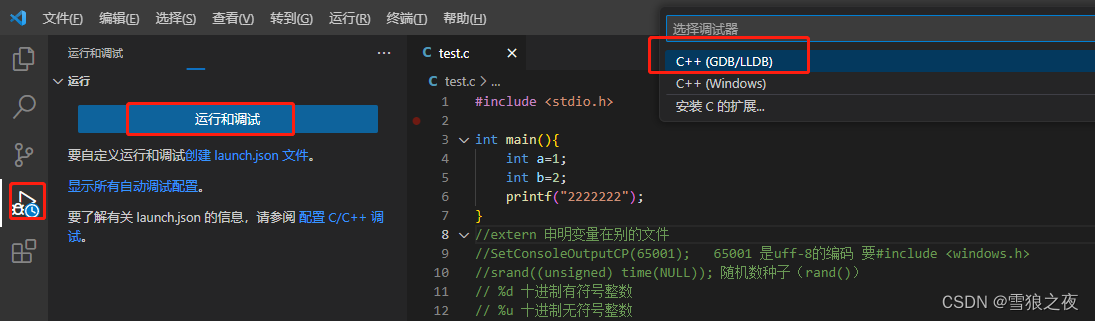
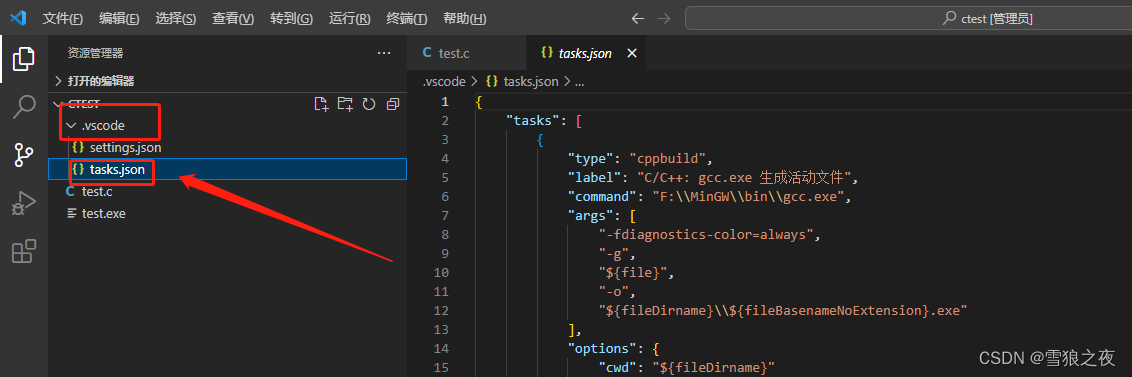
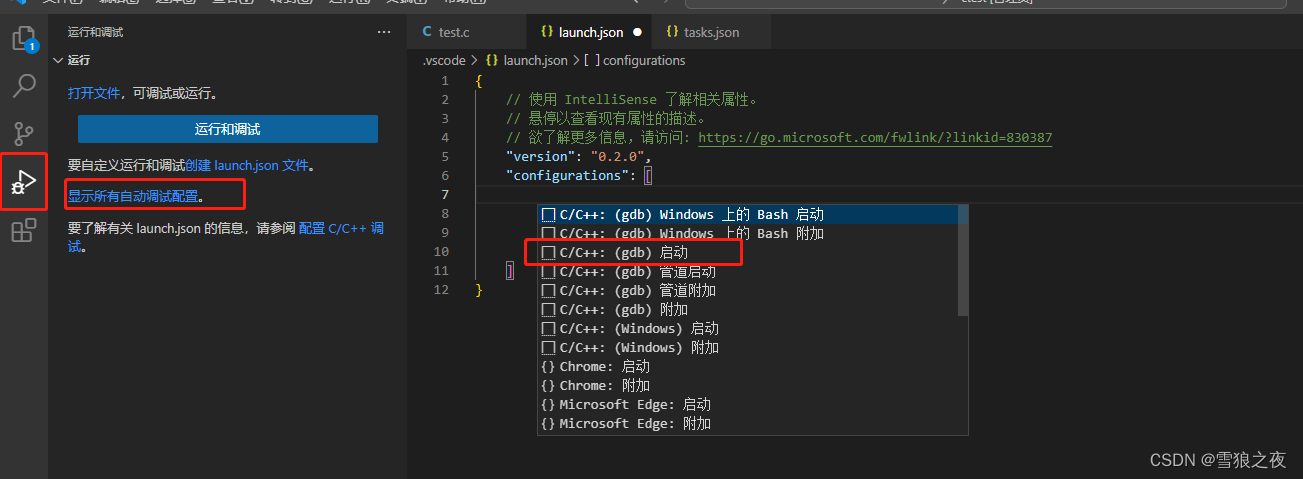
At this time, there is an additional file /.vscode/tasks.json in your directory, pay attention, leave it alone! ! !
Go back and create launch.json at point debug 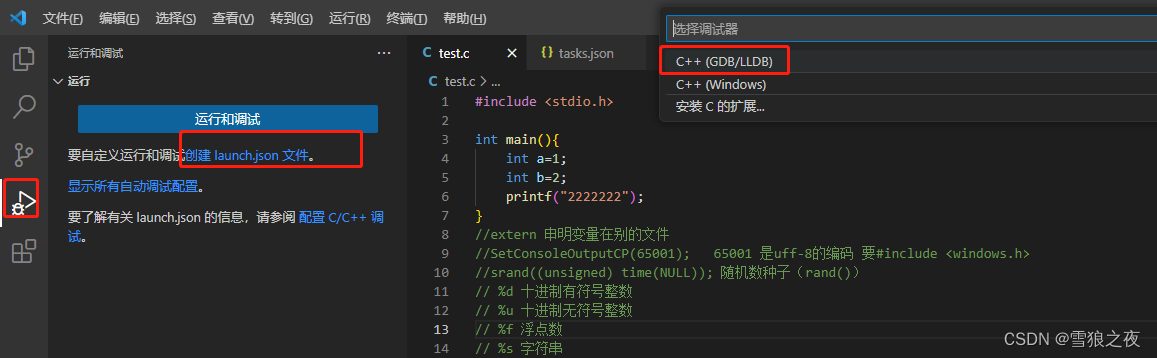
one more file
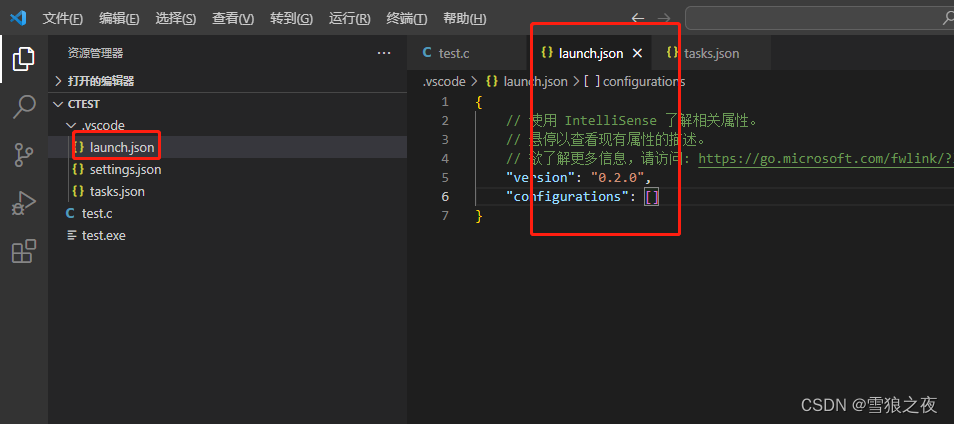
point him

{
    // 使用 IntelliSense 了解相关属性。
    // 悬停以查看现有属性的描述。
    // 欲了解更多信息,请访问: https://go.microsoft.com/fwlink/?linkid=830387
    "version": "0.2.0",
    "configurations": [
        {
            "name": "(gdb) 启动",
            "type": "cppdbg",
            "request": "launch",
            "program": "输入程序名称,例如 ${workspaceFolder}/a.exe",
            "args": [],
            "stopAtEntry": false,
            "cwd": "${fileDirname}",
            "environment": [],
            "externalConsole": false,
            "MIMode": "gdb",
            "miDebuggerPath": "/path/to/gdb",
            "setupCommands": [
                {
                    "description": "为 gdb 启用整齐打印",
                    "text": "-enable-pretty-printing",
                    "ignoreFailures": true
                },
                {
                    "description": "将反汇编风格设置为 Intel",
                    "text": "-gdb-set disassembly-flavor intel",
                    "ignoreFailures": true
                }
            ]
        }

    ]
}
Alright, don't move here! , pay attention!!!!!! Your MinGW path is the one mentioned in the first step of the text 1! ! ! ! ! ! copy it
"miDebuggerPath": "F:/MinGW/bin/gdb.exe","program": "${workspaceFolder}/test.exe",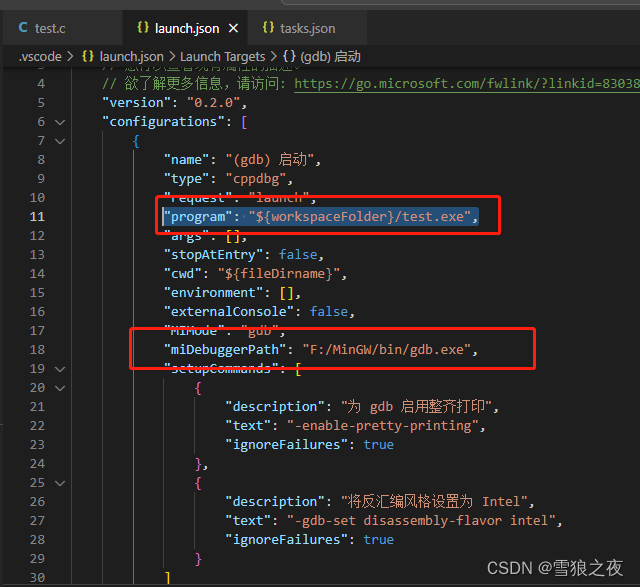
Then to your back test.c, run
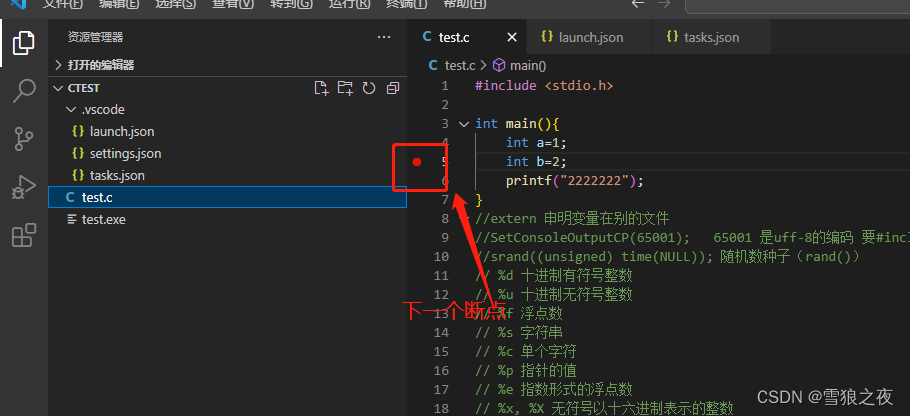
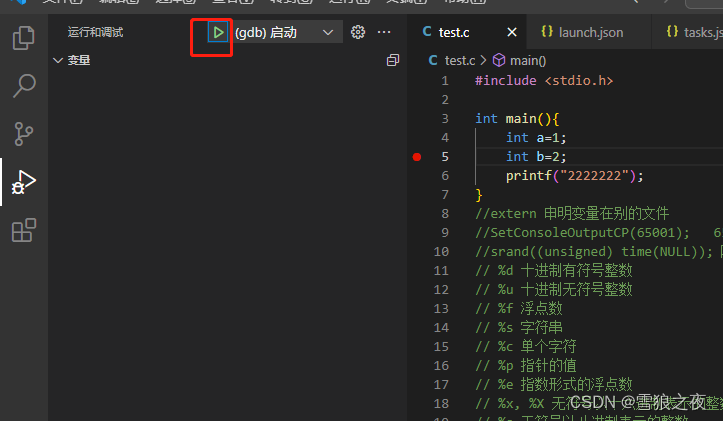
Ok, the first step is completed, this is only for the file test.c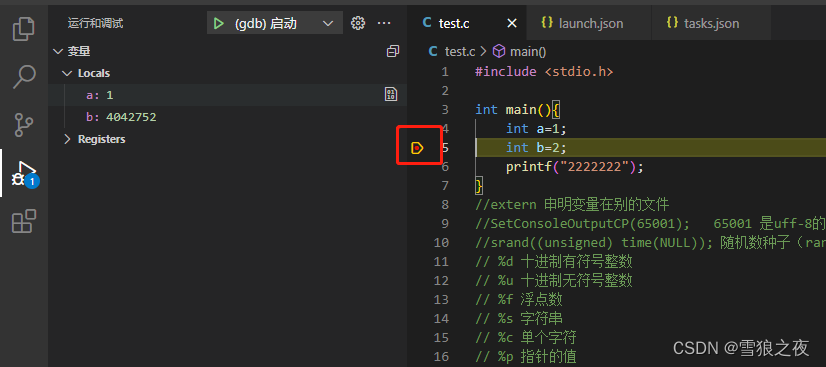
You have passed the above, we are continuing
Open launch.json, modify and save
"program": "${workspaceFolder}/${fileBasenameNoExtension}.exe", "preLaunchTask": "tast gcc" //修改此项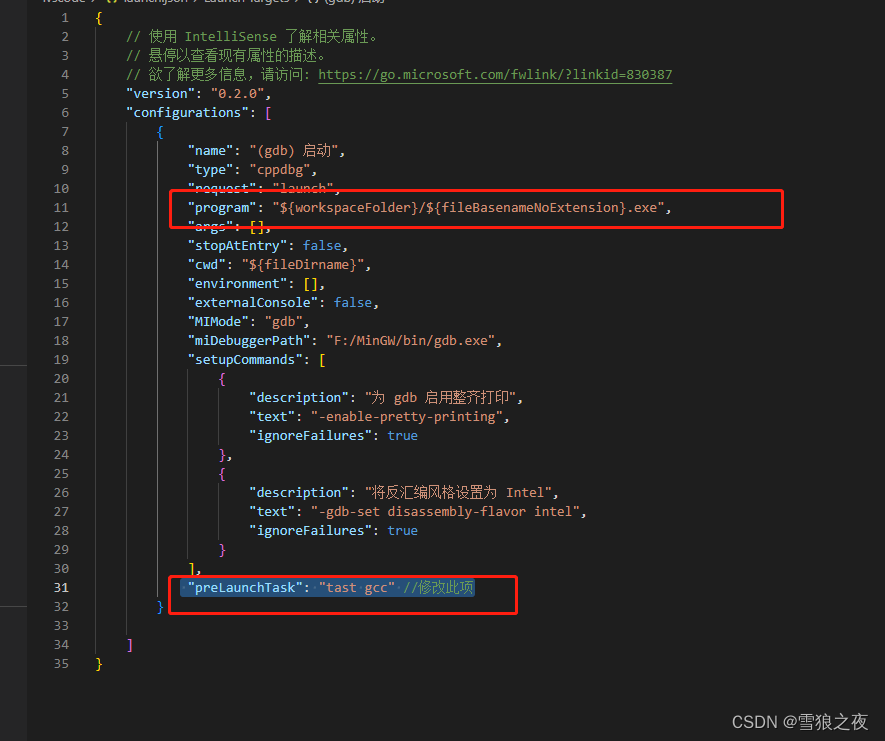
In open tasks.json
1. Comment out // "-fdiagnostics-color=always",
2. Modify the label
"label": "tast gcc",{
"tasks": [
{
"type": "cppbuild",
"label": "tast gcc",
"command": "F:\\MinGW\\bin\\gcc.exe",
"args": [
// "-fdiagnostics-color=always",
"-g",
"${file}",
"-o",
"${fileDirname}\\${fileBasenameNoExtension}.exe"
],
"options": {
"cwd": "${fileDirname}"
},
"problemMatcher": [
"$gcc"
],
"group": {
"kind": "build",
"isDefault": true
},
"detail": "调试器生成的任务。"
}
],
"version": "2.0.0"
}keep! ! !
Ok, now, let's go back to test.c debugging