Introduction
:<canvas></canvas>isHTML5new, an elementJavaScriptin which an image can be drawn using script (usually)HTML. Provides a way to draw graphics via JavaScript and HTML 's <canvas> element. It can be used for animation, game screens, data visualization, image editing (such as photo collections), and real-time video processing.Reference document: Canvas - Web API interface reference | MDN
1. The canvas tag
To use canvas, you need to add a canvas tag to the page
<canvas id="canvas" width="300" height="300">
    游览器不支持 canvas , 替换成里面的内容。
	其他标签代替 : <img src="url" alt="代替图">
 </canvas>
Notice:
- Canvas default width: 300, height: 150.
- It is best to display the modified width and height in the label. If the ratio is different from the default value, it may distort the drawn image if the modification is made in the CSS table.
- In older browsers (before IE9), add a content displayed when the canvas is not supported in the canvas tag (if the browser supports the canvas tag, the content of the tag body will not be displayed, only when the browser does not support the canvas tag show the content inside)
- The end tag cannot be omitted
2. Rendering context
canvas will create a canvas with a fixed size, and will expose one or more rendering contexts (Rendering Context) (understandable as a brush)
Use the rendering context to operate on the painting step
Get the rendering context
Obtain the rendering context through the getContext method of the canvas node
A parameter needs to be passed in, 2d or webgl, etc., only 2d is introduced here (drawing 2d images)
const canvas = document.querySelector('#myCanvas');
if (!canvas?.getContext){
    console.log('不支持getContext');
    return;
}
ctx = canvas.getContext('2d');  // 这里的ctx指代的就是canvas渲染上下文
tips: Because some browsers do not support the getContext method, you can check it before using it
3. Use rendering context (main)
The rendering context can be filled with fill() by drawing, or stroke() after drawing .
The default color is black when the rendering context is not set.
3.1 Set the color
Setting color is divided into setting fill color (fillStyle()) and stroke color (strokeStyle()).
Every time the graphics are colored, the color set by the current rendering context will be selected for coloring, if there is no default black.
And the color value can use rgb, rbga, color name (such as red), hexadecimal color code (#ff0000) ...
//  设置填充颜色 , 用于填充图像
ctx.fillStyle = "rgba(0,0,0,0.2)";
//  设置边框颜色 , 用与描绘边框时填充边框
ctx.strokeStyle = 'green'
// ctx.strokeStyle = '#ace'
Once the color is set, there are two ways to use the color:
1. It is automatic and immediate coloring after the picture is created. (Common)
ctx.fillRect(x,y,width,height) : Fill the quadrilateral of (x,y) in the upper left corner.
ctx.strokeRect(x,y,width,height) : Quad stroke with (x,y) in the upper left corner.
2. Create graphics first, then color
ctx.rect(20,20,30,30) ; ctx.fill() : draw a quadrilateral first, and then call the fill() method to fill in the color
ctx.rect(20,20,30,30) ; ctx.stroke() : Draw a quadrilateral first, then call fill() method to stroke
3.2 Drawing graphics
1. Draw a rectangle
x,y are the coordinates of the upper left corner relative to the drawing step, width width/height height
1). rect(x,y,width,height) : create a rectangle (invisible), need to use fill/stroke for coloring (as above way 2)
2). fillRect(x, y, width, height) : Draw a filled rectangle.
3). strokeRect(x, y, width, height) : draw a rectangle border.
4). clearRect(x, y, width, height) : Clear the specified rectangular area, and then this area will become completely transparent
2. Draw a path (path) that is, draw a line, generally divided into 4 or 5 steps
1). Create path ctx.beginPath (required)
2). Set the starting point ctx.moveTo(x,y) (required)
3). ctx.lineTo(x,y) : Draw a straight line from the starting point to x,y (required)
4). ctx.closePath() : will connect the last end with the starting point, closing the path (not necessary)
5). ctx.fill() / ctx.stroke() : fill or stroke (required)
If it is coloring, it is a closed figure formed by connecting the end point and the starting point for coloring.
If it is a stroke, only the actual edge is drawn, that is, if there is no closed path, there will be no line between the end point and the starting point, and there will be no stroke
3 Draw the arc
There are two ways to draw arcs:
1. arc(x,y,r,starAngle,endAngle,direction)
x ,y means circle, r means radius
starAngle represents the starting radian (in rad), and endAngle represents the ending radian.
direction (Boolean value): Indicates the direction of drawing, true is counterclockwise, false is clockwise (default)
**important point : **
Degrees are in radians, use multiples of Math.PI to represent
0 radians to represent the positive direction of the X-axis
Blue: ctx.arc(10,10,10,0,Math.PI/2,true)
Red: ctx.arc(10,10,10,0,Math.PI/2, false)

2. Draw the arc by drawing the path arcTo(a,b,c,d,e)
a, b: control point coordinates 1
c , d : control point coordinates 2
e : arc radius
The arc is determined by the two tangent lines between control point 1 and the starting point and control point 1 and control point 2, but the starting point and control point 2 are not necessarily tangent points

4. Draw a Bezier curve
ctx.quadraticCurveTo(): Adds a quadratic Bézier path.
ctx.bezierCurveTo(): Add a 3rd degree Bezier curve path. This method requires three points. The first and second points are the control points, and the third point is the end point. The starting point is the last point of the current path, which can moveTo() be modified by calling before drawing the Bezier curve. (For details, please refer to MDN)
5. Draw the text
Use fillText("text", x,y,[maxWidth]) to draw the text, use stroke to draw the edge of the text
text style:
ctx.font = value : Set text style, like CSS settings, default 10px sans-serif
ctx.textAlign = value : Text alignment option. Possible values include: start, end, left, right or center. The default value is start.
ctx.textBaseline = value : Text direction. Possible values include: ltr, rtl, inherit. The default value is inherit.
//文字对齐方式 start、end、center、left、right(选填)
ctx.textAlign = 'start';
//设置字体和尺寸 (必填)
ctx.font = '400 12px PingFangSC-Regular';  // 第一项类似于font-weight,可以设置为bold/normal等
//填充文字 x-横坐标 y-纵坐标 (必填)
ctx.fillStyle = 'rgba(0,0,0,0.85)';
ctx.fillText('hello canvas', 32, 50);
6. Draw the picture
ctx.drawImage(img,0,w,h) , draw the image object to the target coordinate position
Note: If the image is loaded from the network, it is best to wait for img.onload before drawing
The first parameter is: the source of the picture to be drawn, but it is a picture, or it can be a canvas node
2nd and 3rd parameters: The upper left corner of the target position. The upper left corner of the final drawn picture is the point.
The 4th and 5th parameters are width and height respectively. Control image size.
7. Slicing
drawImage(image, sx, sy, sWidth, sHeight, dx, dy, dWidth, dHeight)
Parameter 1: image source, it can also be a canvas,
2,3 : A point on the image source, which is the upper left corner of the cutting image
4,5 : Width and height, cut image size
6,7 : The starting point of drawing the graph (upper left corner point)
8,9 : the width and height of the drawing
4. Style settings
global transparency
ctx.globalAlpha = transparencyValue
The value of transparencyValue is 0-1, 0 is completely transparent, 1 is completely opaque
After setting, it will not affect the ones that have been marked before, but will affect the subsequent ones. Even if raba(0,0,0,1) is used later
graph style
- ctx.lineWidth : line width (unitless, default px)
- ctx.lineCap : line cap (also called line end)
There are butt to cut off directly, round to dome, square to add a square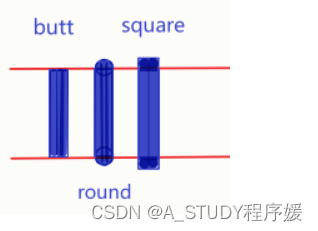
- ctx.lineJoin : the method of connecting lines between line segments
round Draws the shape of the corner by filling an additional sector whose center is at the end of the connected part. The radius of the fillet is the width of the line segment.
bevel fills an additional triangle-based area at the end of connected parts, each with its own independent rectangular corner.
miter (default) forms an additional diamond-shaped region by extending the outer edges of connected parts so that they meet at a point.
-
ctx.setLineDash (solid line length, gap): set to a dashed line
-
ctx.lineDashOffset : The starting offset of the dashed line
5. Get the Canvas as a picture
canvas.toDataURL()
 let img = document.querySelector('img');
let imgdata = canvas.toDataURL('image/png');
 let newdata = imgdata.replace(/^data:image\/png/, 'data:image/jpeg'); (看情况使用)
 img.src = newdata;
6. Examples
Example 1: Draw a right angle
ctx.beginPath();
ctx.moveTo(0,0);
ctx.lineTo(0,50);
ctx.lineTo(80,50);
ctx.rotate(0.5 * Math.PI);
ctx.stroke();
Example 2: Draw a rounded rectangle
ctx.beginPath();
ctx.arc(150, 150, 50, 0, 0.5 * Math.PI, false);
ctx.moveTo(150,200);
ctx.lineTo(50,200);
ctx.arc(50, 150,50,0.5 * Math.PI,1 * Math.PI, false);
ctx.moveTo(0,150);
ctx.lineTo(0,50);
ctx.arc(50, 50,50,1 * Math.PI,1.5 * Math.PI, false);
ctx.moveTo(50,0);
ctx.lineTo(150,0);
ctx.arc(150, 50,50,1.5 * Math.PI,2 * Math.PI, false);
ctx.moveTo(200,50);
ctx.lineTo(200,150);
ctx.stroke();
Effect:

Reference: https://blog.csdn.net/NiHoAjy/article/details/119682331