GDB is a debugger that can be used to debug C/C++ programs. This C/C++ needs to generate a symbol table before it can be called by GDB. For example C++:
g++ -g source.cpp
GDB common commands
First, an ELF file (exe curable and linkable format) with debugging symbols must be generated. Simply put, it is an executable file with debugging symbols. Add -gparameters to compile.
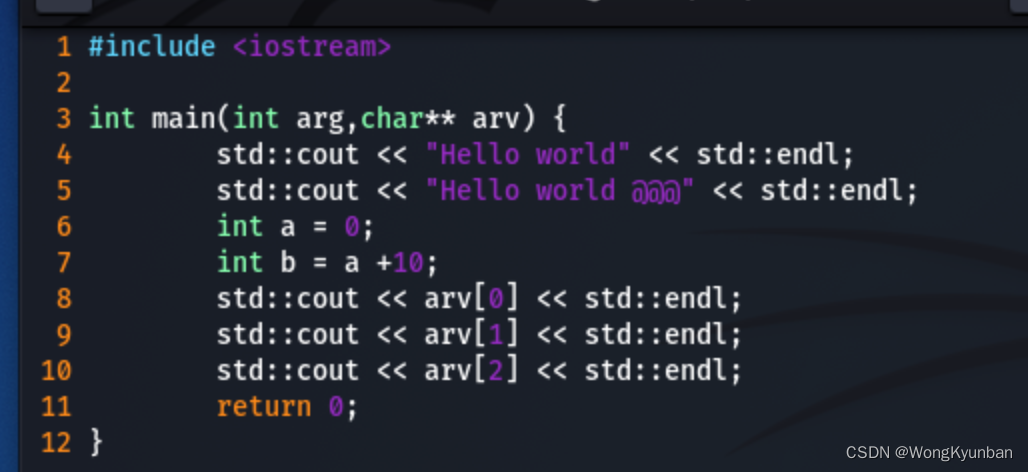
hello.cpp:
──(kali㉿kali)-[~/dev/Bear]
└─$ g++ -o world -g hello.cpp
──(kali㉿kali)-[~/dev/Bear]
└─$ ls
world hello.cpp
Start the gdb debugger
──(kali㉿kali)-[~/dev/Bear]
└─$ gdb
In order to facilitate our debugging, run before starting the adjustmentlayout next
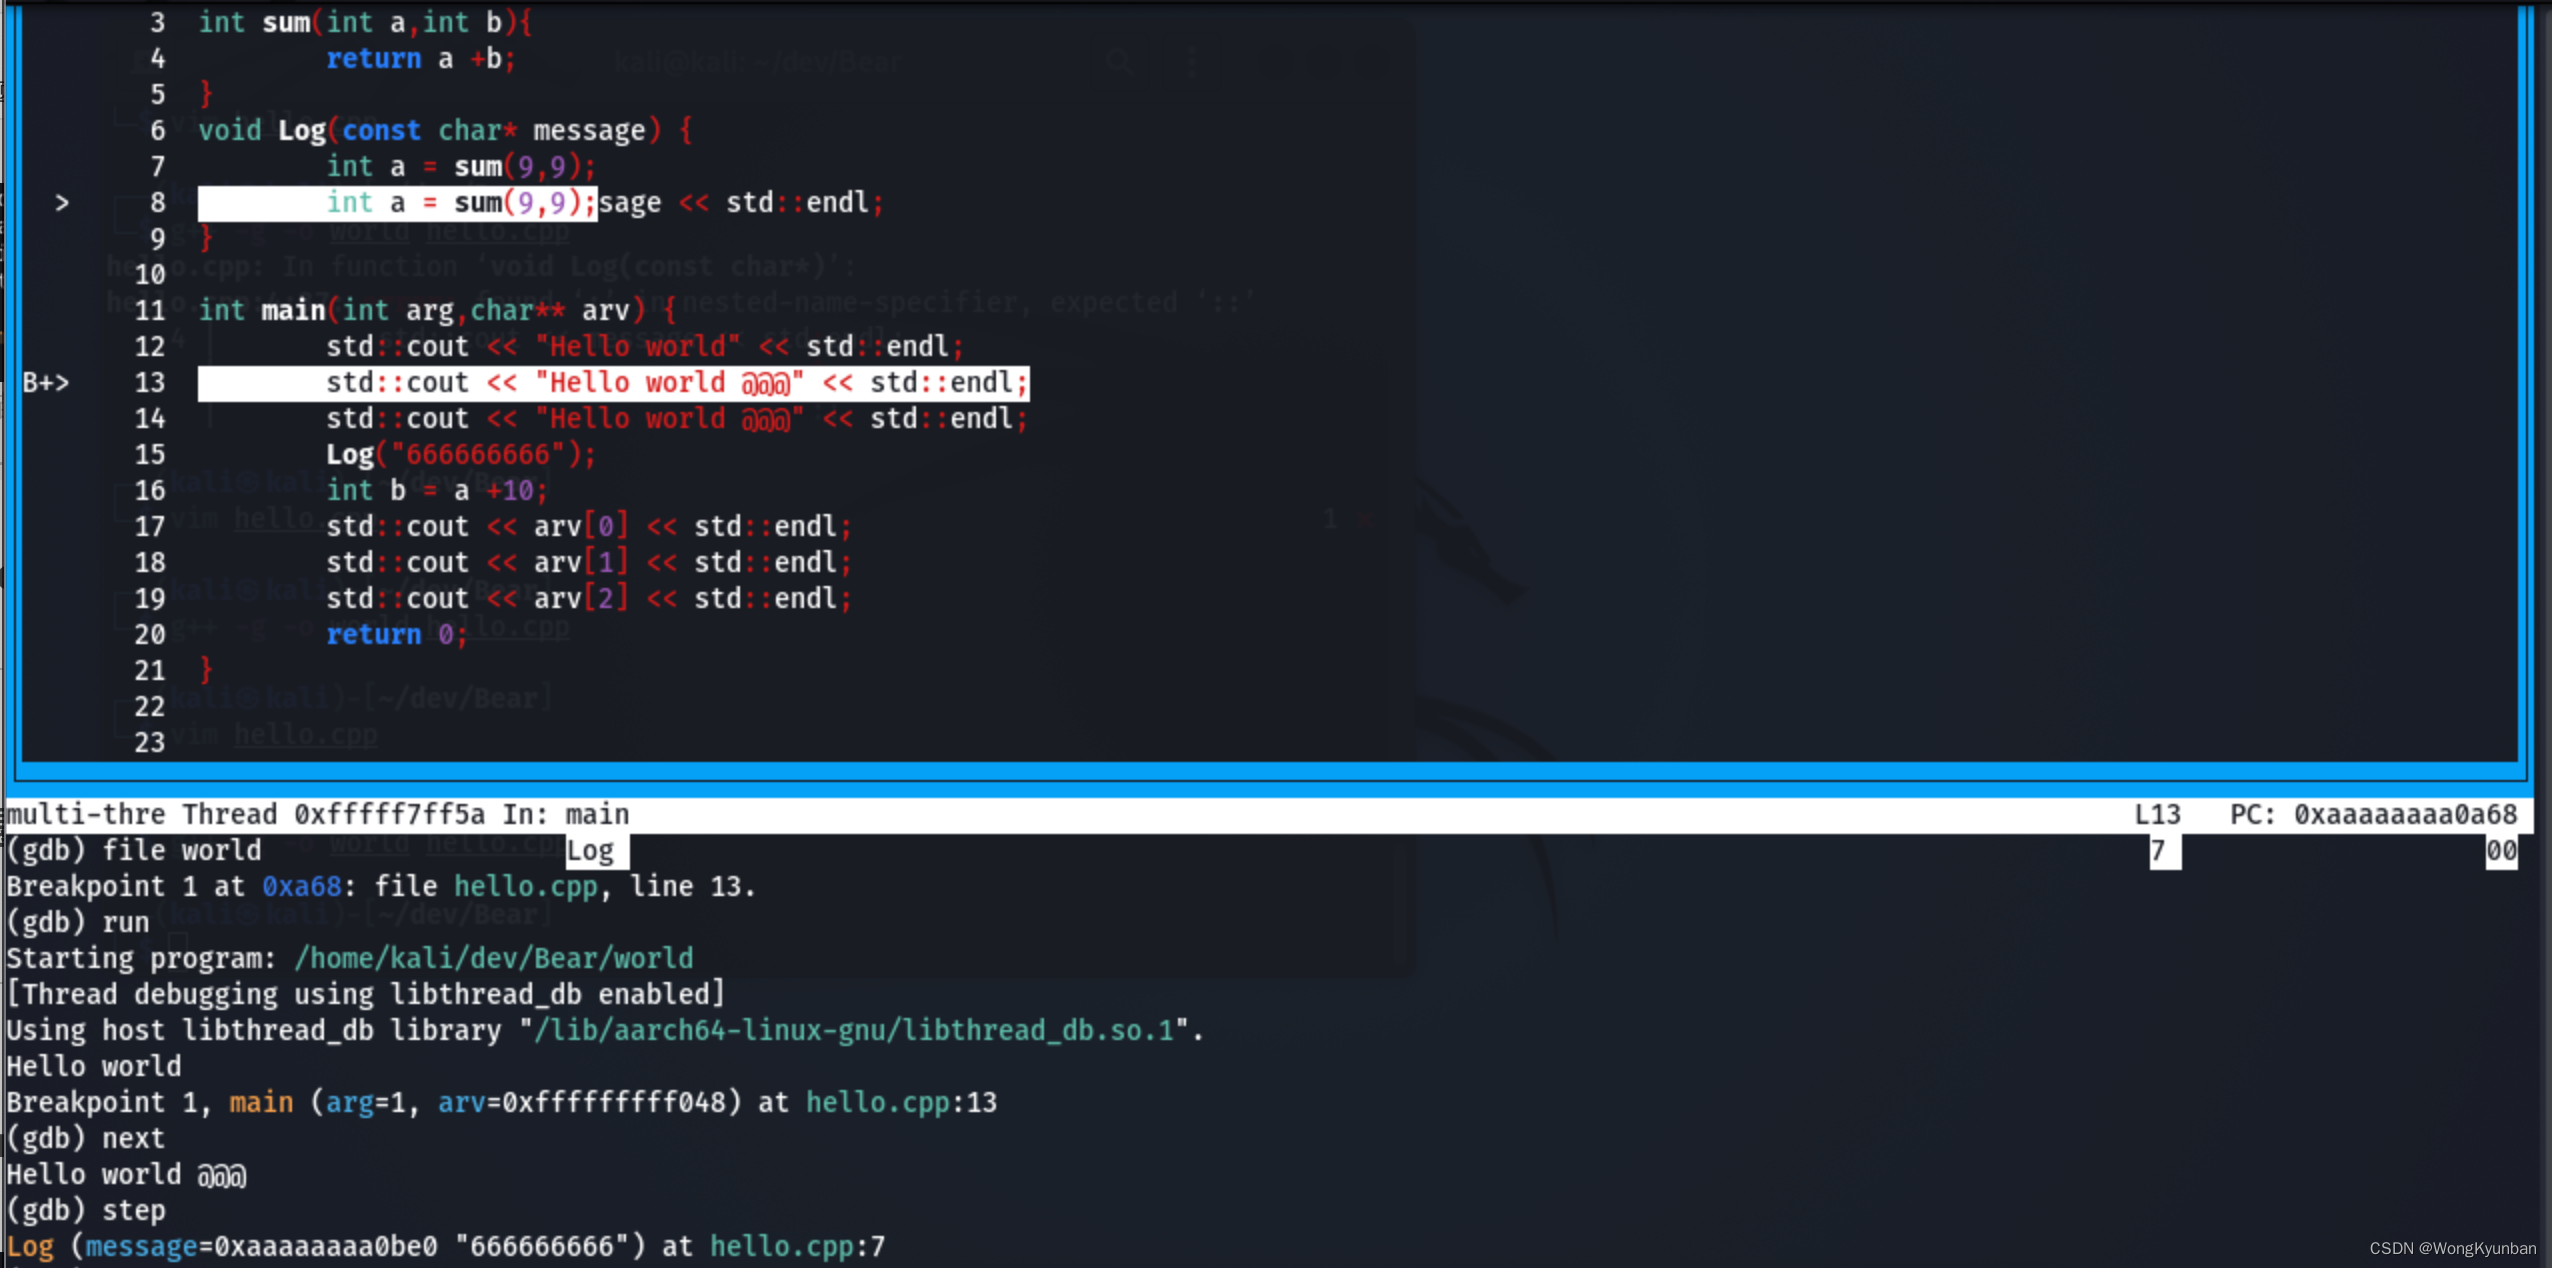
This command will display the source code around the current position in the program. This view is helpful for those new to gdb, especially when working with source code you are not familiar with.
After starting GDB, for the first time enter
(gdb) layout next


Repeat the execution again layout next, and the program in assembly language will be displayed.
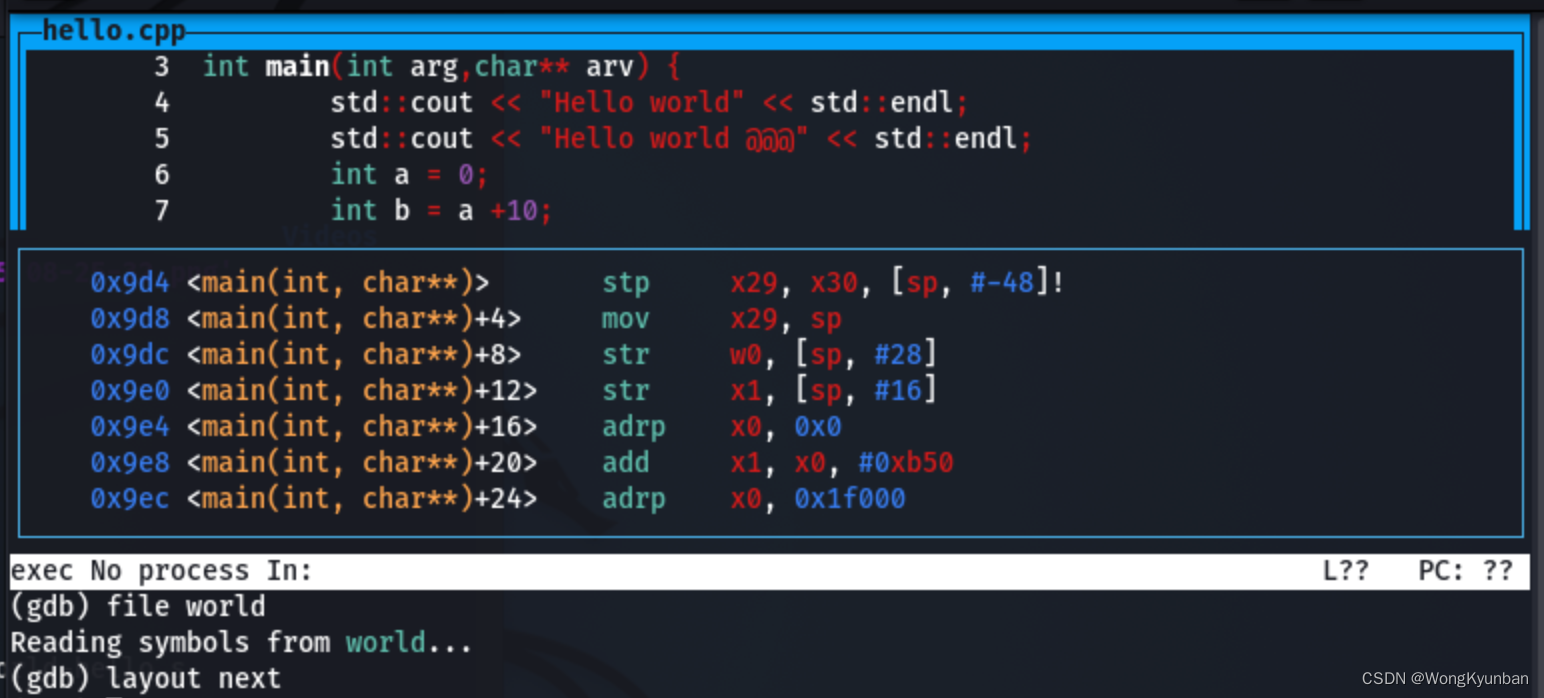
layout prevThis command is to return to the previous mode.
Use the world file for debugging, and use the file file to read in the symbol of the world file for debugging
Use file to load the symbols of the file used for debugging
(gdb) file world
Reading symbols from world...
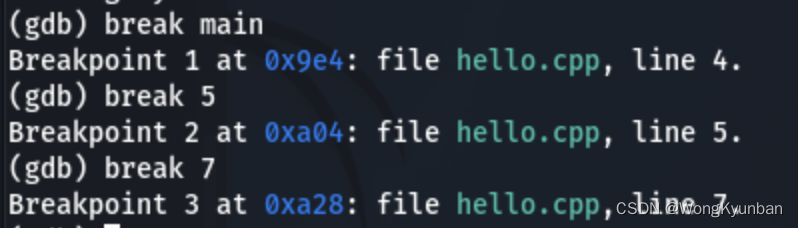
set breakpoint
Breakpoint at specific line number:
(gdb) break 2
(gdb) break 7
You can also breakpoint on a function:
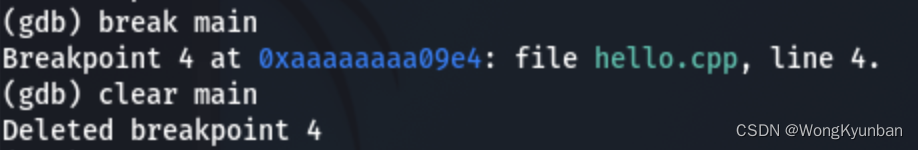
(gdb) break main
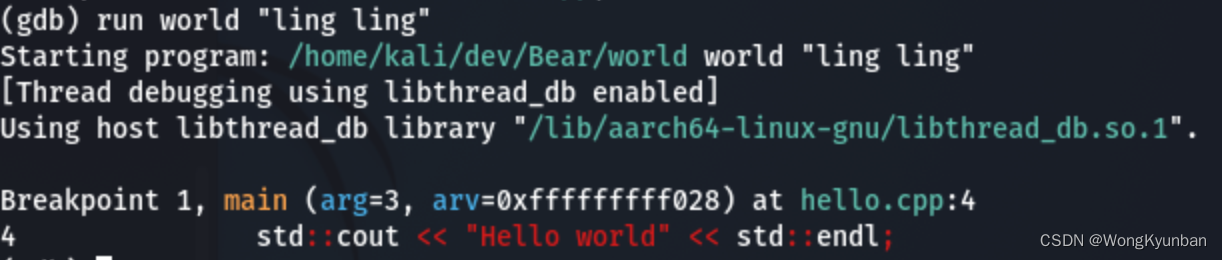
Run the world program
(gdb) run world
Or pass some parameters to the world program:
(gdb) run world "ling ling"
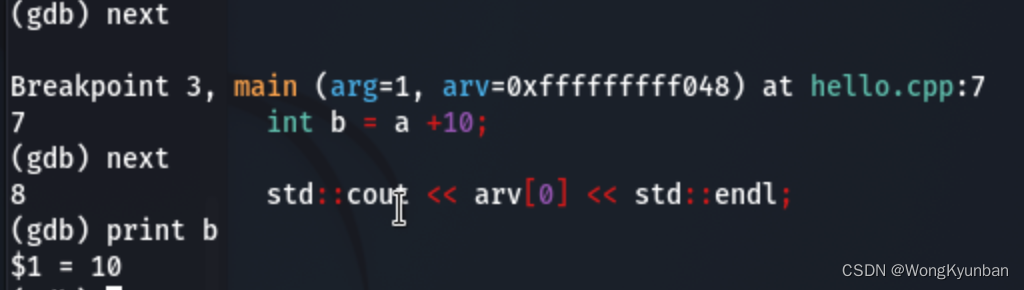
Use the next command to run to the next line
(gdb) next
If you encounter a function call and want to go in and have a look, you can use step
(gdb) step
If you have entered the function, and then you don't want to continue reading, and want to return to the place where it was called, you can use finish
(gdb) finish
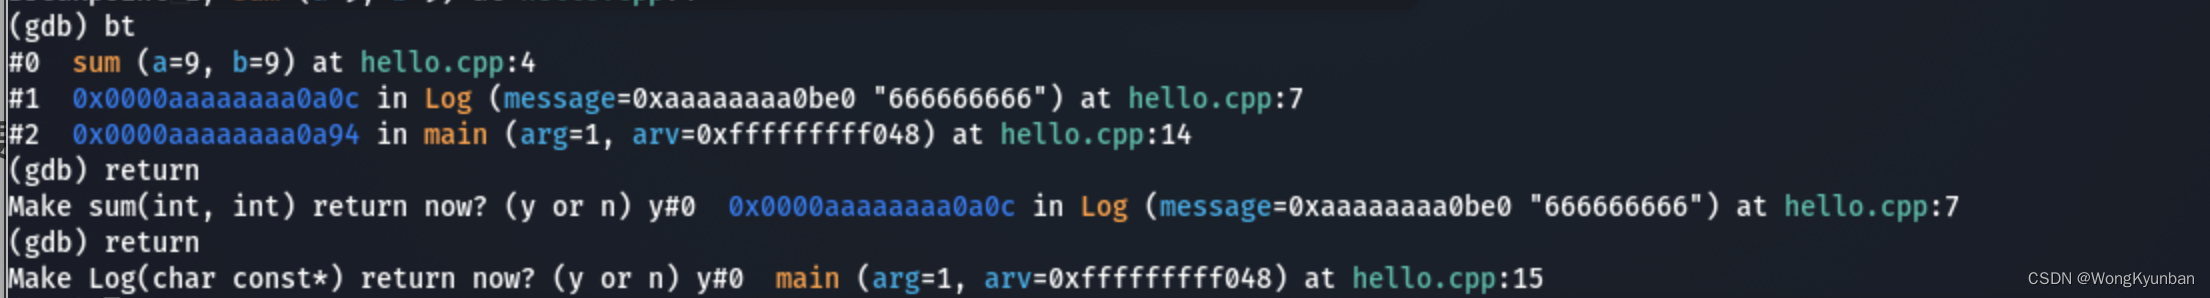
If you want to go back to the calling point, you can use the return command:
Use print to check the value of some variables
In addition to using print to check the value of some variables, you can also use display, which is different from print in that it will reprint the information after each instruction.

Use clear to clear the breakpoint
For example, clear the breakpoint on line 7
(gdb) clear 7

Or count breakpoints on a method name:
(gdb) clear main
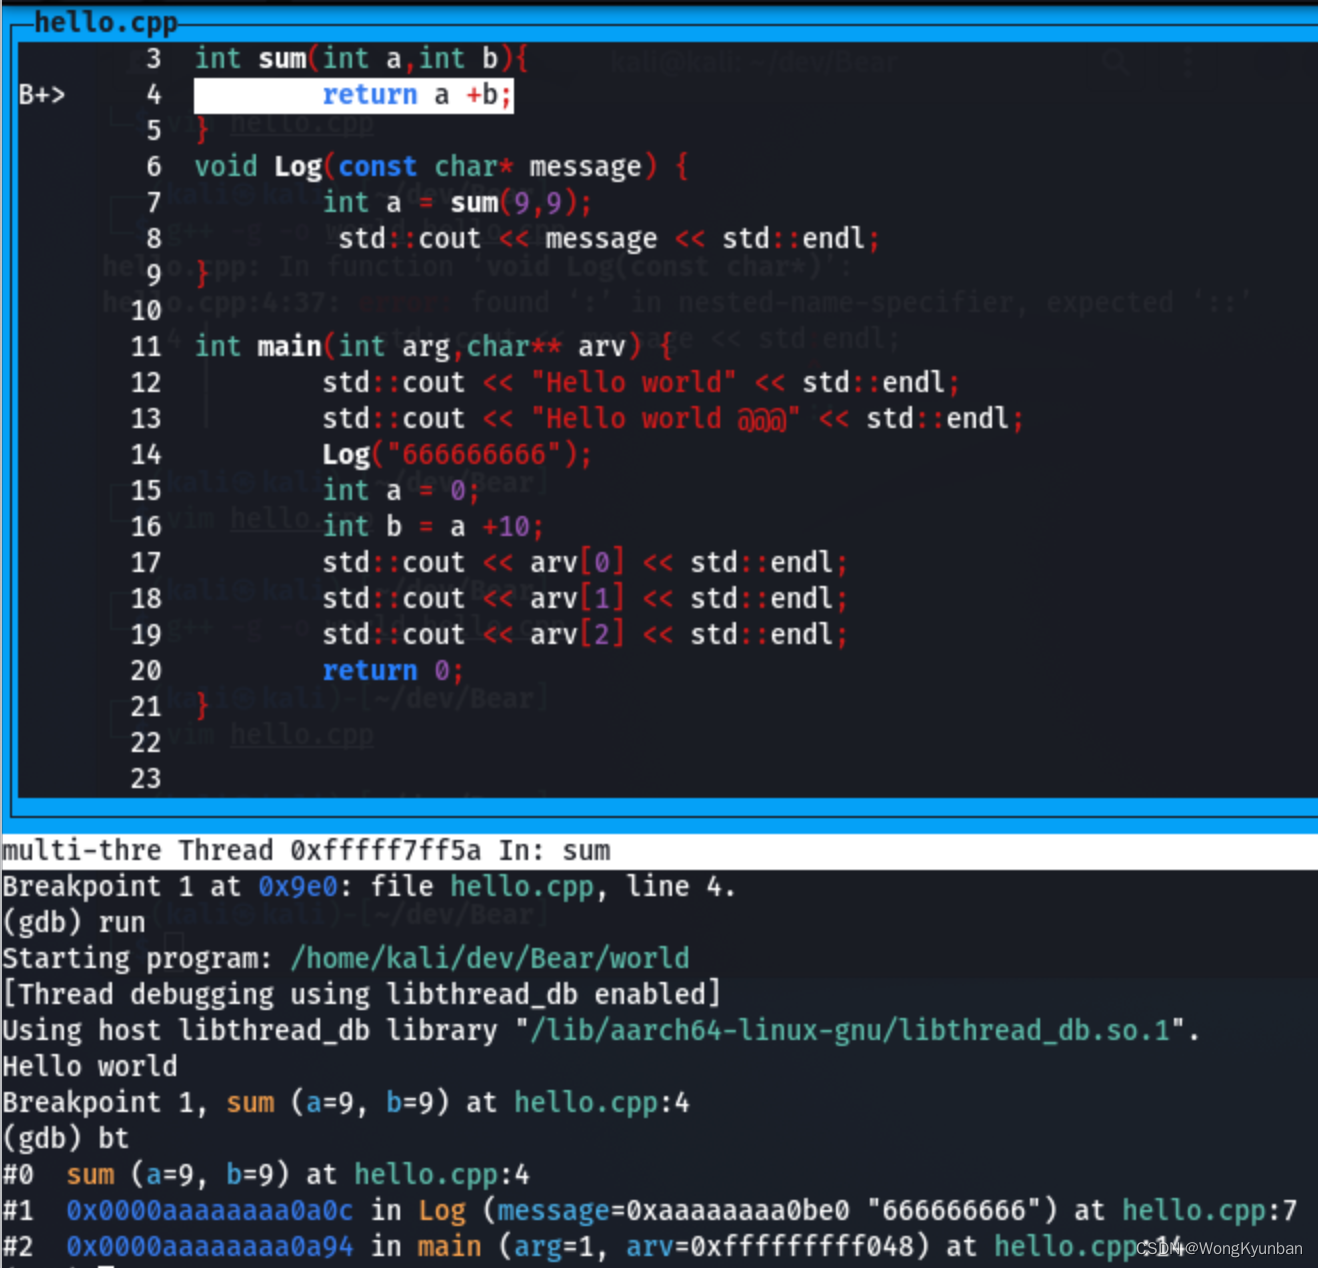
bt displays the function call stack, that is, every function that has been run since reaching this line, that is, displays the function call stack.
(gdb) bt
The continue command is used to continue from where the breakpoint stopped until the next breakpoint.
(gdb) continue
frame [number] goes to the selected frame in the call stack.
With the list command, print the area around the current line in the current source file. Show current line and called function stack
quit or exit are both gdb debuggers.
The above commands are commonly used. For more advanced use, you can find more useful information through the help command
(gdb) help
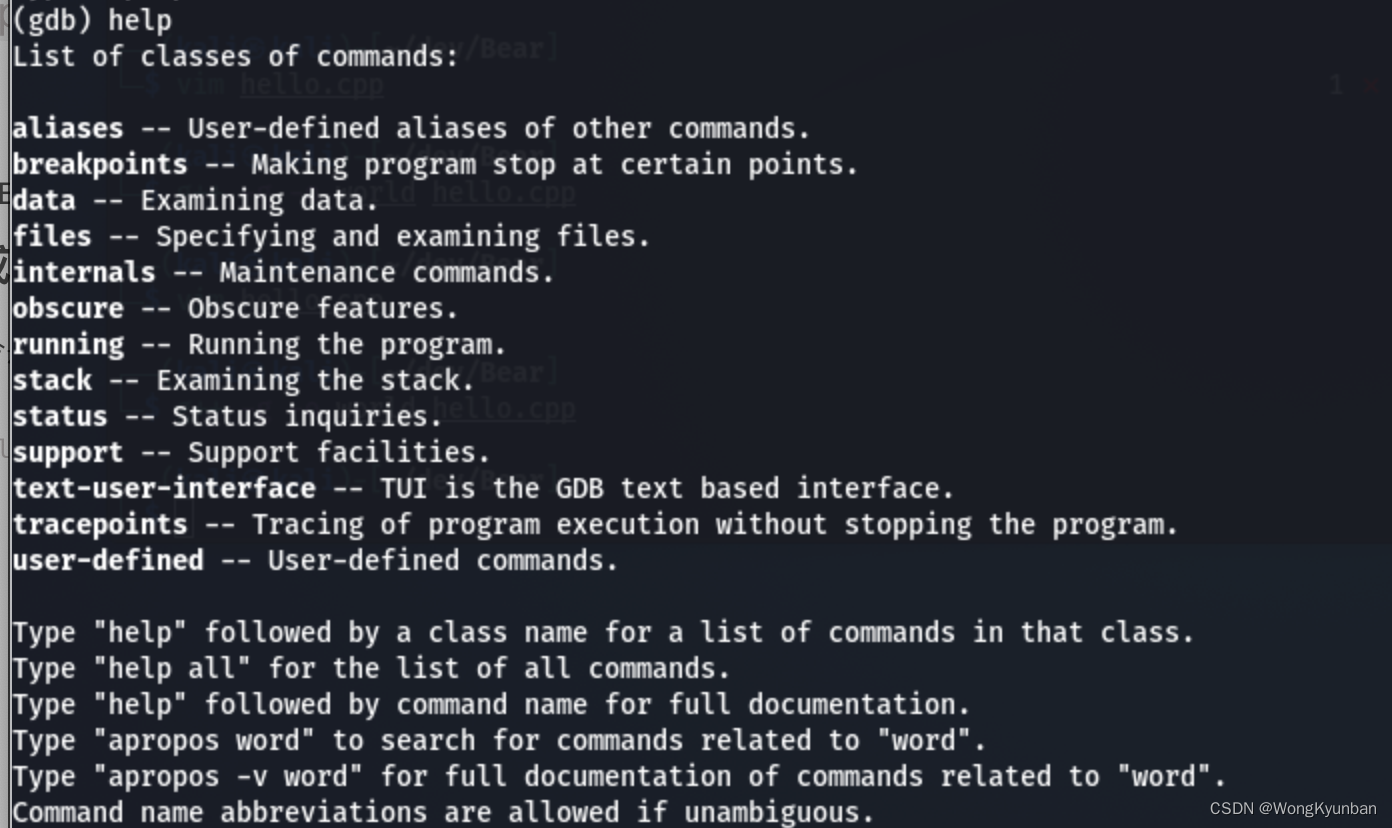
You can learn more advanced applications through the help command. It will not be expanded here. gdb is still very easy to learn.