Echarts is often used in the project, and it can be used directly without encapsulation, but it is inevitable to write a lot of repetitive configuration codes. If the encapsulation is not careful, it will be over-encapsulated, and the scalability and readability will be lost. I haven't found a good practice yet, but I saw an article by chance, which gave me inspiration. Found a package that I feel comfortable using so far.
train of thought
1. Combined with project requirements, configure the basic default general configuration for different types of charts, such as x/y, label, legend, etc.
2. Create chart component instances (do not use id, easy to repeat, and need to be operated dom, directly use refGet The current component is elused to create a chart), providing type(chart type) and options(chart configuration) two necessary attributes
3. According to the incoming type, load the default chart configuration
4. In-depth monitoring of the incoming options, update when the change overrides the default configuration, update Figure
5. Provides event support and supports echarton-demand binding and interaction of events
Pay attention to ensure that all the options arrays passed into the chart component are of
shallowReactivetype, to avoid the large amount of arrays, and the depth response will cause performance problems
Directory Structure
├─v-charts
││index.ts // 导出类型定义以及图表组件方便使用
││type.d.ts// 各种图表的类型定义
││useCharts.ts // 图表hooks
││v-charts.vue // echarts图表组件
││
│└─options // 图表配置文件
│bar.ts
│gauge.ts
│pie.ts
component code
v-charts.vue
<template><div class="v-charts" ref="chartRef" />
</template>
<script lang="ts" setup>
import { PropType } from "vue";
import * as echarts from "echarts/core";
import { useCharts, ChartType, ChartsEvents } from "./useCharts";

/**
 * echarts事件类型
 * 截至目前,vue3类型声明参数必须是以下内容之一,暂不支持外部引入类型参数
 * 1. 类型字面量
 * 2. 在同一文件中的接口或类型字面量的引用
 * // 文档中有说明:https://cn.vuejs.org/api/sfc-script-setup.html#typescript-only-features
 */
interface EventEmitsType {<T extends ChartsEvents.EventType>(e: `${T}`, event: ChartsEvents.Events[Uncapitalize<T>]): void;
}

defineOptions({name: "VCharts"
});

const props = defineProps({type: {type: String as PropType<ChartType>,default: "bar"},options: {type: Object as PropType<echarts.EChartsCoreOption>,default: () => ({})}
});

// 定义事件,提供ts支持,在组件使用时可获得友好提示
defineEmits<EventEmitsType>();

const { type, options } = toRefs(props);
const chartRef = shallowRef();
const { charts, setOptions, initChart } = useCharts({ type, el: chartRef });

onMounted(async () => {await initChart();setOptions(options.value);
});
watch(options,() => {setOptions(options.value);},{deep: true}
);
defineExpose({$charts: charts
});
</script>
<style lang="scss" scoped>
.v-charts {width: 100%;height: 100%;min-height: 200px;
}
</style>
useCharts.ts
import { ChartType } from "./type";
import * as echarts from "echarts/core";
import { ShallowRef, Ref } from "vue";

import {TitleComponent,LegendComponent,TooltipComponent,GridComponent,DatasetComponent,TransformComponent
} from "echarts/components";

import { BarChart, LineChart, PieChart, GaugeChart } from "echarts/charts";

import { LabelLayout, UniversalTransition } from "echarts/features";
import { CanvasRenderer } from "echarts/renderers";

const optionsModules = import.meta.glob<{ default: echarts.EChartsCoreOption }>("./options/**.ts");

interface ChartHookOption {type?: Ref<ChartType>;el: ShallowRef<HTMLElement>;
}

/**
 *视口变化时echart图表自适应调整
 */
class ChartsResize {#charts = new Set<echarts.ECharts>(); // 缓存已经创建的图表实例#timeId = null;constructor() {window.addEventListener("resize", this.handleResize.bind(this)); // 视口变化时调整图表}getCharts() {return [...this.#charts];}handleResize() {clearTimeout(this.#timeId);this.#timeId = setTimeout(() => {this.#charts.forEach(chart => {chart.resize();});}, 500);}add(chart: echarts.ECharts) {this.#charts.add(chart);}remove(chart: echarts.ECharts) {this.#charts.delete(chart);}removeListener() {window.removeEventListener("resize", this.handleResize);}
}

export const chartsResize = new ChartsResize();

export const useCharts = ({ type, el }: ChartHookOption) => {echarts.use([BarChart,LineChart,BarChart,PieChart,GaugeChart,TitleComponent,LegendComponent,TooltipComponent,GridComponent,DatasetComponent,TransformComponent,LabelLayout,UniversalTransition,CanvasRenderer]);const charts = shallowRef<echarts.ECharts>();let options!: echarts.EChartsCoreOption;const getOptions = async () => {const moduleKey = `./options/${type.value}.ts`;const { default: defaultOption } = await optionsModules[moduleKey]();return defaultOption;};const setOptions = (opt: echarts.EChartsCoreOption) => {charts.value.setOption(opt);};const initChart = async () => {charts.value = echarts.init(el.value);options = await getOptions();charts.value.setOption(options);chartsResize.add(charts.value); // 将图表实例添加到缓存中initEvent(); // 添加事件支持};/** * 初始化事件,按需绑定事件 */const attrs = useAttrs();const initEvent = () => {Object.keys(attrs).forEach(attrKey => {if (/^on/.test(attrKey)) {const cb = attrs[attrKey];attrKey = attrKey.replace(/^on(Chart)?/, "");attrKey = `${attrKey[0]}${attrKey.substring(1)}`;typeof cb === "function" && charts.value?.on(attrKey, cb as () => void);}});};onBeforeUnmount(() => {chartsResize.remove(charts.value); // 移除缓存});return {charts,setOptions,initChart,initEvent};
};

export const chartsOptions = <T extends echarts.EChartsCoreOption>(option: T) => shallowReactive<T>(option);

export * from "./type.d";
type.d.ts
 /*
 * @Description:
 * @Version: 2.0
 * @Autor: GC
 * @Date: 2022-03-02 10:21:33
 * @LastEditors: GC
 * @LastEditTime: 2022-06-02 17:45:48
 */
// import * as echarts from 'echarts/core';
import * as echarts from 'echarts'
import { XAXisComponentOption, YAXisComponentOption } from 'echarts';

import { ECElementEvent, SelectChangedPayload, HighlightPayload,} from 'echarts/types/src/util/types'

import {TitleComponentOption,TooltipComponentOption,GridComponentOption,DatasetComponentOption,AriaComponentOption,AxisPointerComponentOption,LegendComponentOption,
} from 'echarts/components';// 组件
import {// 系列类型的定义后缀都为 SeriesOptionBarSeriesOption,LineSeriesOption,PieSeriesOption,FunnelSeriesOption,GaugeSeriesOption
} from 'echarts/charts';

type Options = LineECOption | BarECOption | PieECOption | FunnelOption

type BaseOptionType = XAXisComponentOption | YAXisComponentOption | TitleComponentOption | TooltipComponentOption | LegendComponentOption | GridComponentOption

type BaseOption = echarts.ComposeOption<BaseOptionType>

type LineECOption = echarts.ComposeOption<LineSeriesOption | BaseOptionType>

type BarECOption = echarts.ComposeOption<BarSeriesOption | BaseOptionType>

type PieECOption = echarts.ComposeOption<PieSeriesOption | BaseOptionType>

type FunnelOption = echarts.ComposeOption<FunnelSeriesOption | BaseOptionType>

type GaugeECOption = echarts.ComposeOption<GaugeSeriesOption | GridComponentOption>

type EChartsOption = echarts.EChartsOption;

type ChartType = 'bar' | 'line' | 'pie' | 'gauge'

// echarts事件
namespace ChartsEvents {// 鼠标事件类型type MouseEventType = 'click' | 'dblclick' | 'mousedown' | 'mousemove' | 'mouseup' | 'mouseover' | 'mouseout' | 'globalout' | 'contextmenu' // 鼠标事件类型type MouseEvents = {[key in Exclude<MouseEventType,'globalout'|'contextmenu'> as `chart${Capitalize<key>}`] :ECElementEvent}// 其他的事件类型极参数interface Events extends MouseEvents {globalout:ECElementEvent,contextmenu:ECElementEvent,selectchanged: SelectChangedPayload;highlight: HighlightPayload;legendselected: { // 图例选中后的事件type: 'legendselected',// 选中的图例名称name: string// 所有图例的选中状态表selected: {[name: string]: boolean}};// ... 其他类型的事件在这里定义}// echarts所有的事件类型type EventType = keyof Events
}

export {BaseOption,ChartType,LineECOption,BarECOption,Options,PieECOption,FunnelOption,GaugeECOption,EChartsOption,ChartsEvents
}
options/bar.ts
import { BarECOption } from "../type";
const options: BarECOption = {legend: {},tooltip: {},xAxis: {type: "category",axisLine: {lineStyle: {// type: "dashed",color: "#C8D0D7"}},axisTick: {show: false},axisLabel: {color: "#7D8292"}},yAxis: {type: "value",alignTicks: true,splitLine: {show: true,lineStyle: {color: "#C8D0D7",type: "dashed"}},axisLine: {lineStyle: {color: "#7D8292"}}},grid: {left: 60,bottom: "8%",top: "20%"},series: [{type: "bar",barWidth: 20,itemStyle: {color: {type: "linear",x: 0,x2: 0,y: 0,y2: 1,colorStops: [{offset: 0,color: "#62A5FF" // 0% 处的颜色},{offset: 1,color: "#3365FF" // 100% 处的颜色}]}}// label: {// show: true,// position: "top"// }}]
};
export default options;
used in the project
index.view
<template><div class="home"><section class="bottom"><div class="device-statistics chart-box"><div class="title">累计设备接入统计</div><v-chartstype="bar":options="statisDeviceByUserObjectOpts"@selectchanged="selectchanged"@chart-click="handleChartClick"/></div><div class="coordinate-statistics chart-box"><div class="title">坐标数据接入统计</div><v-charts type="bar" :options="statisCoordAccess" /></div></section></div>
</template>
<script lang="ts" setup> import {useStatisDeviceByUserObject,
} from "./hooks";
// 设备分类统计
const { options: statisDeviceByUserObjectOpts,selectchanged,handleChartClick } = useStatisDeviceByUserObject(); </script>
/hooks/useStatisDeviceByUserObject.ts
export const useStatisDeviceByUserObject = () => {// 使用chartsOptions确保所有传入v-charts组件的options数据都是## shallowReactive浅层作用形式,避免大量数据导致性能问题const options = chartsOptions<BarECOption>({yAxis: {},xAxis: {},series: []});const init = async () => {const xData = [];const sData = [];const dicts = useHashMapDics<["dev_user_object"]>(["dev_user_object"]);const data = await statisDeviceByUserObject();dicts.dictionaryMap.dev_user_object.forEach(({ label, value }) => {if (value === "6") return; // 排除其他xData.push(label);const temp = data.find(({ name }) => name === value);sData.push(temp?.qty || 0);// 给options赋值时要注意options是浅层响应式options.xAxis = { data: xData }; options.series = [{ ...options.series[0], data: sData }];});};// 事件const selectchanged = (params: ChartsEvents.Events["selectchanged"]) => {console.log(params, "选中图例了");};const handleChartClick = (params: ChartsEvents.Events["chartClick"]) => {console.log(params, "点击了图表");};onMounted(() => {init();});return {options,selectchanged,handleChartClick};
};
Enter @ when using to see all events supported by the component:
At last
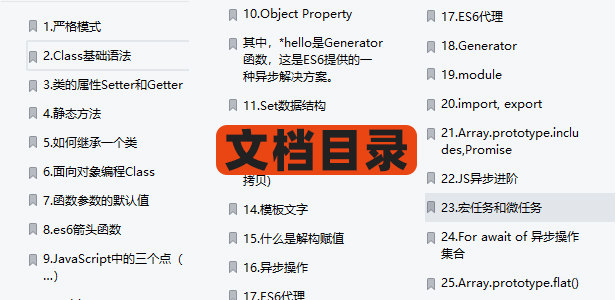
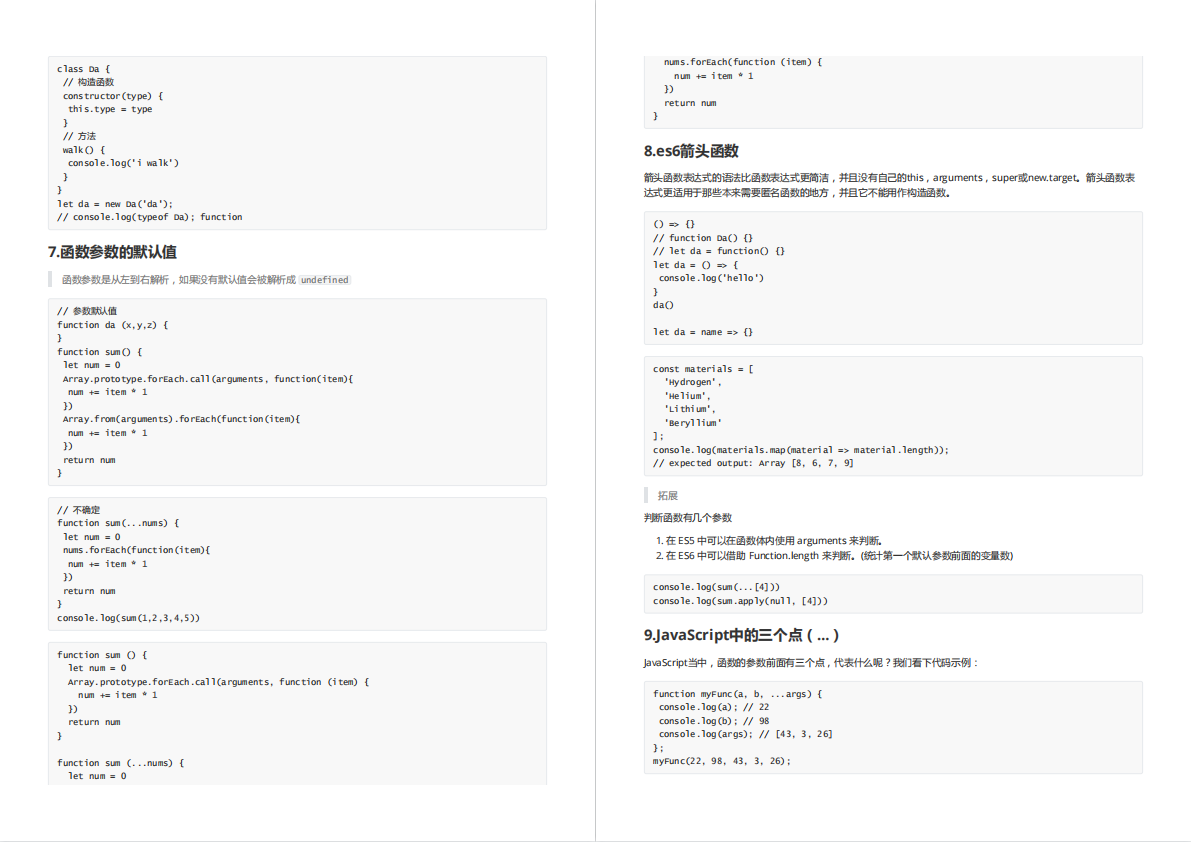
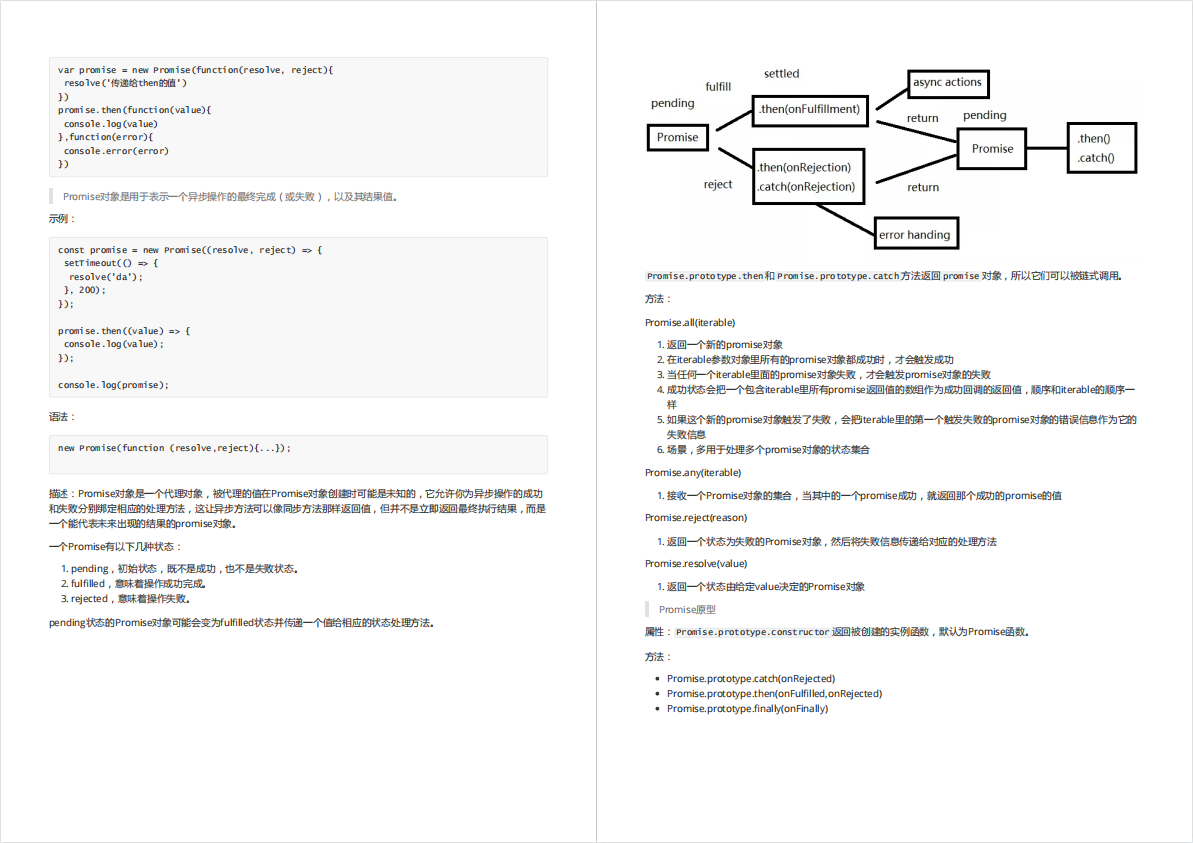
Recently, I also sorted out a JavaScript and ES note, a total of 25 important knowledge points, and explained and analyzed each knowledge point. It can help you quickly master the relevant knowledge of JavaScript and ES, and improve work efficiency.

Friends in need, you can click the card below to receive and share for free