I used tsar in the performance stress test of the previous company, but the summary document was kept in-house. It happened to use tsar again based on the recent work content. To sum up
Table of contents
- foreword
- tsar
-
- introduce
- Overall architecture
- install tasr
- Introduction to tsar configuration
- tsar use
- tsar actual use reference
- tsar common commands
-
- Display the historical summary (summury) information within 1 day, with the default interval of 5 minutes
- View real-time data of all monitoring items
- View all monitoring items, historical or real-time data, each 1 second as a collection display
- View historical or real-time data of all monitoring items, each time 1 second as a collection display
- Find out the real-time data of the specified monitoring item, and use it as a collection display for 1 second each time
- Find out the real-time data of the specified monitoring item, and use it as a collection display for 5 seconds each time
- Retrospective Data to Historical Dates
- refer to
foreword
To do performance verification, it is often necessary to monitor various performance indicators of the system. There are many Linux system monitoring tools, but for command line operations, easy installation, and more comprehensive monitoring items, I personally recommend tsar
tsar
introduce
TSAR (Taobao System Activity Reporter) is a collection tool developed by Taobao itself.
It is mainly used to collect server system information (such as cpu, io, mem, tcp, etc.), and application data (such as squid haproxy nginx, etc.). The collected data is stored on the disk, and the historical information can be queried at any time, and the output methods are flexible and diverse. In addition, it supports storing the data in mysql, and can also send the data to the nagios alarm server. When displaying data, Tsar can specify a module, and can merge and output the data of multiple pieces of information. With the –live parameter, it can output real-time information at the second level. Tsar can add modules more conveniently. You only need to write data collection functions and display functions according to the requirements of tsar, and you can add custom modules to Tsar.
Overall architecture
Tsar is a program based on modular design, and the program consists of two parts: framework and modules.
- The framework program source code is mainly in the src directory, while the module source code is mainly in the modules directory.
- The framework provides parsing of configuration files, loading of modules, parsing of command line parameters, and parsing and outputting of raw data of modules through interfaces of application modules. The module provides an interface for the framework to call.
- Tsar relies on cron to collect data every minute, so it requires the system to install and enable crond. After installation, tsar will execute tsar --cron every minute to regularly collect information and record it to the original log file.
install tasr
There are two ways to install
- clone code
git clone git://github.com/alibaba/tsar.git
cd tsar
make
make install
- Download the source code - I used this method
#依次执行以下命令即可
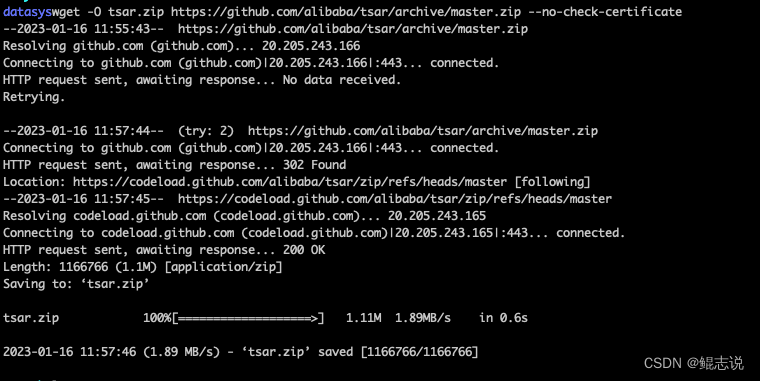
1.wget -O tsar.zip https://github.com/alibaba/tsar/archive/master.zip --no-check-certificate
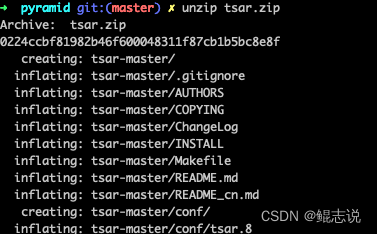
2.unzip tsar.zip
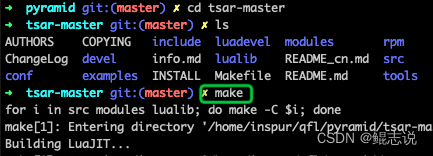
3.cd tsar-master
4.make
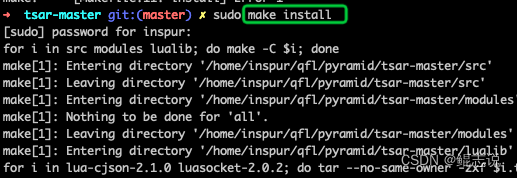
5.make install
Execute the command :
wget -O tsar.zip https://github.com/alibaba/tsar/archive/master.zip --no-check-certificate
Unzip : unzip tsar.zip
Execution command:
cd tsar-master
make
Execution command : make install
Introduction to tsar configuration
After installing tsar, the following files will be generated
Tsar configuration file path: /etc/tsar/tsar.conf, specific configuration of tsar’s acquisition module and output;
timing task configuration: /etc/cron.d/tsar, responsible for calling tsar to perform acquisition tasks every minute;
log file rotation configuration :/etc/logrotate.d/tsar, the local storage of tsar will be rotated every month;
module path: /usr/local/tsar/modules, the dynamic library so file of each module;
configuration file
Responsible for the specific configuration of the acquisition module and output of tsar; configure which modules to enable, output, etc. here.
cd /etc/tsar/tsar.conf
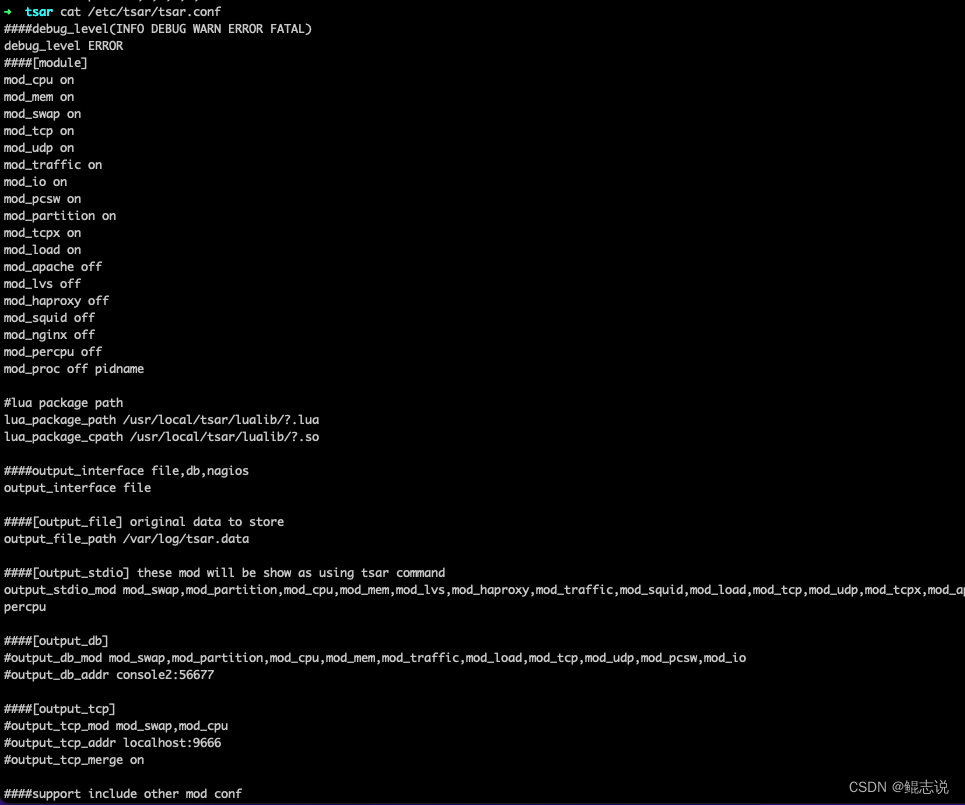
Description of Common Parameters
The following parameters can be combined to view the /etc/tsar/tsar.conf file correspondingly
- debug_level specifies the running level of tsar, mainly used for debugging
- mod_xxx on/off Turn on the specified module
- out_interface set the output type, support file, nagios, db
- out_stdio_mod Set the module displayed by default in the user terminal
- output_db_mod sets which modules output to the database
- The ip and port of the output_db_addr database
- output_nagios_mod sets which modules are output to nagios
- include supports include configuration, mainly used to load user-defined modules
- cycle_time specifies the interval for reporting. Since tsar collects once every minute, it will judge whether it meets the time interval when reporting. If it is set to 300, it will report to nagios at 0, 5, etc. on the hour
- threshold Set the threshold of an item to be alarmed, the front is the module and the specific name to be monitored, and the following four data represent the range of the alarm, the range of warn and critical
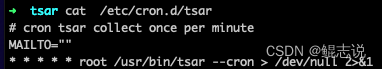
Timing task configuration
Invoke the tsar command every minute as the root user to perform data collection.
cat /etc/cron.d/tsar
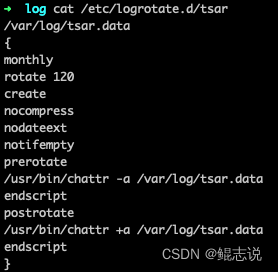
log file
The local storage of tsar will be rotated every month, and the data is also set here under /var/log/tsar.data
cd /etc/logrotate.d/tsar
tsar use
In the use of Tsar, the following is the help information that can be referred to, but the actual use may not involve so much, you can directly refer to the next actual use
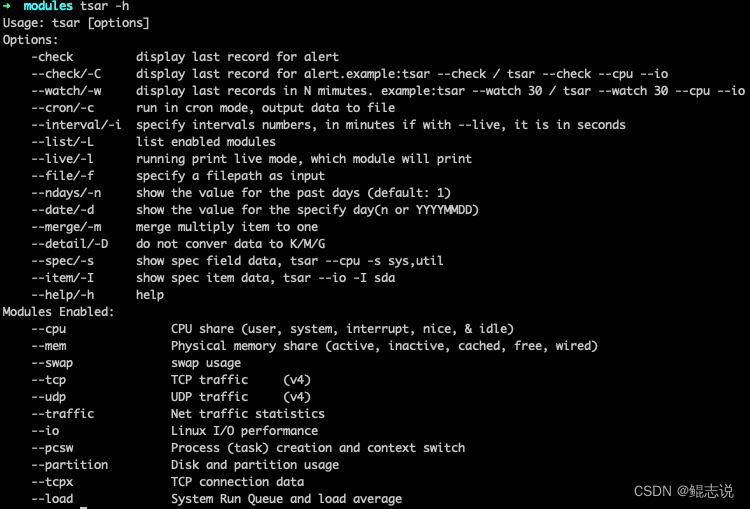
Usage: tsar [options]
Options:
    -check         查看最后一次的采集数据
    --check/-C     查看最后一次tsar的提醒信息,如:tsar --check / tsar --check --cpu --io
    --watch/-w     显示最后多少分钟的记录. 如:tsar --watch 30 / tsar --watch 30 --cpu --io
    --cron/-c      使用crond模式来进行tsar监控
    --interval/-i  指明tsar的间隔时间,默认单位分钟,默认显示间隔5分钟;带上--live参数则单位是秒,默认是5秒。
    --list/-L      列出启用的模块
    --live/-l      启用实时模式,类似iostat等,可以配合-i参数和模块参数使用。
    --file/-f      指定输入文件
    --ndays/-n     控制显示多长时间的历史数据,默认1天
    --date/-d      指定日期,YYYYMMDD或者n代表n天前
    --merge/-m     对有多个数据的展示,进行汇总,如机器上跑了3个squid,可以用 tsar –squid -m的放式进行展示汇总。
    --detail/-D    能够指定查看主要字段还是模块的所有字段
    --spec/-s      指定字段,tsar –cpu -s sys,util
    --item/-I      显示指定项目数据, 如:tsar --io -I sda
    -–help/-h      显示提示信息和模块信息
Modules Enabled:
    --cpu          列出cpu相关的监控计数
    --mem          物理内存的使用情况
    --swap         虚拟内存的使用情况
    --tcp          TCP协议IPV4的使用情况
    --udp          UDP协议IPV4的使用情况
    --traffic      网络传出的使用情况
    --io           Linux IO的情况
    --pcsw         进程和上下文切换
    --partition    磁盘使用情况
    --tcpx         TCP连接相关的数据参数
    --load         系统负载情况
tsar actual use reference
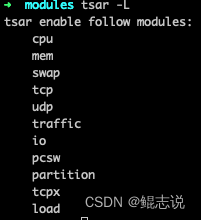
View a list of available monitoring modules
tsar -L
Adjustable in configuration file: /etc/tsar/tsar.conf
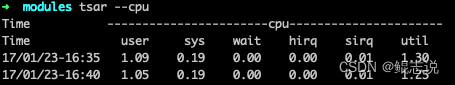
Check the CPU status
tsar --cpu
user indicates the cpu usage in user space
sys indicates the cpu usage in kernel space
wait indicates the cpu usage corresponding to IO
hirq, sirq are the hardware interrupt and software interrupt usage
util is the total cpu usage of the system
And so on: You
can check the specific conditions of one or several items below
cpu
mem
swap
tcp
udp
traffic
io
pcsw
partition
tcpx
load
tsar common commands
Display the historical summary (summury) information within 1 day, with the default interval of 5 minutes
tsar
View real-time data of all monitoring items
tsar -l
View all monitoring items, historical or real-time data, each 1 second as a collection display
tsar -d 1 --cpu --load --mem -i 1

#-d 1: 查看一天前的数据;去掉-d 1则表示查询截止目前24小时内的数据
#-i 1 : 表示以每次1分钟作为采集显示;
View historical or real-time data of all monitoring items, each time 1 second as a collection display
tsar -i 1 -l
#-l: 实时数据;不加-l就是所有历史数据了
Find out the real-time data of the specified monitoring item, and use it as a collection display for 1 second each time
tsar --cpu --load --mem -i 1 -l
Find out the real-time data of the specified monitoring item, and use it as a collection display for 5 seconds each time
tsar --cpu --load --mem -l 5
Retrospective Data to Historical Dates
tsar --load --cpu -d "20230111" -f /var/log/tsar.data
或
tsar --load --cpu -d "20230111"
#-d : 指定历史日期;
#-f : 指定tsar的数据文件;
refer to
GitHub project address : alibaba/tsar
tsar installation and use : tsar installation and use
Linux system performance monitoring tool introduction-tsar : Linux system performance monitoring tool introduction-tsar
linux system performance monitoring tool—tsa : linux system performance monitoring tool—tsa