Source: https://www.cnblogs.com/chiangchou
Debug is used to track the running process of the code. Usually, an exception occurs during the running of the program. Enabling the Debug mode can analyze and locate the location of the exception and the change of parameters during the running process. Usually we can also enable Debug mode to track the running process of the code to learn the source code of the tripartite framework.
So learn how to use Debug in Intellij IDEA, including the following:
- Debug opening
- Basic Usage & Shortcuts
- variable view
- Evaluate expression
- smart step
- Breakpoint condition setting
- Multithreaded debugging
- fallback breakpoint
- Interrupt Debug
- Attachment: JRebel activation
1. The beginning of Debug
First look at the interface in Debug mode in IDEA.
To obtain a genuine activation code for free, please read this: https://www.javastack.cn/intellij-idea-reactivation-succeed/ .
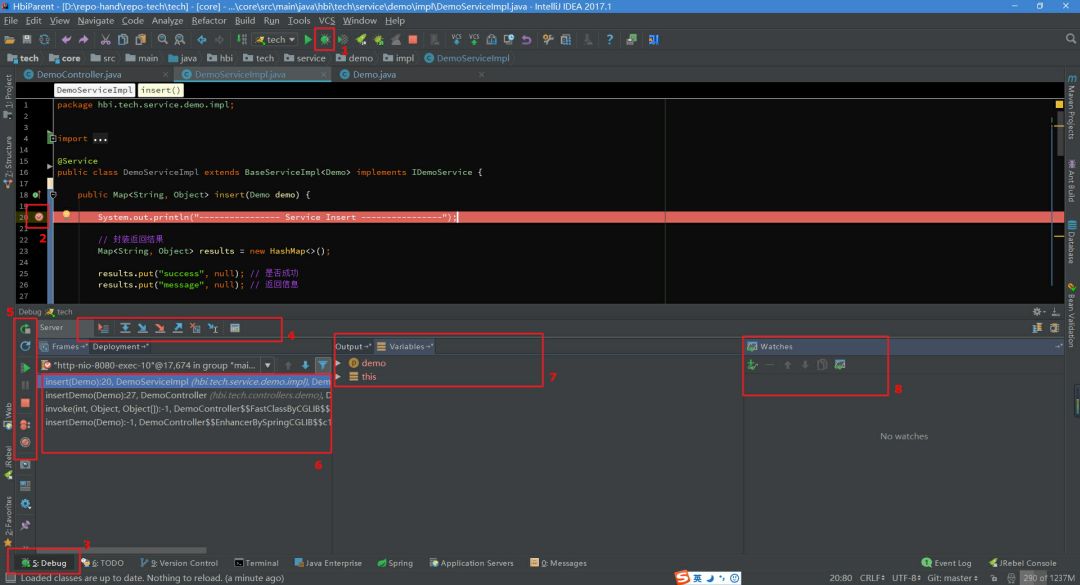
The following is the interface after starting the Debug mode in IDEA and entering the breakpoint. I am here on Windows, which may be slightly different from the Mac icon. Let’s briefly talk about the 8 places marked in the following figure:
- Start the service in Debug mode, and a button on the left starts it in Run mode. In development, I usually start the Debug mode directly, which is convenient for debugging the code at any time.
- Breakpoint: Click the left button in the left line number column, or use the shortcut key Ctrl+F8 to set/cancel the breakpoint. The color of the breakpoint line can be set by yourself.
- Debug window: After the access request reaches the first breakpoint, the Debug window is automatically activated. If it is not automatically activated, you can go to the settings to set it, as shown in Figure 1.2.
- Debug button: There are 8 buttons in total. The main functions of debugging correspond to these buttons. Hover the mouse over the buttons to view the corresponding shortcut keys. The same corresponding functions can be found in the menu bar Run, as shown in Figure 1.4.
- Service button: Here you can close/start services, set breakpoints, etc.
- Method call stack: This shows all the methods that the thread has debugged through. If you check the [Show All Frames] button in the upper right corner, the methods of other class libraries will not be displayed, otherwise there will be a lot of methods.
- Variables: In the variable area, you can view the variables in the current method before the current breakpoint.
- Watches: To view variables, you can drag the variables in the Variables area to Watches to view
 [Figure 1.1]
Check Show debug window on breakpoint in the settings, then the Debug window will be automatically activated after the request enters the breakpoint
 [Figure 1.2]
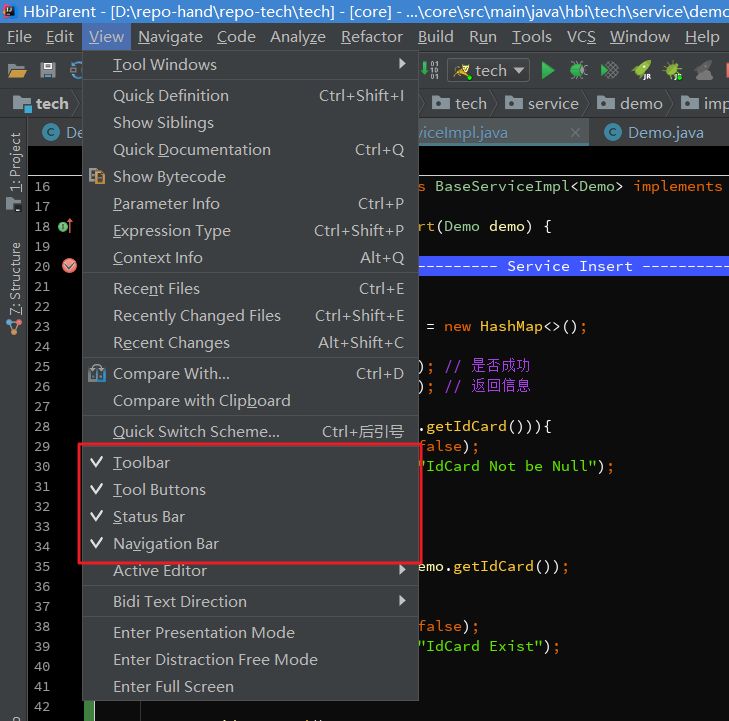
If there is no toolbar or status bar displayed at the bottom of your IDEA, you can open it in View, and displaying the toolbar will be convenient for us to use. You can try these four options yourself.
 [Figure 1.3]
In the menu bar Run, there are corresponding functions for debugging, and you can view the corresponding shortcut keys at the same time.
 [Figure 1.4]
2. Basic usage & shortcut keys
The debugging function of Debug mainly corresponds to the two groups of buttons 4 and 5 in Figure 1:
1. First of all, let’s talk about the first group of buttons, a total of 8 buttons, from left to right are as follows:
 [Figure 2.1]
Show Execution Point (Alt + F10): If your cursor is on another line or other page, click this button to jump to the current line of code execution.Step Over (F8): Step over, go down line by line, if there is a method on this line, it will not enter the method.Step Into (F7): Step in, if there is a method in the current line, you can enter the method, which is generally used to enter the custom method, and will not enter the method of the official class library, such as the put method in line 25.Force Step Into (Alt + Shift + F7): Force entry, can enter any method, you can use this method to enter the official class library when viewing the underlying source code.Step Out (Shift + F8): Step out, exit from the step-in method to the method invocation place. At this time, the method has been executed, but the assignment has not yet been completed.Drop Frame (默认无): Rollback breakpoints, detailed in the following chapters.Run to Cursor (Alt + F9): run to the cursor, you can position the cursor to the line you need to view, and then use this function, the code will run to the cursor line without breaking the point.Evaluate Expression (Alt + F8): Calculate the expression, which will be explained in detail in the following chapters.
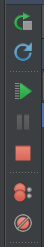
2. The second group of buttons, a total of 7 buttons, are as follows from top to bottom:
 [Figure 2.2]
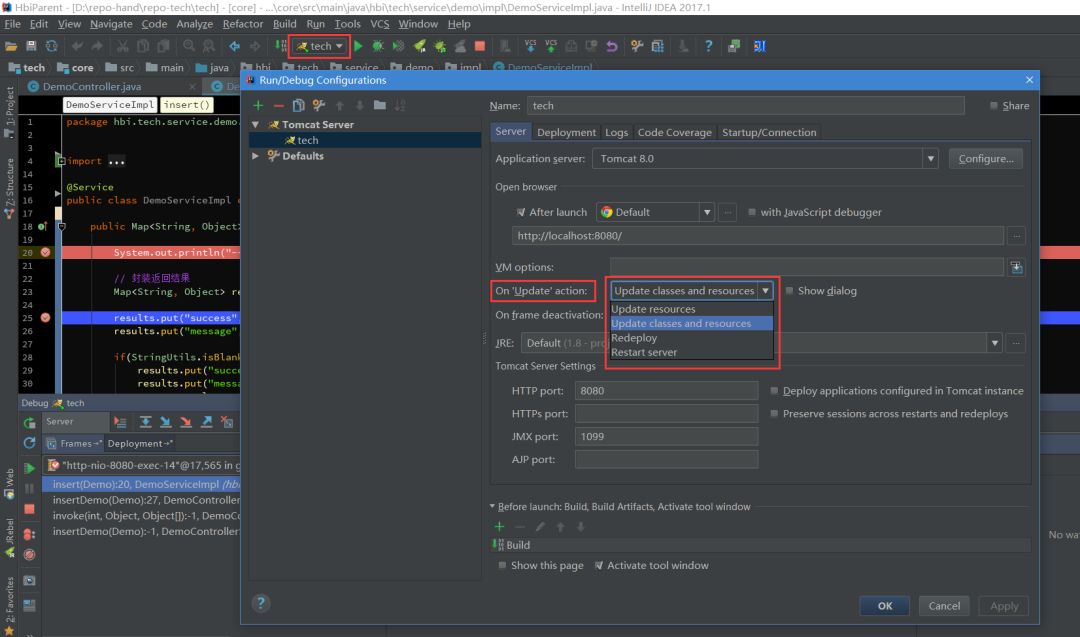
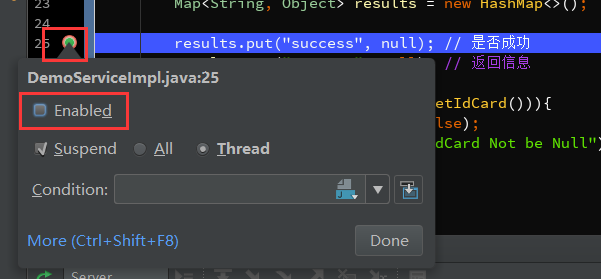
Rerun 'xxxx': Re-run the program, it will shut down the service and restart the program.Update 'tech' application (Ctrl + F5): Update the program. Generally, this function can be executed after your code has been changed. The operation corresponding to this function is in the service configuration, as shown in Figure 2.3.Resume Program (F9): Resume the program, for example, if you have two breakpoints on lines 20 and 25, and currently run to line 20, press F9 to run to the next breakpoint (ie, line 25), and then press F9 to run The whole process, because there are no breakpoints later.Pause Program: Pause the program and enable Debug. No specific usage has been found so far.Stop 'xxx' (Ctrl + F2): Press twice to close the program. Sometimes you will find that the port is occupied when the service is closed and restarted. This is because the service is not completely closed, so you need to kill all JVM processes.View Breakpoints (Ctrl + Shift + F8): View all breakpoints, which will be covered in later chapters.Mute Breakpoints: Dumb breakpoint. After selecting this, all breakpoints will be grayed out, and the breakpoint will be invalid. Press F9 to run the program directly. Click again, the breakpoint turns red, and it works. If you only want to make a certain breakpoint invalid, you can right-click on the breakpoint to cancel Enabled, as shown in Figure 2.4, the breakpoint of this line will be invalid.
Updater, On 'Update' actions, what to do when the update operation is performed, generally select 'Update classes and resources', that is, update classes and resource files.
It is generally better to use with hot deployment plugins, such as JRebel, so that you don't have to restart the service every time you change the code. How to activate JRebel, attached in the last chapter.
The following On frame deactivation is triggered when the IDEA window loses focus, that is, when you switch from idea to browser, idea will automatically do things for you. Generally, you can set Do nothing, and frequent switching will consume more resources.
 [Figure 2.3]
 [Figure 2.4]
Third, the variable view
In the Debug process, it is very necessary to track and view the changes of variables. Here are a few places where you can view variables in IDEA. I believe most people know it.
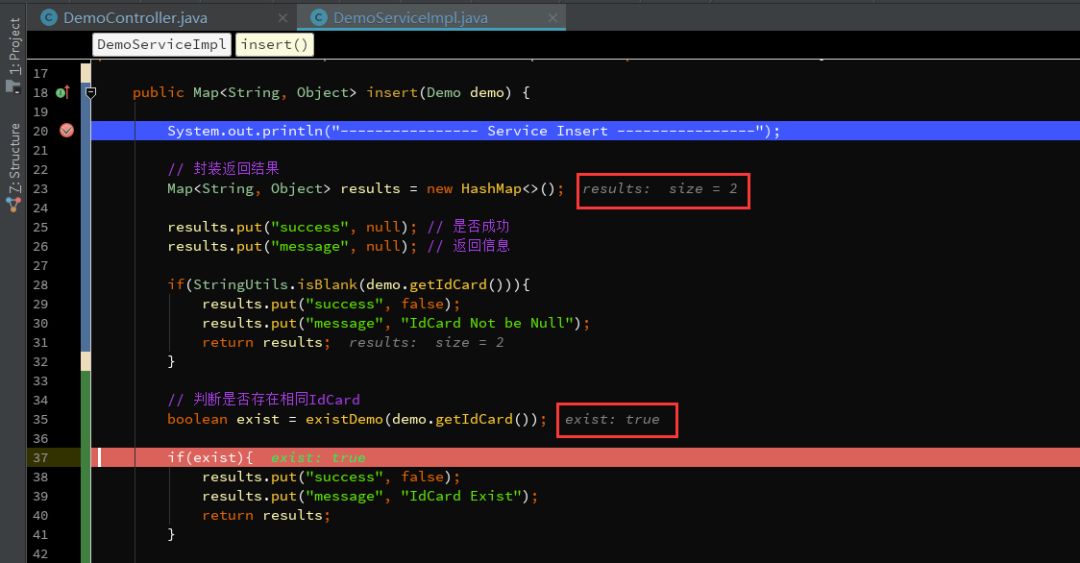
1. As follows, in IDEA, the value of the current variable will be displayed after the line where the parameter is located.
 [Figure 3.1]
2. Hover the cursor over the parameter to display the current variable information. Click to open the details as shown in Figure 3.3. I usually use this method, which is quick and convenient.
 [Figure 3.2]
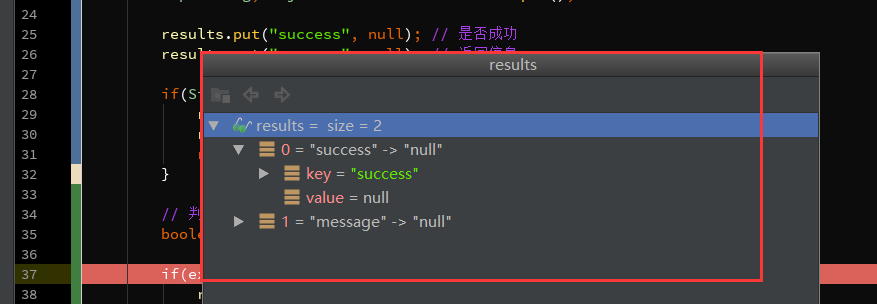 [Figure 3.3]
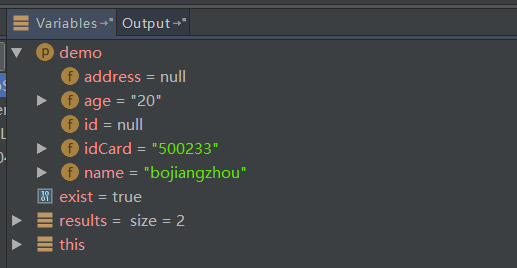
3. View in Variables, all variables in the current method are displayed here.
 [Figure 3.4]
4. In Watches, click New Watch and enter the variable to be viewed. Or you can drag it from Variables to Watche to view.
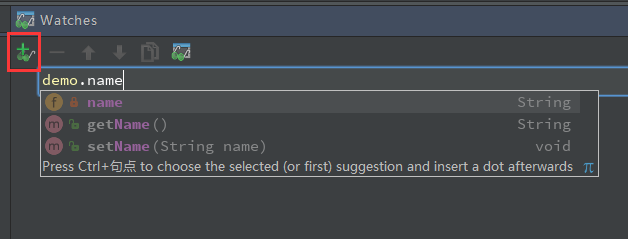 [Figure 3.5]
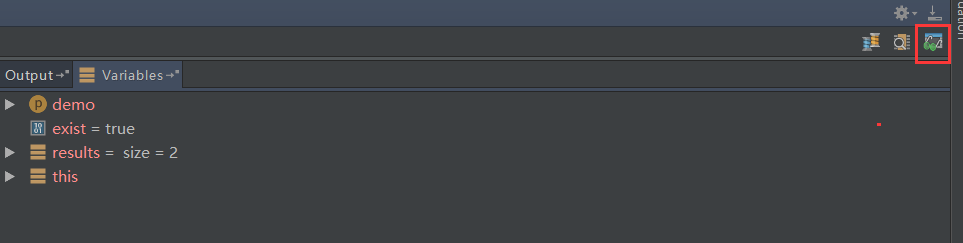
If you find you don't have Watches, it's probably where the picture below is.
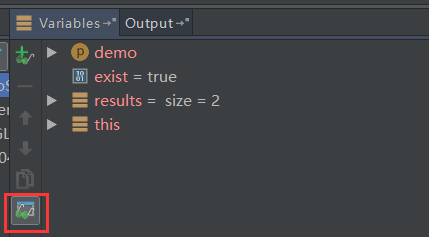 [Figure 3.6]
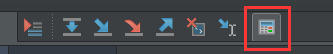
 [Figure 3.7]
Fourth, the calculation expression
The previously mentioned calculation expression is shown in Figure 4.1 as the button, Evaluate Expression (Alt + F8). You can use this operation to evaluate an expression during debugging without printing information.
 [Figure 4.1]
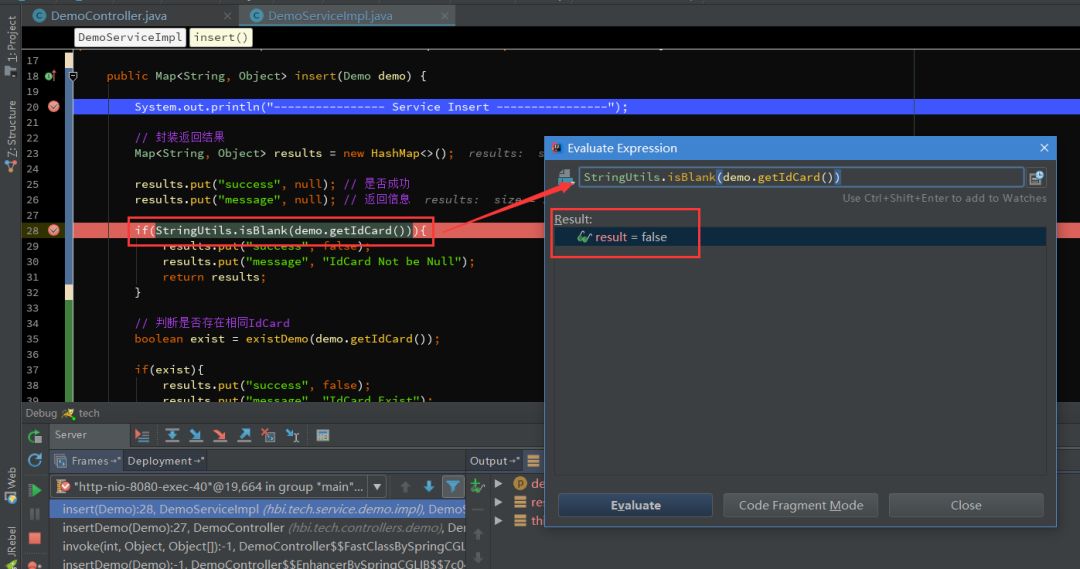
1. Press Alt + F8 or the button, or you can select an expression and then Alt + F8 to pop up the window for calculating the expression , as follows, press Enter or click Evaluate to calculate the value of the expression.
This expression can be not only a general variable or parameter, but also a method. When you call several methods in one line of code, you can view the return value of a method in this way.
 [Figure 4.2]
2. Set the variable. In the box of the calculation expression, you can change the value of the variable , so sometimes it is very convenient for us to debug the situation of various values, right?
 [Figure 4.3]
Five, intelligent step
Think about it, there are several methods in a line of code, how to choose only one method to enter. As mentioned earlier, using Step Into (Alt + F7) or Force Step Into (Alt + Shift + F7) to enter the method, but these two operations will be entered in sequence according to the method invocation sequence, which is more troublesome.
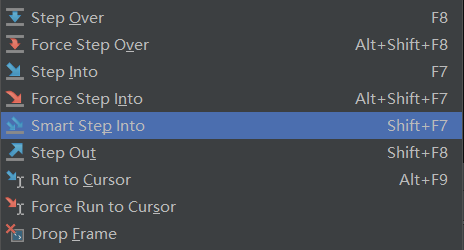
Then Smart Step Into is very convenient, Smart Step In, this function can be seen in Run, Smart Step Into (Shift + F7), as shown in Figure 5.1
 [Figure 5.1]
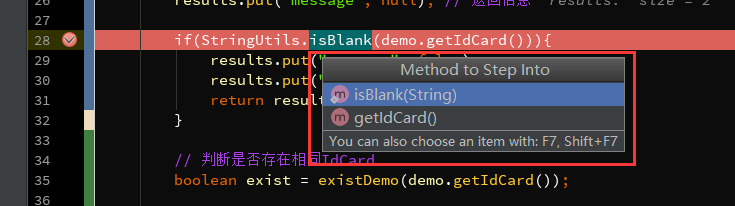
Press Shift + F7, it will automatically locate the current breakpoint line, and list the methods to be entered, as shown in Figure 5.2, click the method to enter the method.
If there is only one method, enter directly, similar to Force Step Into.
 [Figure 5.2]
6. Breakpoint condition setting
By setting the breakpoint condition, when the condition is met, it stops at the breakpoint, otherwise it runs directly.
Usually, when we traverse a relatively large collection or array and set a breakpoint in the loop, do we want to see the values of the variables one by one? It must be very tiring, maybe you missed this and it is worth doing it all over again.
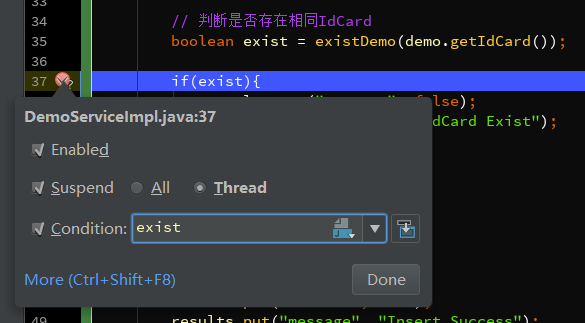
1. Right-click on the breakpoint to directly set the condition of the current breakpoint, as shown in Figure 6.1, the breakpoint takes effect only when I set exist to true.
 [Figure 6.1]
2. Click View Breakpoints (Ctrl + Shift + F8) to view all breakpoints.
Java Line Breakpoints shows all the breakpoints. Check Condition on the right to set the condition of the breakpoint.
Checking Log message to console will output the current breakpoint line to the console, as shown in Figure 6.3
Check Evaluate and log, you can execute this line of code to calculate the value of the expression and output the result to the console.
 [Figure 6.2]
 [Figure 6.3]
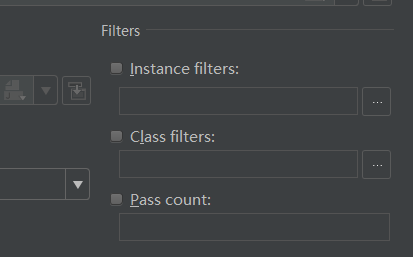
3. Let's talk about the Filters filtering on the right . These are not commonly used in general, so let's briefly explain the meaning.
Instance filters: Instance filtering, enter the instance ID (the instance ID in Figure 6.5), but I didn't succeed here, I don't know the reason, and friends who know leave a message.
Class filters: Class filtering, filtering by class name, also failed....
Pass count: used in the loop. If the breakpoint is in the loop, you can set this value. After the loop stops at the breakpoint, the subsequent loops will stop at the breakpoint.
 [Figure 6.4]
 [Figure 6.5]
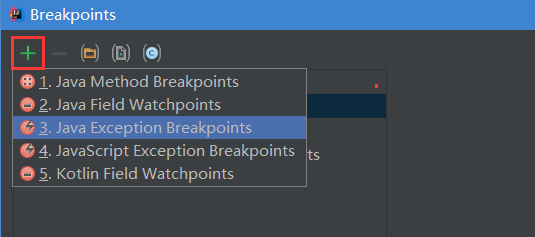
4. Exception breakpoints, by setting exception breakpoints , when there is an exception that needs to be intercepted in the program, the exception line will be automatically located.
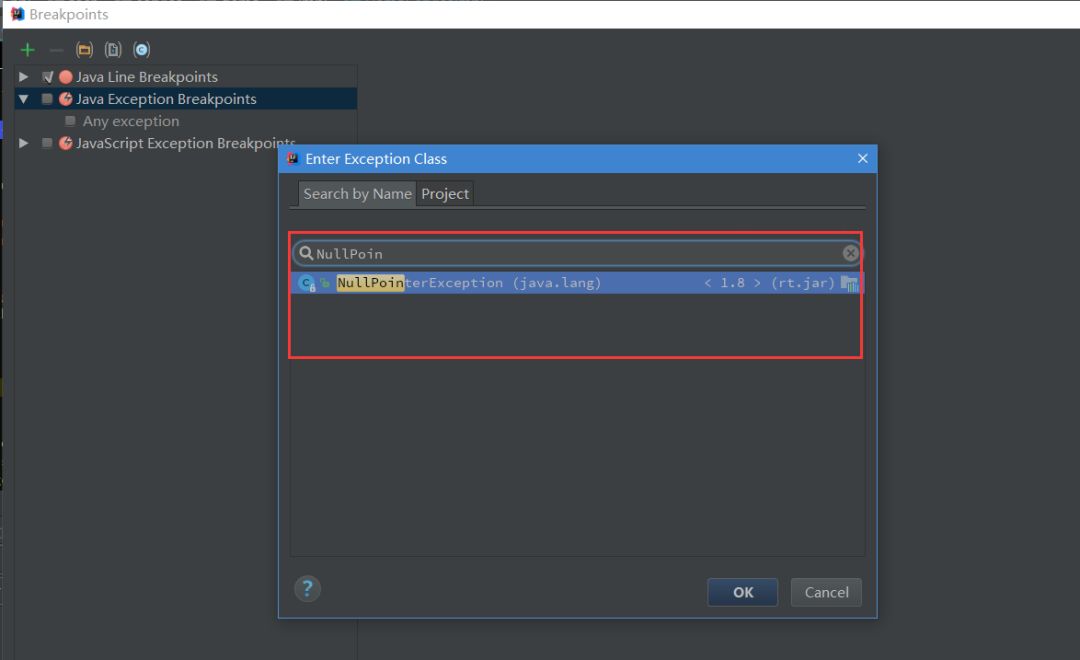
As shown in Figure 6.6, click the + sign to add Java Exception Breakpoints to add an exception breakpoint. Then enter the exception class that needs a breakpoint, as shown in Figure 6.7, and then you can see the added exception breakpoint in Java Exception Breakpoints.
I added a NullPointerException exception breakpoint here, as shown in Figure 6.8. After a null pointer exception occurs, it is automatically located at the null pointer exception line.
 [Figure 6.6]
 [Figure 6.7]
 [Figure 6.8]
Seven, multi-threaded debugging
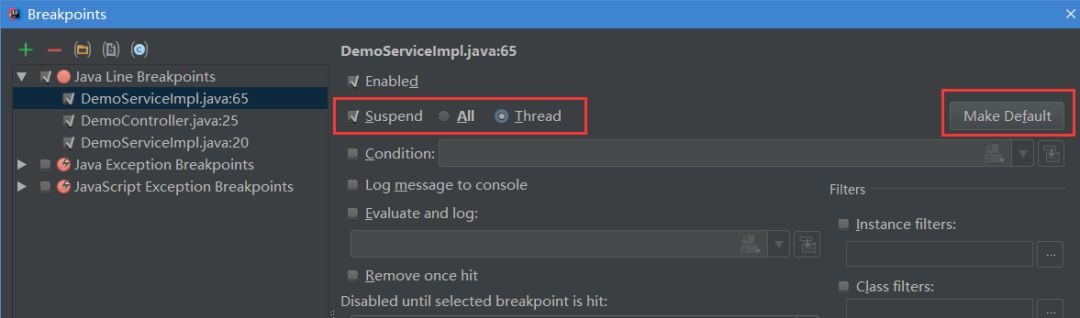
Under normal circumstances, when we debug, we are in a thread and go down step by step. But sometimes you will find that you can't make another request when you are debugging?
That's because IDEA's default blocking level is ALL during Debug, which will block other threads, and will only run other threads when the current debugging thread is finished. You can select Thread in View Breakpoints, as shown in Figure 7.1, and then click Make Default to set it as the default option.
 [Figure 7.1]
To switch threads, in the drop-down list of Frames in Figure 7.2, you can switch the current thread. As follows, I have two Debug threads here, and switching the other one will enter another Debug thread.
 [Figure 7.2]
Eight, fallback breakpoint
When debugging, want to go through the process again without making a request again?
1. First get to know the call stack of this method , as shown in Figure 8.1, first request to enter the insertDemo method of DemoController, and then call the insert method. We will ignore the other invokes. The top method is the method where the current breakpoint is located.
 [Figure 8.1]
2. Breakpoint rollback
The so-called breakpoint rollback is actually going back to the beginning of the previous method call. In IDEA, the test cannot roll back line by line or go back to the previous breakpoint, but go back to the previous method.
There are two ways to roll back, one is the Drop Frame button (Figure 8.2), which rolls back step by step according to the method called, including other methods of the tripartite class library (cancelling the Show All Frames button will display the method of the tripartite class library, as shown in the figure 8.3).
The second method is to select the method to be rolled back on the call stack method, right-click to select Drop Frame (Figure 8.4), and roll back to the previous method call of the method. At this time, press F9 (Resume Program) again, you can see The program enters the breakpoint of the method.
But there is one thing to note, breakpoint rollback can only go through the process again. If the state of some previous parameters/data has changed, it cannot be rolled back to the previous state, such as objects, collections, updated database data, etc. Wait.
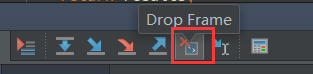 Figure [8.2]
 Figure [8.3]
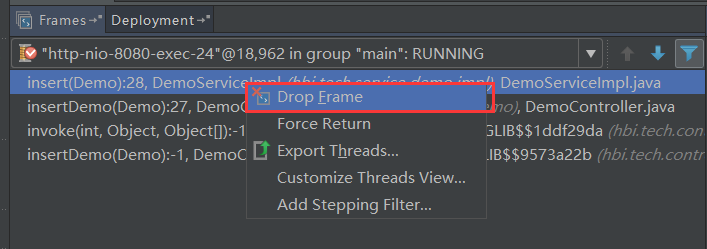 Figure [8.4]
9. Interrupt Debug
Do you want to interrupt the request during Debug, and don't go through the rest of the process?
Sometimes, after we see that the incoming parameters are wrong, we don't want to go to the next process. How can we interrupt this request (the latter process needs to delete the database data....), do we need to close the service and restart the program? Well, I used to do that too.
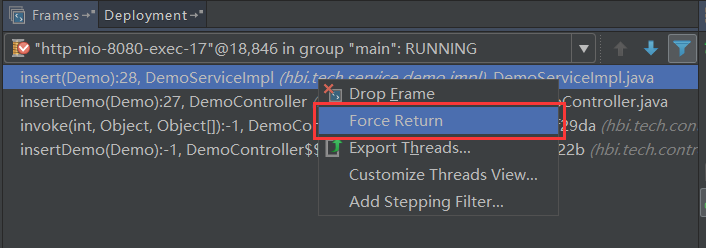
To be precise, I have not found a way to directly interrupt the request (except for closing the service), but you can avoid the subsequent process through Force Return, that is, forced return, as shown in Figure 9.1.
Click Force Return, and the Return Value window will pop up. The return type of my method is Map, so I directly return results here to force the return, so that the subsequent process will not be carried out. Or you can new HashMap<>().
 [Figure 9.1]
 [Figure 9.2]
10. Attachment: JRebel Activation
At present, I have been using JRebel as a hot deployment tool, and the effect is quite satisfactory. Modifying Java code or xml and other configuration files can be hot updated. Occasionally the service has been running for a long time, or when there are many changed files, the hot update does not take effect and the service needs to be restarted.
Here is just a brief description of a way I saw on the Internet to obtain permanent use rights for free (non-cracking), and I am not sure when this method cannot be used.
- First you need a Twitter account
- Enter this URL: https://my.jrebel.com/, and log in, as shown in Figure 10.1
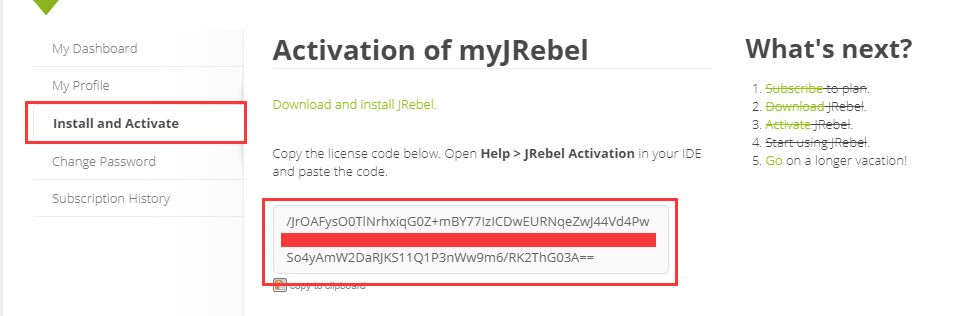
- Then you can get your permanent activation code in Install and Acticate.
- Set the activation code in Jrebel in the settings, as shown in Figure 10.3. If the JRebel plug-in is not installed, first install the search and install the JRebel plug-in in Plugins.
 [Figure 10.1]
 [Figure 10.2]
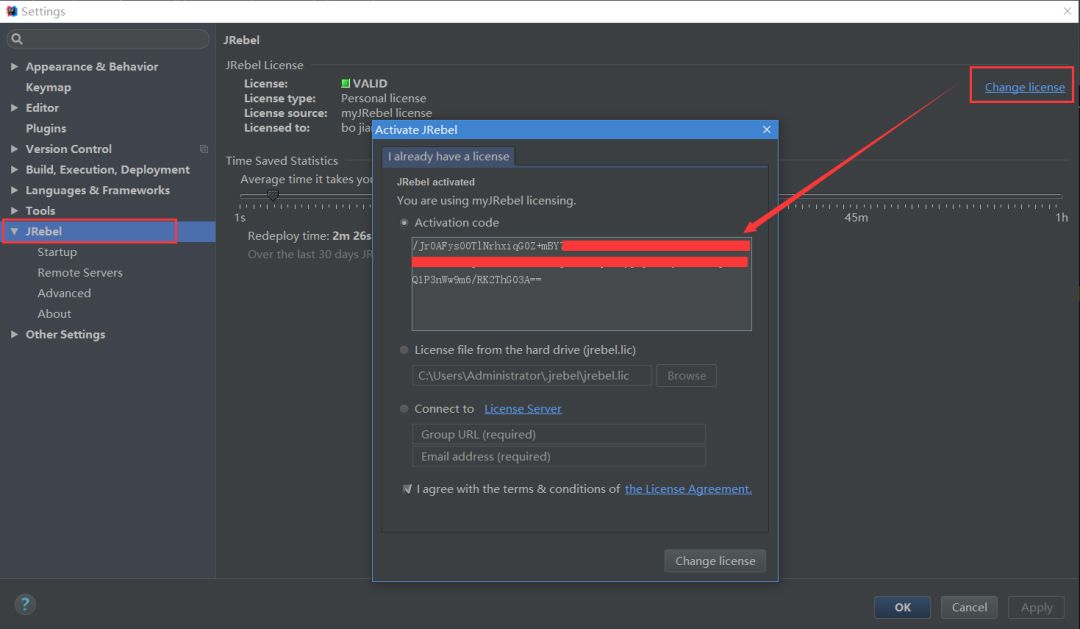 [Figure 10.3]
If there is anything wrong or a better way, please leave a message!
Recommended recent hot articles:
1. 1,000+ Java interview questions and answers (2022 latest version)
2. Madden! Java coroutines are coming. . .
3. Spring Boot 2.x tutorial, so complete!
4. Don't write the full screen explosion class, try the decorator mode, this is the elegant way! !
5. "Java Development Manual (Songshan Edition)" is the latest release, download it quickly!
If you think it's good, don't forget to like + retweet!