foreword
Performance optimization is an essential skill for database operation and maintenance personnel and intermediate and advanced software developers. In many cases, the difference between old drivers and new drivers is whether the things they write are optimized.
The blogger has contacted the systems of nearly a thousand customers, and these systems have various performance problems. So how to thoroughly understand our database performance problems? Today, I will use a case to illustrate the little thing about performance optimization.
PS: Many technicians have their own understanding of optimization, please put down your own understanding before reading this article.
As the saying goes: follow the blogger not to get lost, the blogger will take you to the high speed!
Click on the case and follow the blogger's ideas to see how to optimize these things: Demo of this article

Understand the system environment
To optimize, we must first know what kind of hardware/software environment the database is running in? What is the configuration like? Can memory and CPU be fully utilized? How big is the database?
First, let's take a look at the system configuration:
At the software level, we need to know our operating system version, SQL Server version, and hardware limitations of the corresponding version (for example, 32-bit systems cannot use more than 4G memory without AWE, and the server 2008 standard version supports up to 32G memory, etc.)
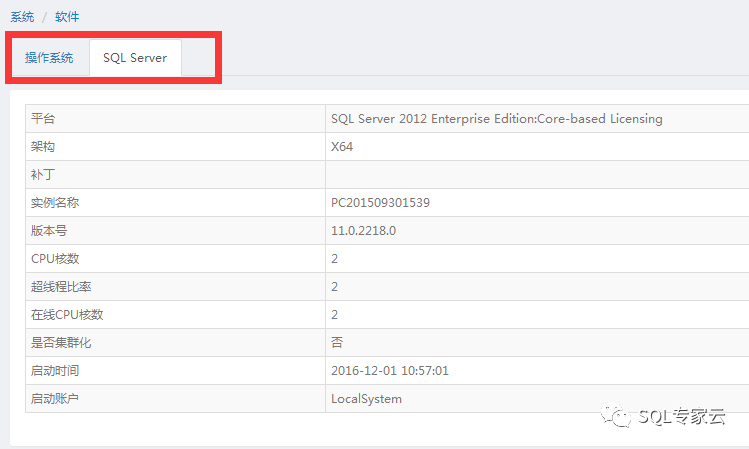
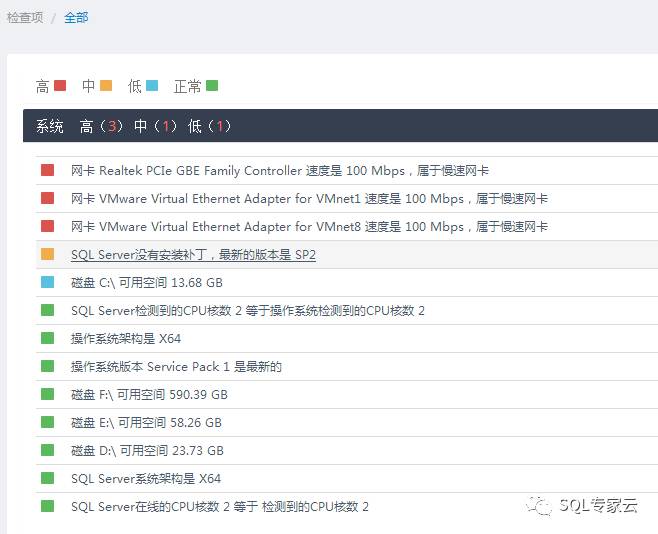
In this example, we can see that there is no abnormal problem in the system environment, the patch of SQL Server is not the latest, and the CPU resources are not sufficient, and the CPU may become the bottleneck of the system.
Looking at performance at a global level
Looking at the problem at the global level mainly refers to the bottleneck or problem of the integrated server's various indicators to locate the system. In performance optimization, the most taboo is to start immediately after seeing an indicator . The judgment of an indicator is blind, and it is likely to deviate from the problem. The root cause itself may also make optimization unable to solve the root problem at all but only alleviate the appearance.
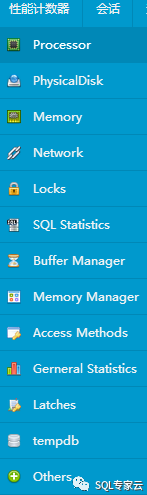
performance counters
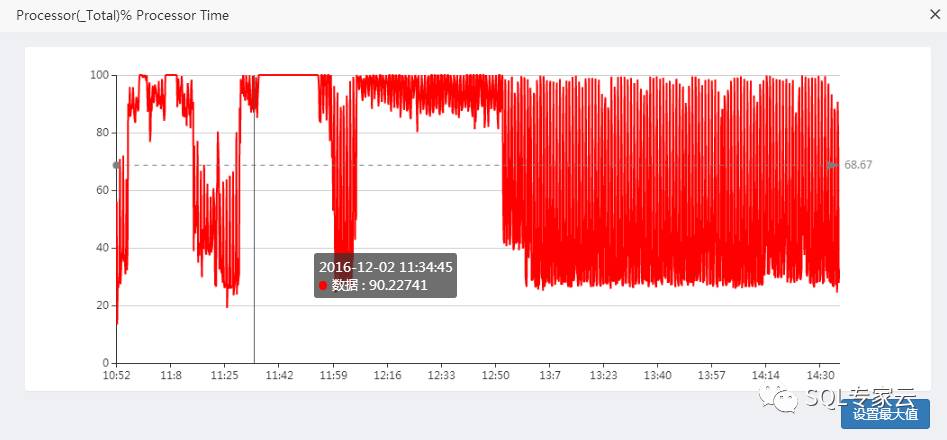
CPU: The CPU usage reaches 100% for a large amount of time, indicating that the CPU has become the bottleneck.
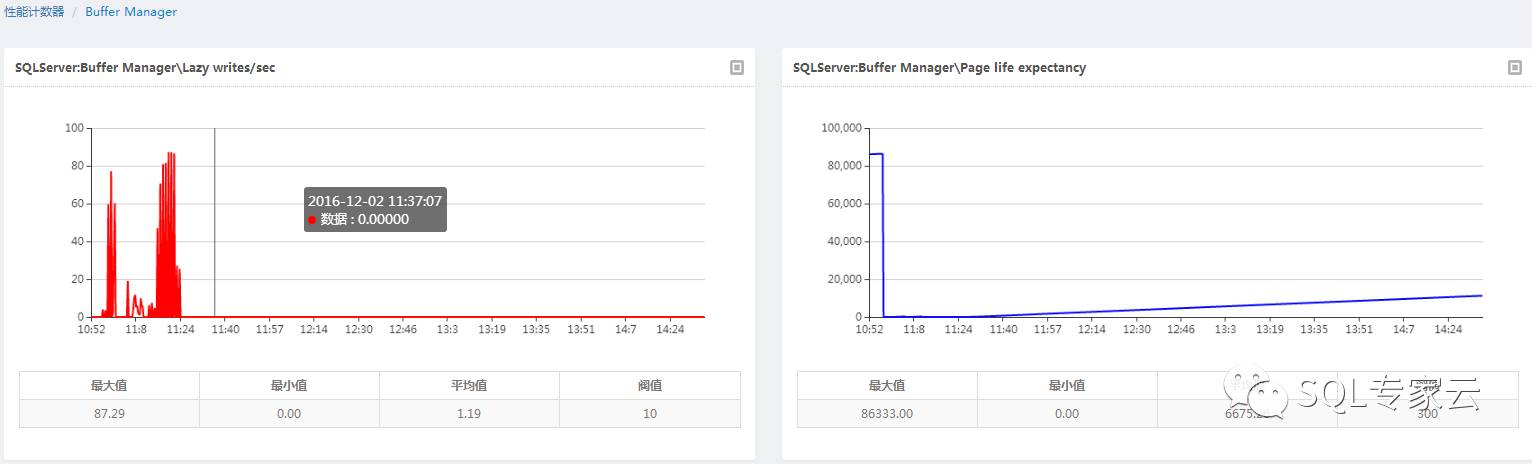
Memory: The life cycle of the memory counter has dropped to 0 at 11 o'clock, and the lazy writer is also high, indicating that the memory is also under pressure, and it is serious.
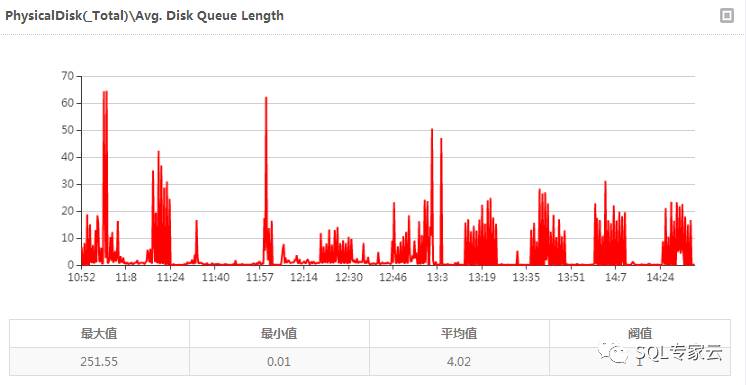
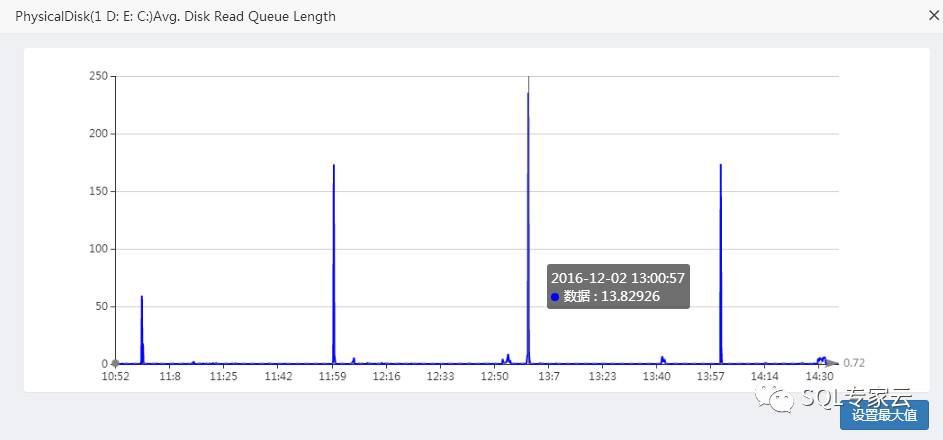
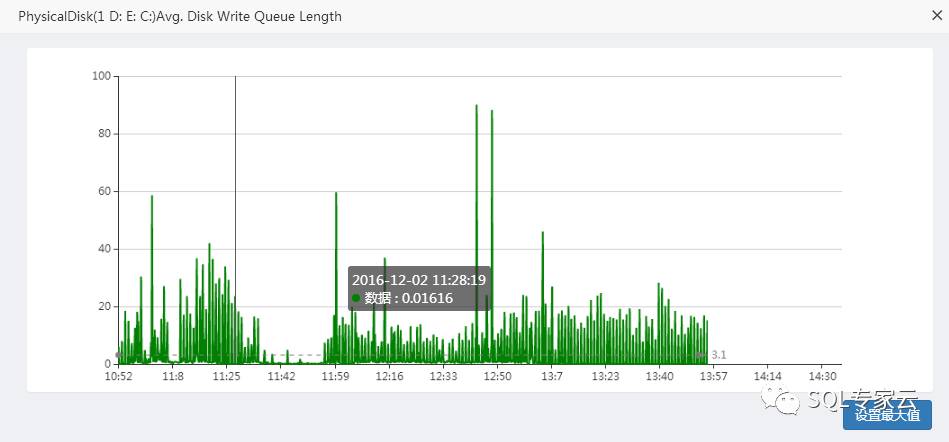
Disk: Disk has a high average queue (general system best case queue should be below 2), and both read and write queues are high. Due to the memory pressure, it is now impossible to tell whether the disk pressure is caused by insufficient memory or the disk speed is not sufficient.
Other counters:
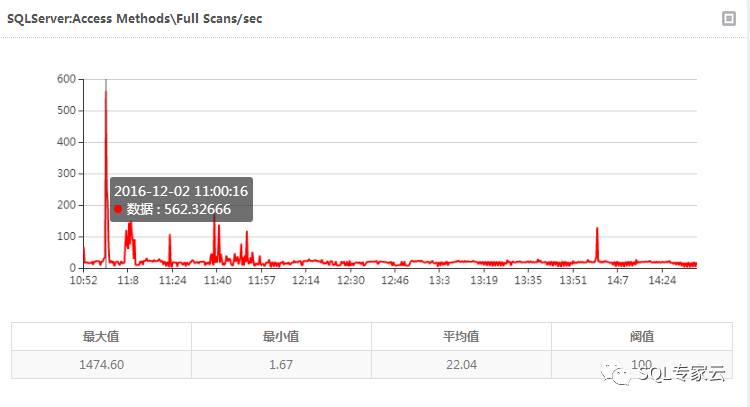
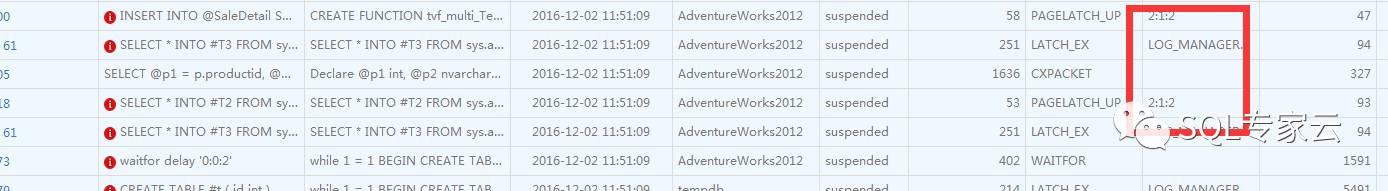
It can be seen that the number of full table scans in the system is relatively high, which indicates that many queries do not apply indexes.
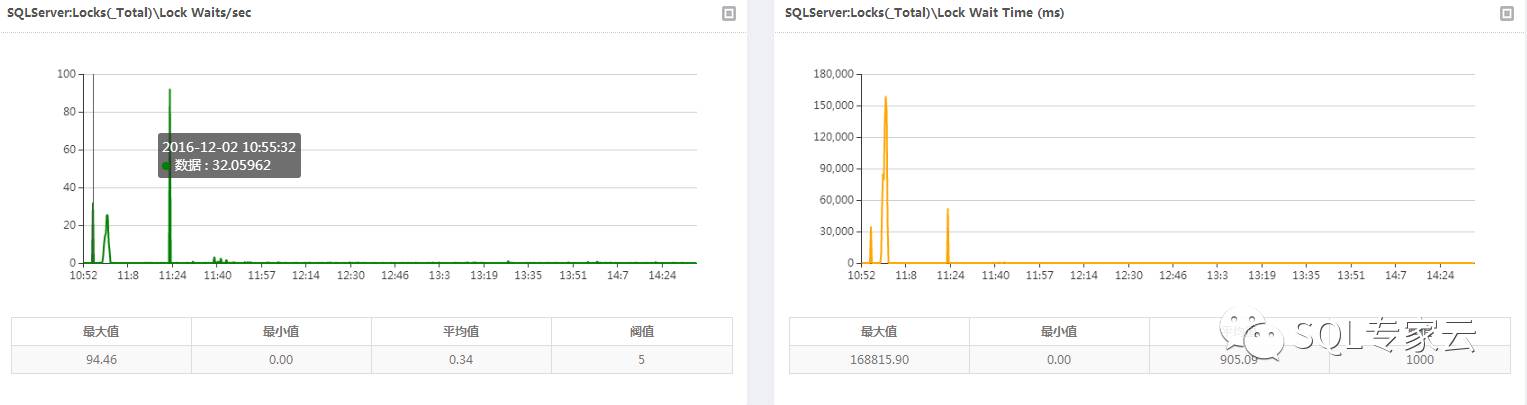
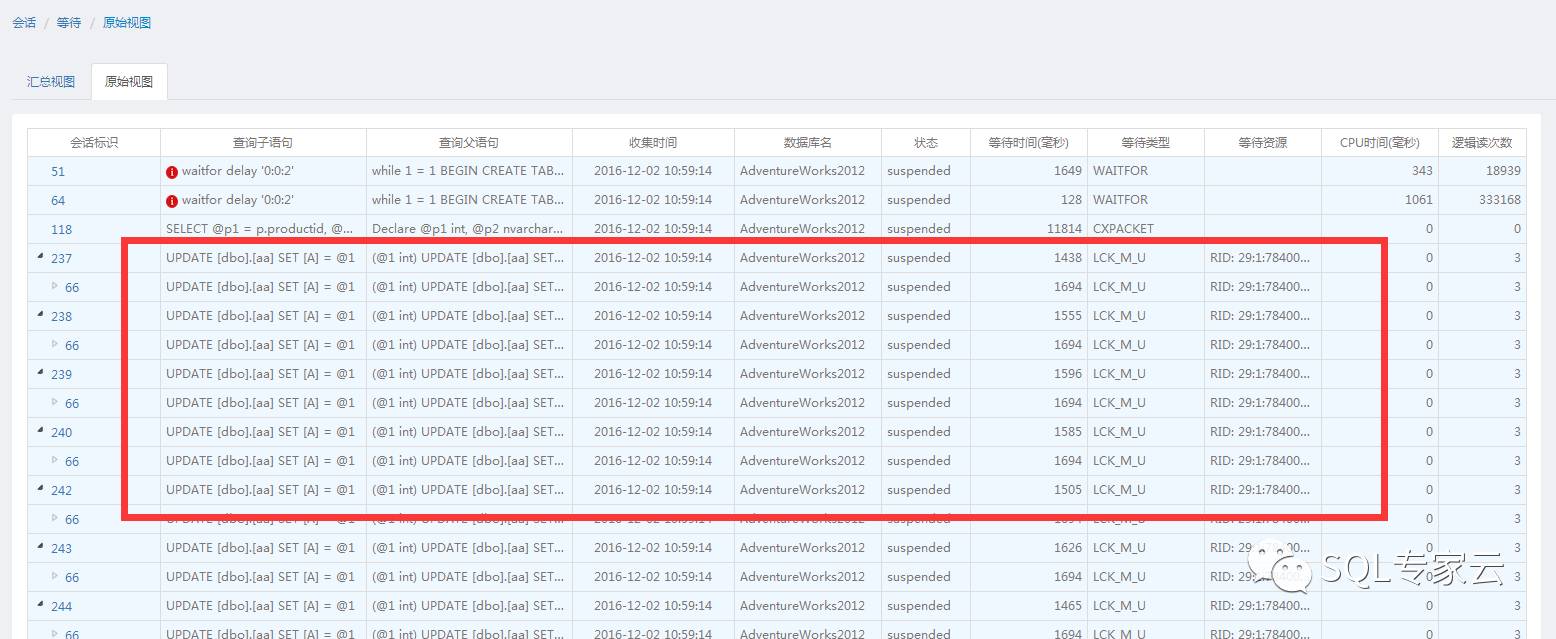
The system has a lot of lock waiting around 11:00 and 11:24, and the waiting time is very long (more than 150s)
The problems of the system can be seen comprehensively through many types of counters. I won't go into detail here
system waiting
Waiting is another indicator that can look at the system at the global level. Most of the slow system running problems are caused by waiting, so the type of waiting can also reflect the system problems intuitively.
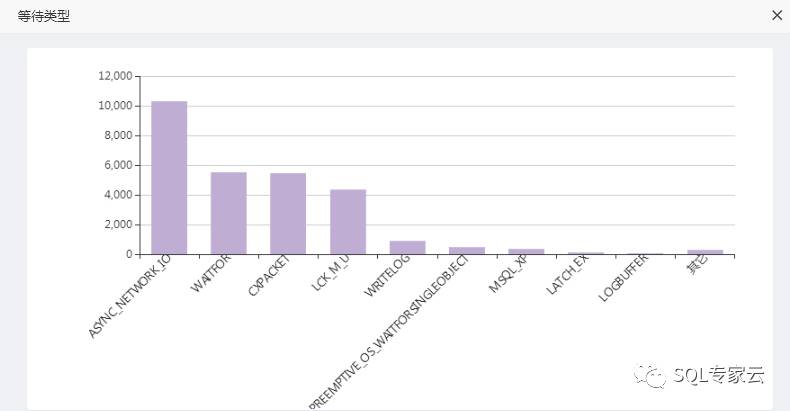
A few major waits:
ASNC_NETWORK_IO: Generally, some queries may return a large amount of data. Please check whether the specific wait statement needs to return so much data.
WAITFOR: It may be that CDC publish and subscribe is configured or the statement waitfor delay is used in the program
CXPACKET: CPU scheduling wait.
LCK_M_U : Statement blocking between update statements.
WRITELOG: Indicates that there are cyclic inserts and new operations in the program and frequent log writing occurs, and the disk speed cannot meet the writing frequency.
Comprehensive analysis
Combining system wait and performance counters, we can basically determine that the system has the following problems:
The CPU, memory, and disk of the system are under great pressure, especially when the CPU load is close to 100%, and there are a large number of table scans in the system that may be missing more than one index. Some statements in the system may return a large amount of unnecessary data, the system lock is serious, the waiting time is very long, and the statement execution time must be very long.
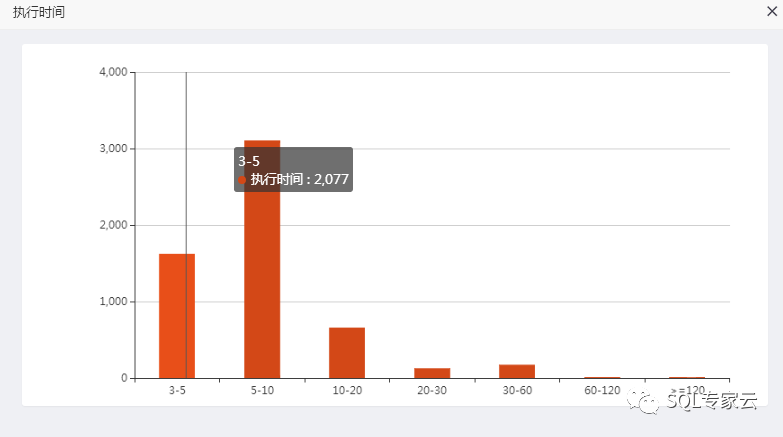
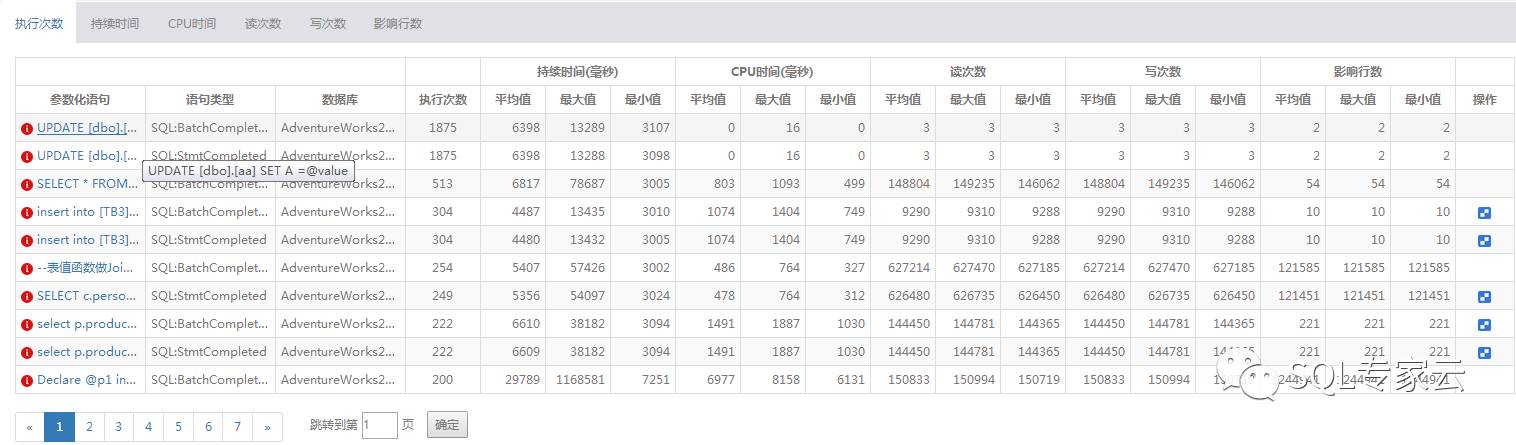
The overall situation of statement execution: Due to the above problems, there must be a large number of long-term statements in the system!
Solve the problem
The definition of the problem is an important step. Comprehensive analysis of multiple indicators from the global perspective makes all problems invisible. After locating the problems, let's take a look at the basic steps to solve these problems.
This case is a situation simulated by myself, so although the resource pressure is very high in appearance, there are not many running statements and limited scenarios. However, if there is such an appearance in the production system, it means your system performance problem Very serious and urgent need for a detailed optimization.
那么下面也介绍一下生产系统遇到这样的问题应该怎么优化,有哪些必要的步骤。
步骤一 针对系统问题对数据库进行全面的优化,提升整体效率
很多人优化可能直奔语句,认为语句就可以解决性能的所有问题,其实这样的观点是不全面的,系统的配置,数据库的配置,索引的规划等都是解决性能的必要步骤。
例如:系统中的语句都是最佳的,数据库运行还是很慢,可能就是因为你的CHECKDB配置的问题,也有可能因为你自动收缩没有关闭而导致的性能问题。
优化操作系统配置
针对服务器进行配置检查,查看是否有配置不合理或可以优化的配置项,比如是否配置了虚拟内存?服务器层面是否限制的资源使用?服务器是否高性能模式运行?
优化数据库层面的配置
针对数据库参数进行合理配置使硬件充分发挥硬件功能,优化不合理配置,降低对数据库造成冲击的可能性。比如:最大并行度?最大内存?

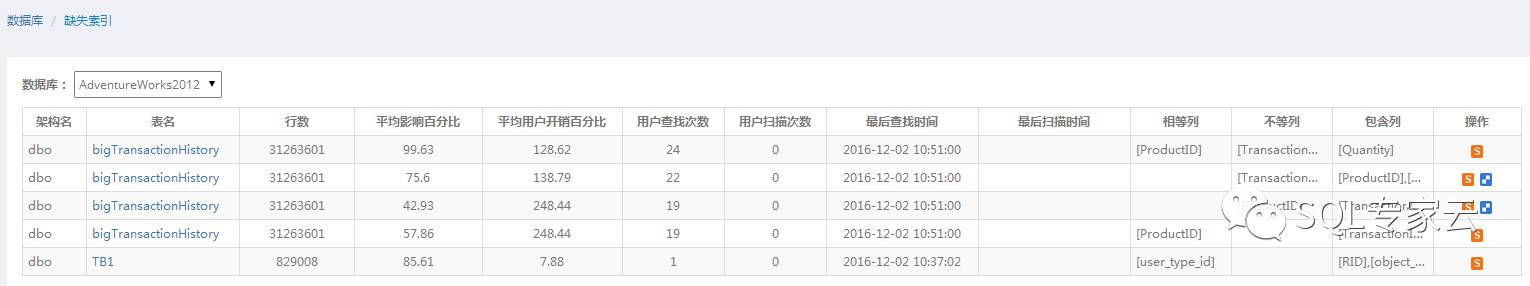
是否大量缺失索引
大量索引缺失必然导致语句性能不佳,并且消耗大量的系统资源,很可能就会造成上面服务器高压力的表象
删除无用索引
针对数据库中无用的索引进行删除。提升更新操作的时间。

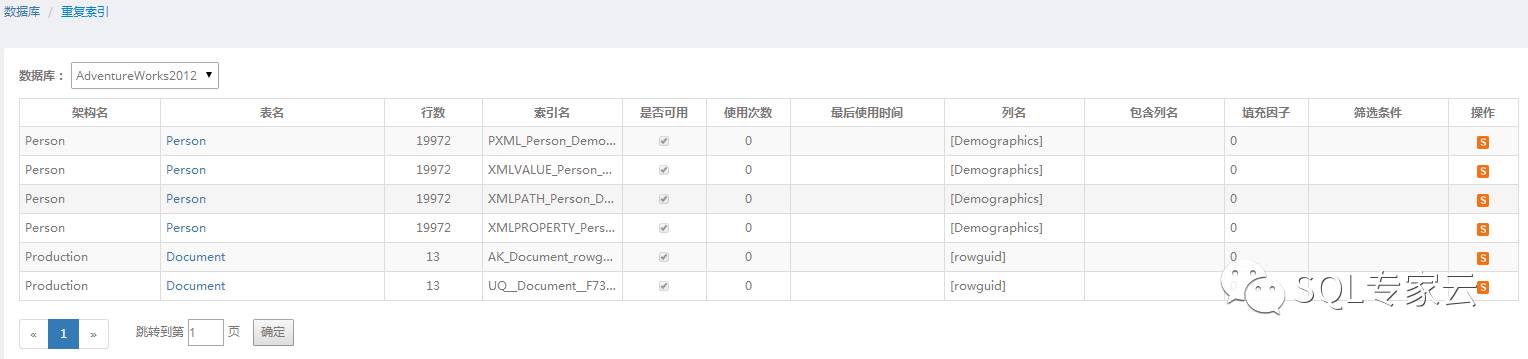
删除重复索引
针对数据库中重复的索引进行删除。提升更新操作的时间。
对重点语句建索引
针对系统中消耗大的语句或执行次数多的语句进行分析,评估语句性能问题,并建立合适的索引提,降低语句的资源消耗,升语句运行效率。
解决阻塞
解决语句间的阻塞,这需要分析语句的阻塞链,到底语句被什么样的操作阻塞了,为什么会阻塞?
很多新手经常问的问题:为什么我有的时候查很快有的时候查就很慢? 答:大多数情况就是你的语句被阻塞了。
优化TempDB
针对TempDB调优,减少TempDB资源争用导致的压力。本例中可以死看到有TempDB的争用等待,所以对TempDB的优化也是必要的。
优化日志碎片
针对日志增大,带来的日志碎片问题进行优化。
清除索引碎片
检查系统的索引维护情况,并针对碎片过大的表进行碎片清除操作。主要体现在系统中有老化的索引,索引的老化导致索引的性能不高或失效。
一阶段预期效果
一阶段的优化是对性能的整体提升,性能提升也会很明显,针对不同系统提升一般在2-3倍。
步骤二 处理热点问题
处理热点问题主要是在阶段一的基本优化后针对重点的语句进行调优,可能包含创建索引,修改写法,查询提示,计划向导等等。
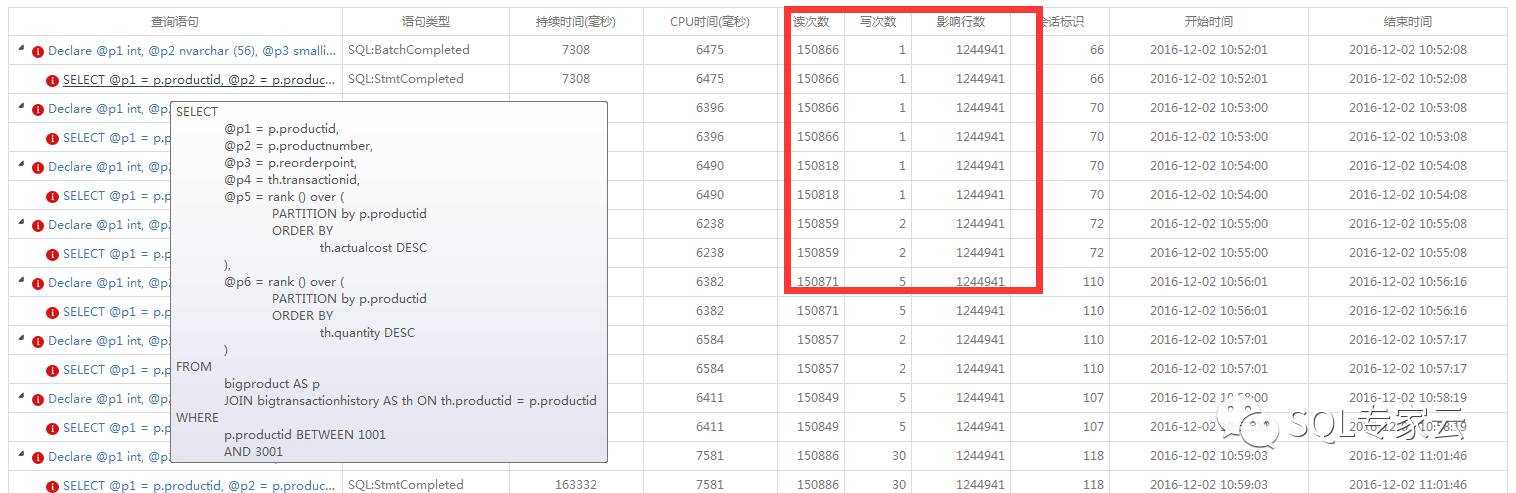
在语句调优中请主要关注:是否有缺失索引,是否存在隐式转换,语句的执行时间、CPU、逻辑读写量、物理读写量、占用TempDB空间等信息。

例:这样一条语句经过第一阶段的优化并没有太大的提升,而且资源消耗依然很大,那么我们可以针对这条语句进行详细的二阶段优化。
简单的优化一下

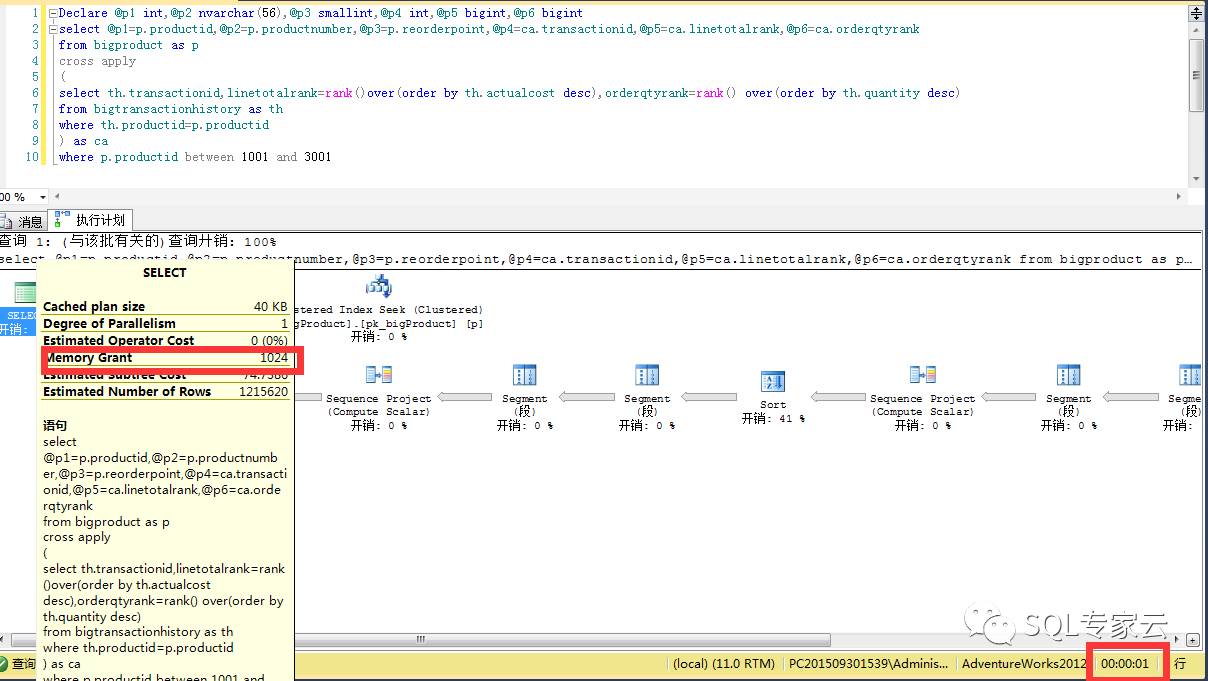
只是简单的改了下语句的写法时间有7秒变成1秒,内存消耗从300+MB 变成 1MB
二阶段预期效果
阶段二的优化属于细致的优化步骤,要针对更为具体的语句、具体的情况。经过本阶段优化可以使系统中大部分语句从写法、配置、运行指标都趋于优化值。
步骤三 针对业务
这个步骤需要配合开发人员,到底哪些功能依然慢?执行了哪些语句?是领导用的功能?还是一般可以慢的功能?如果大领导用的功能,那可能你就需要多花些心思了。这部分这里就不展开说了。
三阶段预期效果
第三阶段属于最细致的阶段,可以结合业务真正点对点的消灭系统中存在问题。
导图
针对性能优化奉上几个图希望能帮助数据库从业者梳理一下优化的思路(个人思路仅供参考,不完善的地方也请见谅)
CPU:

内存:

磁盘:

等待:

总结
在性能优化中最忌讳的就是看到一个指标马上就下手,针对一个指标的判断是盲目的,很可能使问题偏离本身的根本原因,也可能使优化根本无法解决根本问题而只是表象得到了缓解。
本文只是通过一个例子简述一下优化的基本思路,希望帮助更多数据库从业者,了解性能优化。
本文只阐述了思路,具体的各部分解决方式请参见我的系列文章:SQL SERVER全面优化-------Expert for SQL Server 诊断系列
性能的调优是一个持续性的工作,不是一次解决了问题以后就可以高枕无忧了,定期的巡检也是数据库从业者必要的工作之一,做到及早发现及早解决。
巡检系列文章请参见:轻松精通数据库管理之道——运维巡检系列
----------------------------------------------------------------------------------------------------
注:此文章为原创,欢迎转载,请在文章页面明显位置给出此文链接!
若您觉得这篇文章还不错请点击下右下角的推荐,非常感谢!