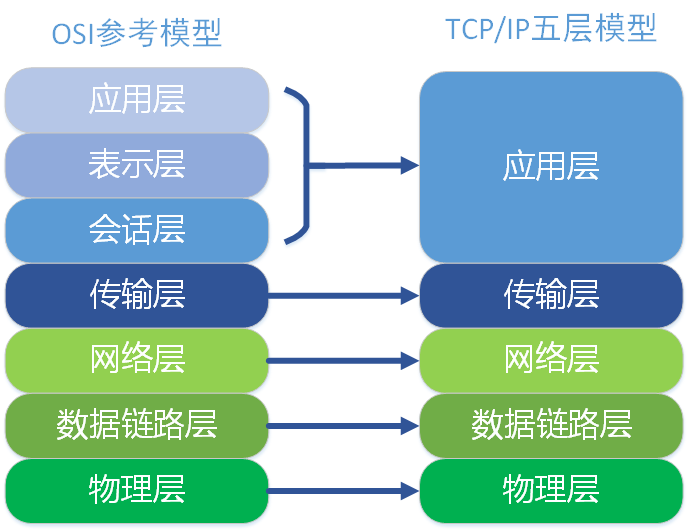
1. Briefly describe the osi seven-layer model and the TCP/IP four-layer model
OSI seven-layer model

TCP/IP four-layer model
2. Briefly describe the iproute family commands
ip command:
ip [OPTIONS] OBJECT {COMMAND|help}
ip link:network device configuration.
ip link set DEV : Modify device properties
1) up or down: enable or disable the interface; example, ip link set eth1 up/down
2) multicast on or multicast off: Enable or disable the multicast function; example, ip link set eth1 multicast on/off
3) name NAME: rename the interface; example, ip link set eth1 name eth666
4) mtu NUMBER: Set the size of the MTU, the default is 1500; (MTU, the maximum transmission unit, the maximum data packet size that can be tolerated on a certain layer of communication protocol; the larger the MTU, the larger the effective data packet carried)
5) netns PID: move the specified network card to the specified virtual network (the local system will not see this network card)
Example, ip netns add mynet (builds virtual network mynet)
ip link set eth1 netns mynet (adds interface eth1 to virtual network mynet)
ip netns exec mynet ip link show (view the interface information of the virtual network mynet)
ip netns del mynet (delete virtual network)
ip link show/list : show device properties
ip link help : display brief usage help
ip netns:manage network namespaces.
Interpretation: netns is a project that provides network virtualization in linux. Using netns, multiple network environments can be virtualized locally. Each virtual network space is independent of the network space of the current system. The network devices and iptables rules are all is independent.
1) ip netns list: list all netns
2) ip netns add NAME: create the specified netns
3) ip netns del NAME: delete the specified netns
4) ip netns exec NAME COMMAND: run the command in the specified netns
5) ip netns help: display brief usage help
6) exit: exit the virtual network
ip address:protocol address management.
1) ip address add IFADDR dev IFACE: add one more IP to the specified network card; for example, ip address add 192.168.10.2/24 dev eth1
[label NAME]: Specifies the interface alias for the additional address; example, ip address add 10.1.1.10/8 dev eth1 label eth1:0
[broadcast ADDRESS]: broadcast address; it will be automatically calculated based on IP and NETMASK;
[scope SCOPE_VALUE]: global: globally available; link: interface available; host: only available locally
2) ip address delete IFADDR dev IFACE: delete the ip of the interface; for example, ip address delete 10.1.1.10/8 dev eth1
3) ip address list/show [IFACE]: Display the address information of the interface; for example, ip address show, ip address list eth1
4) ip address flush dev IFACE: Clear all address information of the interface; for example, ip address flush dev eth1
ip route:routing table management.
1) ip route add TYPE PREFIX via GW [dev IFACE] [src SOURCE_IP]: add routing information; for
example, ip route add 10.0.2.0/24 via 10.0.1.11 (the next hop address to the 10.0.2.0/24 network is 10.0.1.11)
ip route add 10.0.2.0/24 dev eth0 (to reach the 10.0.2.0/24 network through interface eth0)
ip route add 192.168.1.0/24 via 10.0.0.1 dev eth1 (to reach the 192.168.1.0/24 network through The next hop address of interface eth1 is 10.0.0.1)
ip route add 192.168.1.0/24 via 10.0.0.1 dev eth1 src 10.0.10.100 (through the 10.0.10.100 address of the eth1 interface, through the next hop 10.0.0.1 to reach the network 192.168.1.0/24; the gateway of this route is this machine)
ip route add default via 172.16.0.1 dev eth0 (add a default route, go out through the next hop 172.16.0.1 through the eth0 interface)
2) ip route del: delete routing information
Example, ip route delete 192.168.1.0/24
ip route show: display routing information
3) ip route flush - flush routing tables
Example, ip route flush 192.168.1.0/24
4) ip route get: get routing information
Example, ip route get 192.168.0.0/24 ss command:
Get socket information, display similar content to netstat, but more efficient than netstat.
ss [options] [FILTER]
options:
-t: related connections of the TCP protocol
-u: UDP related connections
-w: only show connections for raw sockets
-l: show connections in listening state
-a: connections in all states
-n: do not resolve service names
-p: show processes using sockets
-e: show detailed information
-m: memory usage
-s: show socket usage overview
-o: timer information
FILTER:
=[state TCP-STATE] [EXPRESSION]
TCP-STATE includes:
LISTEN: listen
ESTABLISEHD: Connection established
FIN_WAIT_1: Waiting for remote TCP connection interrupt request
FIN_WAIT_2: Waiting for connection interruption request from remote TCP
SYN_SENT: The client sends a request to connect
SYN_RECV: The server receives the request connection
CLOSED: no connection
Example, ss -tan state ESTABLISHED
EXPRESSION:
dport=
sport=
Example, ss -tan '( dport = :22 or sport = :22 )' (note that spaces cannot be omitted in this command)
3. Describe in detail the management tools htop, vmstat and other related commands, and give examples
htop
A text-based, interactive process viewer, mainly used in the console or shell, is more user-friendly than the top command, and can be said to be an advanced version of top. The Linux system does not install htop by default. You need to install it yourself. You can log in to the official website to download and install or configure the epel source, and install it through yum install htop.
Use of htop:
[root@happiness ~]# htop
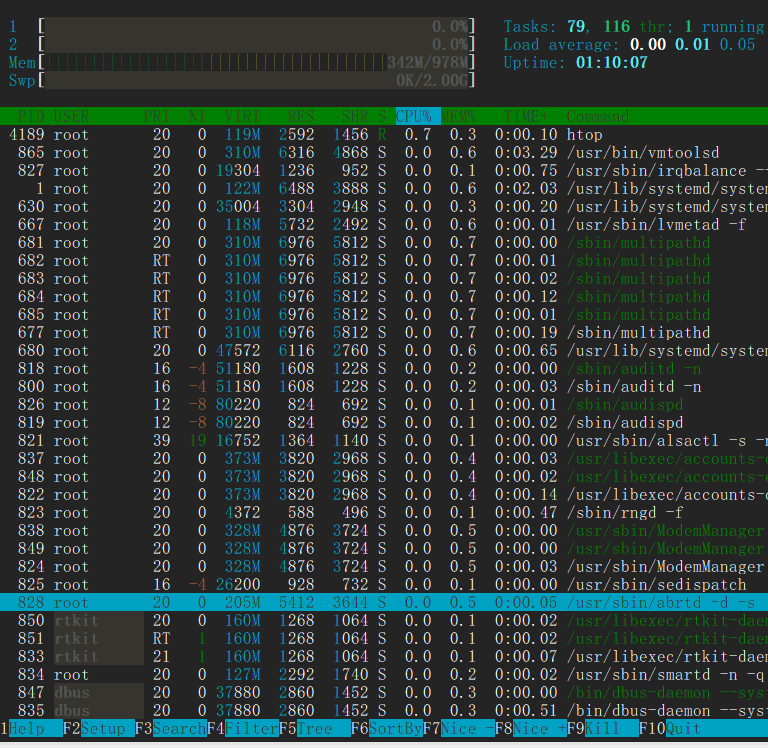
It is divided into four areas in total:
1) Upper left area: display the information of CPU (1 and 2 indicate the number of CPU cores), physical memory and swap partition;
2) Upper right area: Display the number of tasks (tasks), load average (load average) and the running time of the system from boot to present;
3) Process area: Dynamically display all processes in the current system;
4) Operation prompt area: display the shortcut functions defined in the F1~F10 function keys in the current interface.
htop common function keys:
F1 : View the instructions for using htop
F2 : Settings
F3 : search process
F4 : filter, search by keyword
F5 : show tree structure
F6 : select sort method
F7 : Decrease the nice value so that the priority of the corresponding process can be increased
F8 : Increase the nice value, which can reduce the priority of the corresponding process
F9 : kill the selected process
F10 : exit htop
/ : search character
h : show help
l : Displays files opened by the process
u : Display all users, and can select the process of a specific user
s : the system call that will call strace to trace the process
t : display tree structure
H : show/hide user threads
I : reverse the sort order
K : show/hide kernel threads
M : Sort by memory usage
P : Sort by CPU
T : Sort by running time
Up and down keys or PgUP, PgDn: move the selected process
Left and right keys or Home, End: move the list
Space (space): mark/unmark a process
htop common options:
- d #: Specify the delay interval
- u UserName: Show only the processes of the specified user
-s COLUME: sort by the specified field
vmstat
It is a low-overhead tool to dynamically monitor the overall situation of the system's virtual memory, processes, and CPU activity within a specified time interval. Command format: vmstat [options] [delay [count] ].
delay: refresh time interval, if not specified, only one result is displayed;
count: the number of refreshes; if count is not specified but delay is specified, it will be refreshed all the time.
Common options options:
-a: show active and inactive memory
-f: Display the number of forks since system startup
-m: Display slab information (slab, Linux's memory allocation mechanism)
-n: show each field name only once at the beginning
-s: Display memory-related statistics and the number of various system activities
-d: Display disk related statistics
-p: Display the specified disk partition statistics
-S: Display using the specified unit. The parameters are k , K , m , and M , which represent 1000, 1024, 1000000, and 1048576 bytes respectively. The default unit is K (1024 bytes)
-V: Display vmstat version information
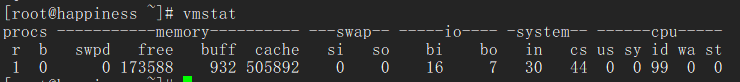
Example:
Display summary information once by default
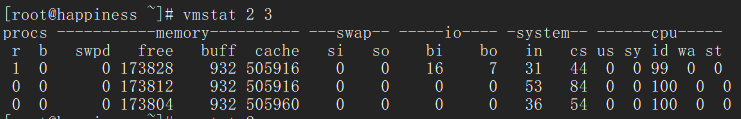
The summary is refreshed once every 2 seconds, showing a total of 3 times
Keyword Definition:

4. Use until and while to ping 192.168.0.0/24 respectively
#!/bin/bash
declare -i up=0
declare -i down=0
declare -i i=0
declare -i j=1
trap 'interrupt_trap' INT

interrupt_trap() {
    echo "QUIT"
    echo "There are $up ips being up."
    echo "There are $down ips being down."
    exit 1
}

while [ $i -le 255 ]; do
    while [ $j -le 255 ]; do
        if [ $i -eq 255 -a $j -eq 255 ]; then
            break
        fi
        ping -W1 -c1 192.168.$i.$j &> /dev/null
        if [ $? -eq 0 ]; then
            echo "192.168.$i.$j is up."
            let up++
        else
            echo "192.168.$i.$j is down."
            let down++
        fi
        let j++
        [ $j -eq 256 ] && j=1
    done
    let i++
done

echo "There are $up ips being up."
echo "There are $down ips being down."