When using matlab to draw pictures, sometimes you need to use subplot to generate dozens of pictures to see together, such as the following program:
clc;
clear;
close all;
warning off;


y(:,1) = rand(100,1);
y(:,2) = rand(100,1);
y(:,3) = rand(100,1);
y(:,4) = rand(100,1);
y(:,5) = rand(100,1);
y(:,6) = rand(100,1);
y(:,7) = rand(100,1);
y(:,8) = rand(100,1);
y(:,9) = rand(100,1);


figure;
subplot(3,3,1);plot(y(:,1));title('y1');
subplot(3,3,2);plot(y(:,2));title('y2');
subplot(3,3,3);plot(y(:,3));title('y3');
subplot(3,3,4);plot(y(:,4));title('y4');
subplot(3,3,5);plot(y(:,5));title('y5');
subplot(3,3,6);plot(y(:,6));title('y6');
subplot(3,3,7);plot(y(:,7));title('y7');
subplot(3,3,8);plot(y(:,8));title('y8');
subplot(3,3,9);plot(y(:,9));title('y9');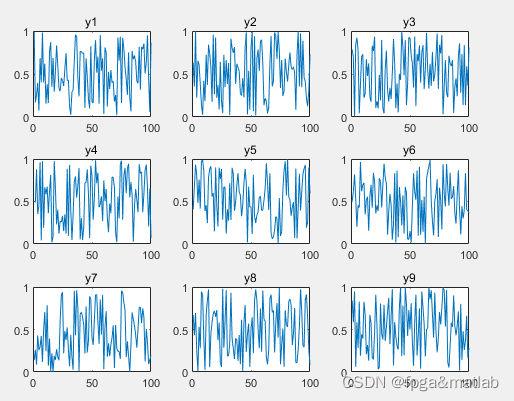
It can be seen that 9 graphs are generated, but when there are many graphs generated, the above programming method is very troublesome, and it is also very inconvenient to modify.
Here is a simple for loop generation method, the code is as follows:
clc;
clear;
close all;
warning off;


y(:,1) = rand(100,1);
y(:,2) = rand(100,1);
y(:,3) = rand(100,1);
y(:,4) = rand(100,1);
y(:,5) = rand(100,1);
y(:,6) = rand(100,1);
y(:,7) = rand(100,1);
y(:,8) = rand(100,1);
y(:,9) = rand(100,1);

figure;
for i = 1:9
    subplot(3,3,i);plot(y(:,i));title(['y',num2str(i)]);
end
Through the for loop, nine pictures can be generated in one sentence. Note that the title needs to be rewritten as: ['y', num2str(i)], so that the small label of y can automatically change with i.