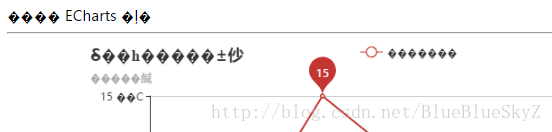
When using the demo of Baidu's echarts, there is a problem of Chinese garbled characters
1. Front-end page coding format problem
Two meta tags are used
<meta charset="utf-8">
<meta name="content-type" content="text/html; charset=utf-8">
Removing one line solved the explicit problem. . But there is a problem with the toolbar
<meta name="content-type" content="text/html; charset=utf-8">
After analysis, it is found that the toolbar should be introduced through js, and the coding problem can be solved by setting the coding format of js
<script src="js/echarts.min.js" charset="utf-8"></script>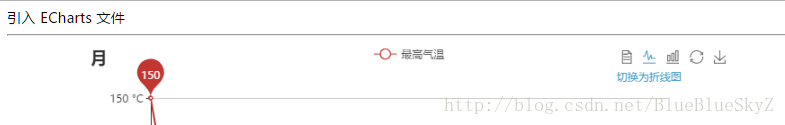
2. Data (json) storage format
Another problem with the error is that the transmitted data is garbled, so the read data.json (for example) itself needs to be stored in the form of utf-8 .
This notepad is very pitiful. The default format for saving directly using Notepad is not utf-8, so it will generate garbled characters when reading. It is recommended to use Sublime or Notepad++ to open the file after creating and set the file encoding to utf-8.
The properties of the demo are attached below:
option = {
    title : {
        text: '未来一周气温变化',
        subtext: '纯属虚构'
    },
    tooltip : {
        trigger: 'axis'
    },
    legend: {
        data:['最高气温','最低气温']
    },
    toolbox: {
        show : true,
        feature : {
            mark : {show: true},
            dataView : {show: true, readOnly: false},
            magicType : {show: true, type: ['line', 'bar']},
            restore : {show: true},
            saveAsImage : {show: true}
        }
    },
    calculable : true,
    xAxis : [
        {
            type : 'category',
            boundaryGap : false,
            data : ['周一','周二','周三','周四','周五','周六','周日']
        }
    ],
    yAxis : [
        {
            type : 'value',
            axisLabel : {
                formatter: '{value} °C'
            }
        }
    ],
    series : [
        {
            name:'最高气温',
            type:'line',
            data:[11, 11, 15, 13, 12, 13, 10],
            markPoint : {
                data : [
                    {type : 'max', name: '最大值'},
                    {type : 'min', name: '最小值'}
                ]
            },
            markLine : {
                data : [
                    {type : 'average', name: '平均值'}
                ]
            }
        },
        {
            name:'最低气温',
            type:'line',
            data:[1, -2, 2, 5, 3, 2, 0],
            markPoint : {
                data : [
                    {name : '周最低', value : -2, xAxis: 1, yAxis: -1.5}
                ]
            },
            markLine : {
                data : [
                    {type : 'average', name : '平均值'}
                ]
            }
        }
    ]
};