1. Visual Studio Code
1.1. Installation, Setup
-
- macOS
- Linux
- Windows
-
Recommended configuration
Please refer to here , just some initial settings, beautification, etc., nothing to do with PHP debugging.
1.2. PHP Debug
-
Install
Shortcut cmd + p or ctrl + p, enter
ext install php debugNote: You must restart vscode after installation is complete.
-
configure
Open a PHP project, click the menu Debug > Add Configuration , or follow the steps below

The detailed configuration is as follows:
{
    // Use IntelliSense to learn about possible attributes.
    // Hover to view descriptions of existing attributes.
    // For more information, visit: https://go.microsoft.com/fwlink/?linkid=830387
    "version": "0.2.0",
    "configurations": [
        {
            "name": "Listen for XDebug",
            "type": "php",
            "request": "launch",
            "port": 9001, // 对应 XDebug 的配置
            "stopOnEntry": true,
            "pathMappings": {
                // "容器中对应的项目地址": "本机项目地址"
                // 绝对路径
                "/var/www/html/debao/": "${workspaceRoot}"
            }
        },
        {
            "name": "Launch currently open script",
            "type": "php",
            "request": "launch",
            "program": "${file}",
            "cwd": "${fileDirname}",
            "port": 9001
        }
    ]
}
After the configuration is successful, a directory containing the configuration is generated under the project, as follows:
.
├── .vscode
│   ├── launch.json
├── 其它项目文件
2. PHP environment under Docker
It is recommended to clone a Docker-based LNMPA environment that I packaged before. Of course, you can also use your own Docker PHP environment, but the configuration here is for the combination of Nginx + Apache, and you can adjust it according to the specific environment.
Details are as follows:
2.1. Install and configure the XDebug extension
-
Modify the Dockerfile and install XDebug
...
&& mkdir -p /tmp/xdebug \
&& wget -c https://github.com/xdebug/xdebug/archive/2.6.0.tar.gz \
&& tar -xf 2.6.0.tar.gz -C /tmp/xdebug --strip-components=1 \
&& docker-php-ext-configure /tmp/xdebug --enable-xdebug \
&& docker-php-ext-install /tmp/xdebug \
...
After modification, you need to recompile the corresponding image file. For more ways to install extensions, please refer to: How to install extensions in PHP in Docker
-
Configure XDebug
Append the following configuration to the php.ini file
[XDebug]
zend_extension = xdebug.so
xdebug.remote_enable = 1
xdebug.remote_handler = dbgp
xdebug.remote_port = 9001
xdebug.remote_autostart = 1
xdebug.remote_connect_back = 0
xdebug.idekey = docker
xdebug.remote_host = 192.168.2.14
illustrate:
- remote_port defaults to 9000, to avoid conflicts, change to 9001
- remote_host is the ip address of the host
2.2. Adjust Nginx server configuration
server {

    listen 80;
    server_name my.test; # 这里替换你的域名
    index index.html index.htm index.php;
    root /usr/share/nginx/html/test;

    ...

    location ~ .*\.(php|php5)?$ {
        proxy_pass http://php_apache:8091; # 这里是对应的 apache 容器地址和端口
        proxy_read_timeout 300;
        proxy_send_timeout 300;
        index index.php;
        proxy_set_header Host $host;
        proxy_set_header X-Real-IP $remote_addr;
    }

    ...
}
The following two parameters are mainly added to solve the problem of 504 timeout during debugging. The specific value can be set as required.
- proxy_read_timeout
- proxy_send_timeout
2.3. Expose the XDebug communication interface
Modify the docker-compose.yml file to expose port 9001 through expose under nginx and apache services
Restart the service with the following command
docker-compose stop
docker-compose down
docker-compose up -d
3. Test breakpoint debugging
Press the shortcut key F5to open the breakpoint. At this time, when you visit the web page in the browser, you will jump to the vscode editor, and the style is as follows:
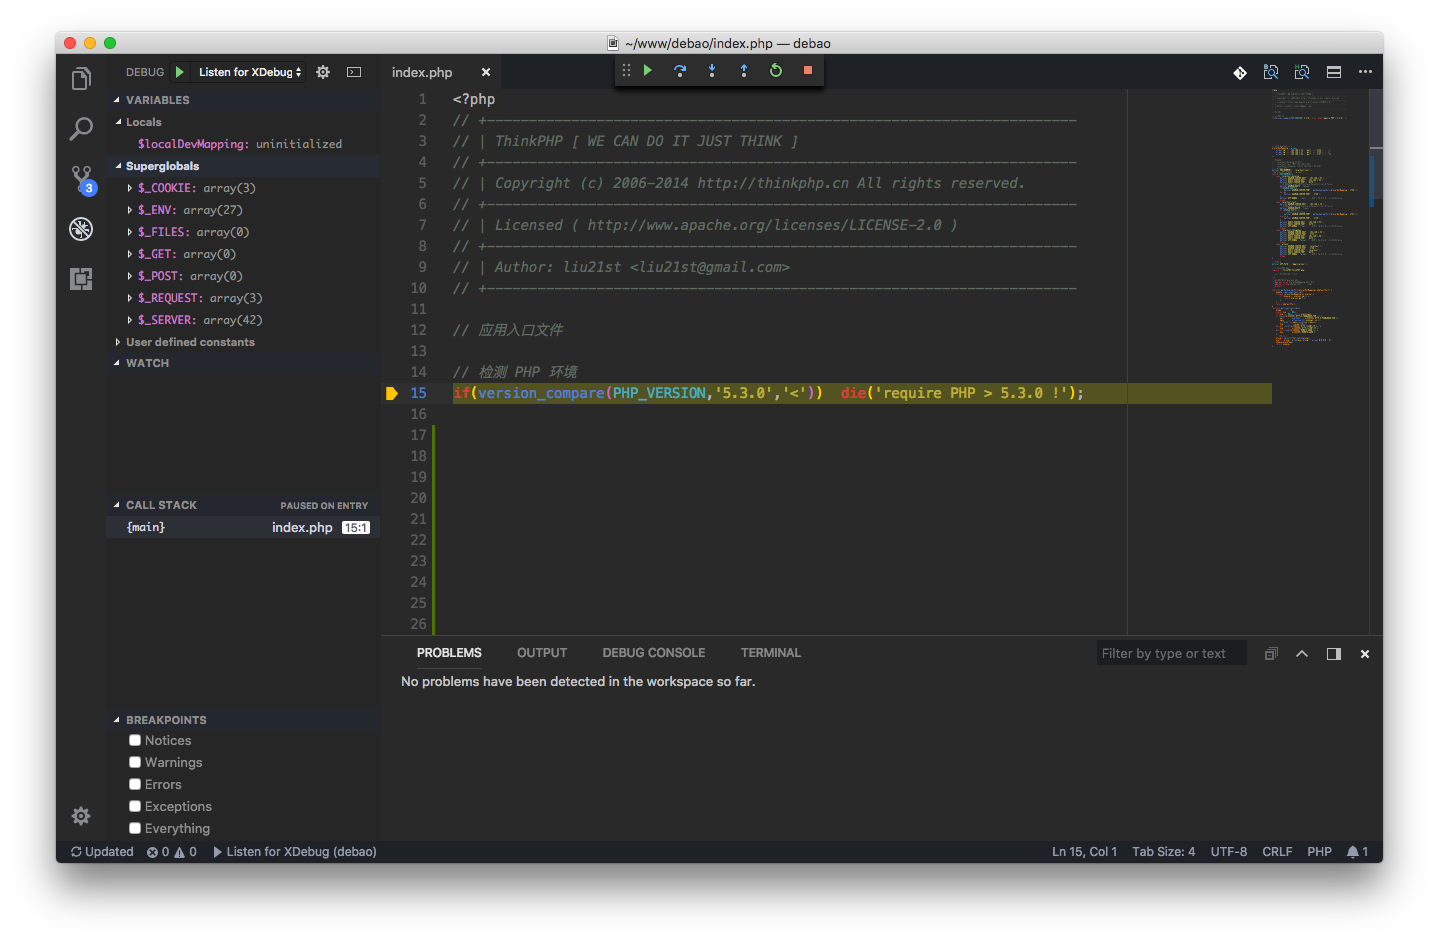
Note: The above picture is a TP project. Although there is no manual setting of breakpoints, after opening the debug mode, accessing the web page will first enter the framework entry file in the root directory.