Reprinted from ==== Jmeter script recording method (1) Use Badboy recording and Jmeter's own proxy server recording respectively
There are three types of Jmeter recording methods, namely: recording with Badboy, recording with the proxy server that comes with Jmeter and manual recording. Today, we will introduce the first two recording methods.
Badboy Recording
Badboy is a dynamic application testing tool developed with C++, which has powerful screen recording and playback functions, and provides graphical result analysis functions. The script recorded by Badboy can be exported to the format of .jmx suffix. jmx is the format in which the Jmeter script is saved. Its essence is
A file in XML format.
There are two ways to record Badboy: one is Request mode, the other is Navigation mode, which is switched by the 'N' button on the toolbar; Request mode is to simulate the browser to send form information to the server, and each resource will be sent as a request ; Navigation side
The method is to record the operation of the user's mouse, and simulate interface clicks during playback, similar to the UI automation testing tool selenium.
Due to the needs of Jmeter for scripts, we use the Request method to record and generate jmx format scripts.
Badboy download address: http://www.badboy.com.au/ , the installation method is very simple, because it is an exe program, you can double-click to install it.
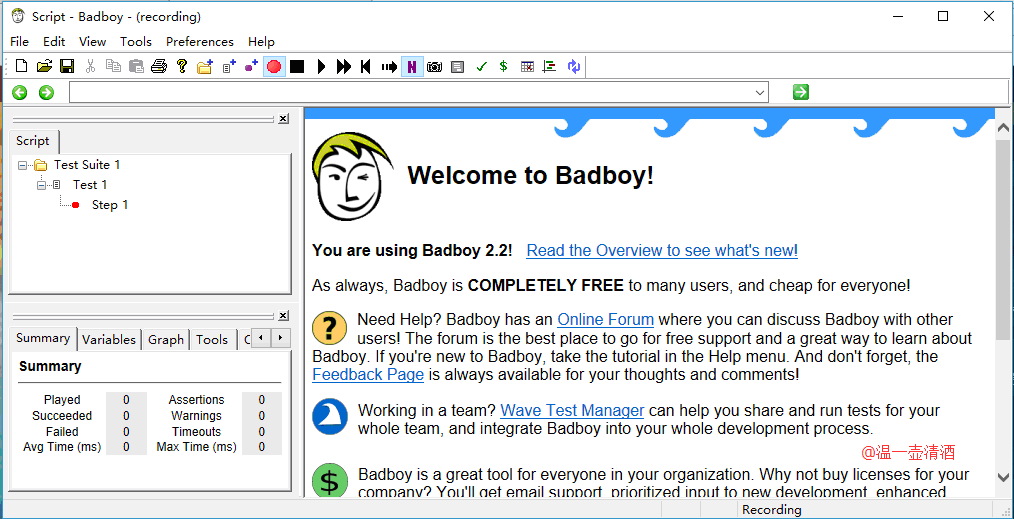
After the installation is successful, the following interface will appear:
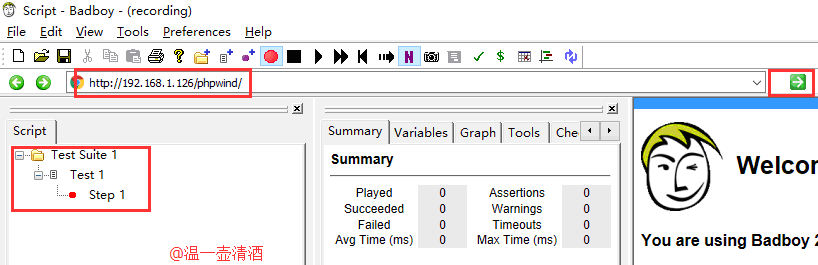
Recording with Badboy is very simple. First, create a new Test Suite, enter the URL to be recorded in the box, and click the green button on the right to:
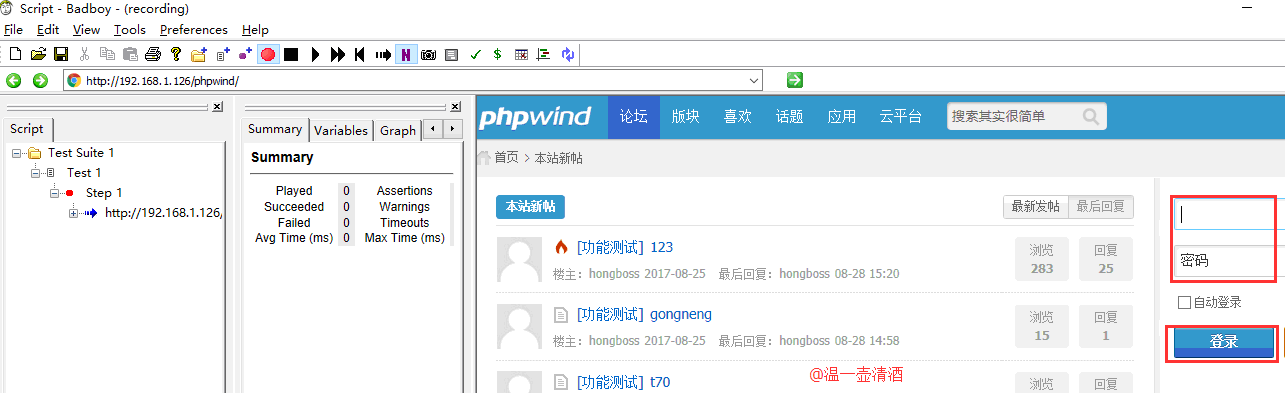
After clicking the green button, the following page will appear, and the login operation will be recorded, and the corresponding operation will be recorded:
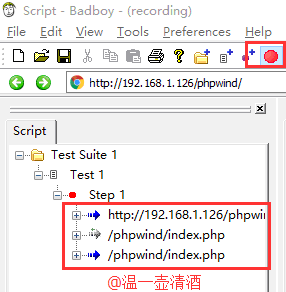
After the recording is completed, the following interface will appear, click the red button to stop:
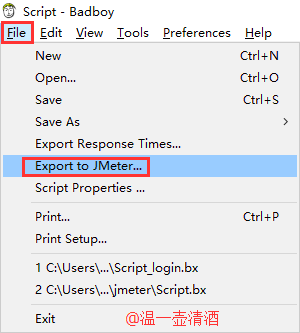
Export the file to jmeter as follows:
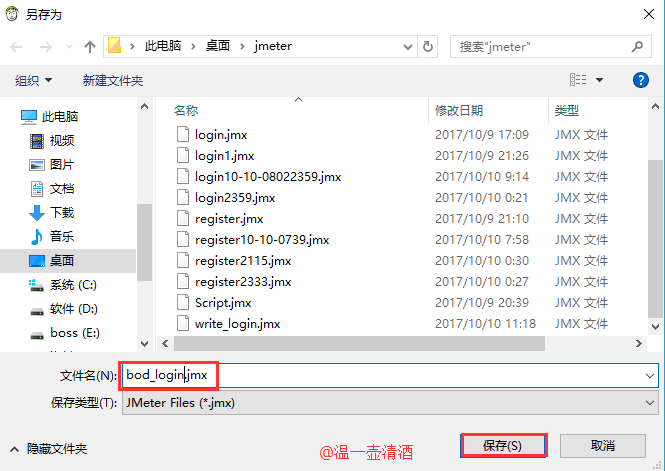
Save it to your own folder:
Then open it in jmeter software, and the operation is as follows:

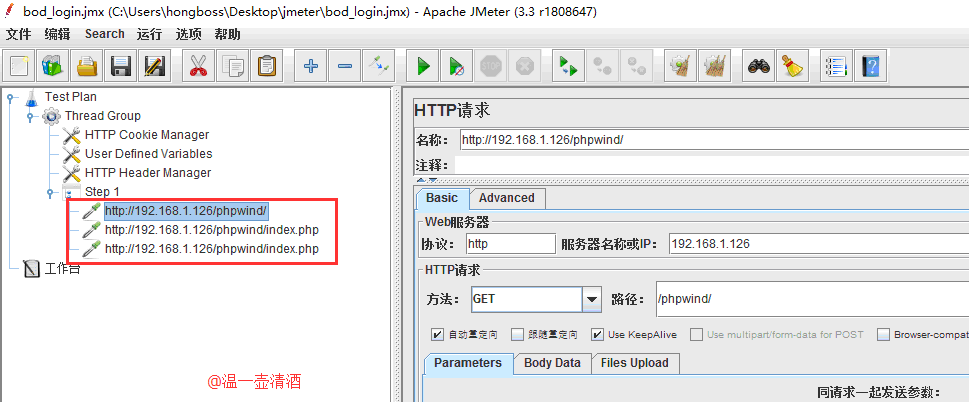
After adding it, the following result will appear, which is the recorded script.
The script is recorded successfully, but it does not mean that the script can be run. It is necessary to debug the script, such as association and request header setting.
Jmeter's own proxy server recording
Its principle: jmeter is set as a proxy server, similar to fiddler to capture packets to complete script recording
It can be divided into the following steps:
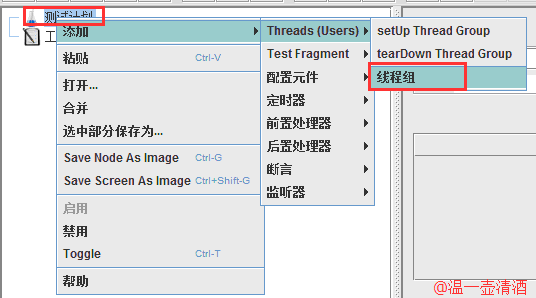
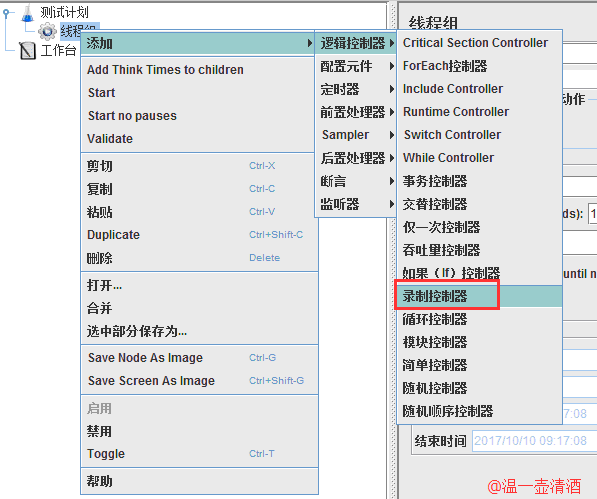
1. Jmeter creates a new thread group - recording controller
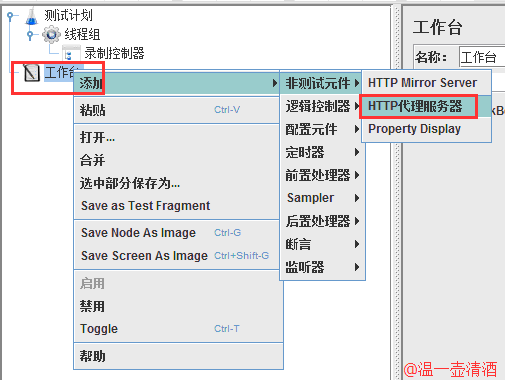
2. Set up jmeter proxy Workbench - non-test component - proxy server
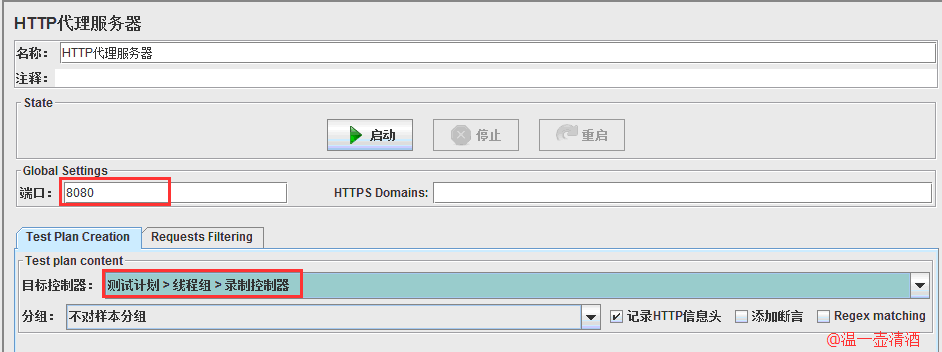
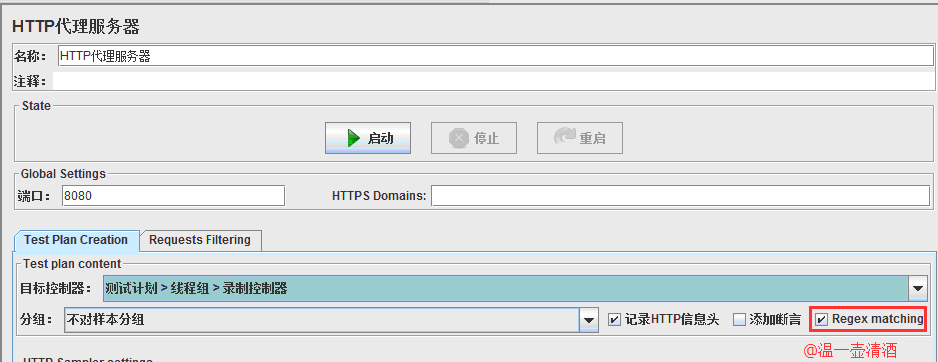
3. Port 8080, select the recording controller as the target controller, check Allow regular expressions and add .*\.(bmp|css|js|gif|ico|jp?g|png|swf|woff to the exclusion pattern )
4. Start the proxy server
5. Set proxy in IE browser 127.0.0.1 8080
6. Use Google browser to operate the website, there will be automatic recording effect
Look at the first step:
Jmeter creates a new thread group - recording controller
Step 2:
Set up jmeter proxy workbench - non-test element - proxy server
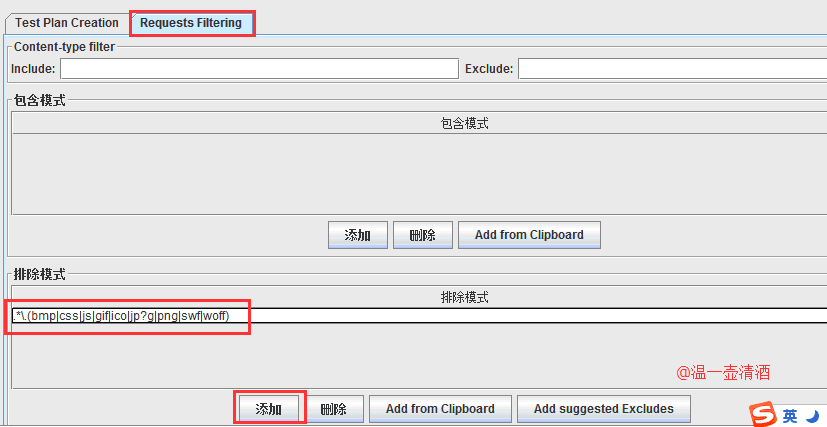
third step:
port 8080, target controller select recording controller, check allow regex and add .*\.(bmp|css|js|gif|ico|jp?g|png|swf|woff) to exclude pattern
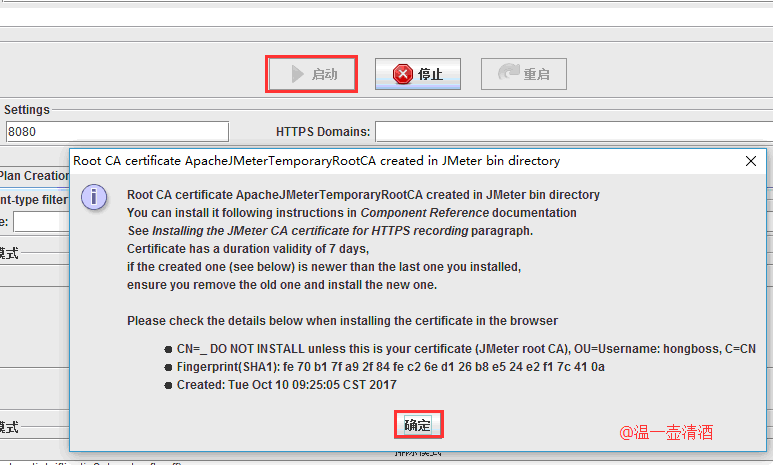
the fourth step:
Start the proxy server, here is just a prompt, click OK
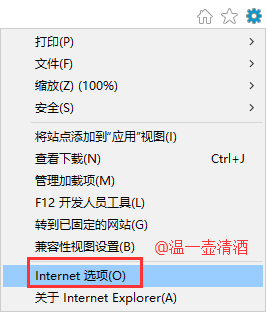
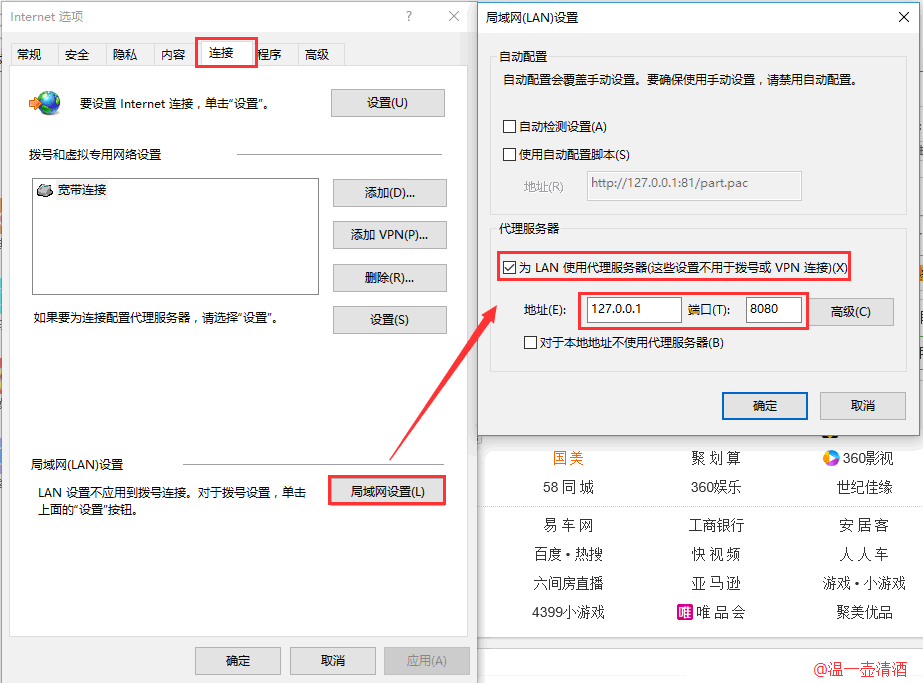
the fifth step:
Set the proxy 127.0.0.1 8080 in the IE browser, and fill in 127.0.0.1 here, because the local machine is used as the proxy server, otherwise an error will occur. After setting, you need to restart the service to take effect.
Step 6:
Use Google Chrome to operate the website, there will be an automatic recording effect
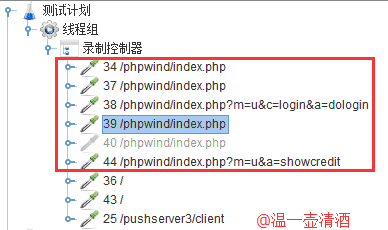
The script is recorded successfully, but it does not mean that the script can be run. It is necessary to debug the script, such as association and request header setting.
Reprints are welcome, but this statement must be retained without the author's consent, and a link to the original text is given in an obvious position on the article page, otherwise the right to pursue legal responsibility is reserved.
Article source: http://www.cnblogs.com/hong-fithing/
There are three types of Jmeter recording methods, namely: recording with Badboy, recording with the proxy server that comes with Jmeter and manual recording. Today, we will introduce the first two recording methods.
Badboy Recording
Badboy is a dynamic application testing tool developed with C++, which has powerful screen recording and playback functions, and provides graphical result analysis functions. The script recorded by Badboy can be exported to the format of .jmx suffix. jmx is the format in which the Jmeter script is saved. Its essence is
A file in XML format.
There are two ways to record Badboy: one is Request mode, the other is Navigation mode, which is switched by the 'N' button on the toolbar; Request mode is to simulate the browser to send form information to the server, and each resource will be sent as a request ; Navigation side
The method is to record the operation of the user's mouse, and simulate interface clicks during playback, similar to the UI automation testing tool selenium.
Due to the needs of Jmeter for scripts, we use the Request method to record and generate jmx format scripts.
Badboy download address: http://www.badboy.com.au/ , the installation method is very simple, because it is an exe program, you can double-click to install it.
After the installation is successful, the following interface will appear:
Recording with Badboy is very simple. First, create a new Test Suite, enter the URL to be recorded in the box, and click the green button on the right to:
After clicking the green button, the following page will appear, and the login operation will be recorded, and the corresponding operation will be recorded:
After the recording is completed, the following interface will appear, click the red button to stop:
Export the file to jmeter as follows:
Save it to your own folder:
Then open it in jmeter software, and the operation is as follows:
After adding it, the following result will appear, which is the recorded script.
The script is recorded successfully, but it does not mean that the script can be run. It is necessary to debug the script, such as association and request header setting.
Jmeter's own proxy server recording
Its principle: jmeter is set as a proxy server, similar to fiddler to capture packets to complete script recording
It can be divided into the following steps:
1. Jmeter creates a new thread group - recording controller
2. Set up jmeter proxy Workbench - non-test component - proxy server
3. Port 8080, select the recording controller as the target controller, check Allow regular expressions and add .*\.(bmp|css|js|gif|ico|jp?g|png|swf|woff to the exclusion pattern )
4. Start the proxy server
5. Set proxy in IE browser 127.0.0.1 8080
6. Use Google browser to operate the website, there will be automatic recording effect
Look at the first step:
Jmeter creates a new thread group - recording controller
Step 2:
Set up jmeter proxy workbench - non-test element - proxy server
third step:
port 8080, target controller select recording controller, check allow regex and add .*\.(bmp|css|js|gif|ico|jp?g|png|swf|woff) to exclude pattern
the fourth step:
Start the proxy server, here is just a prompt, click OK
the fifth step:
Set the proxy 127.0.0.1 8080 in the IE browser, and fill in 127.0.0.1 here, because the local machine is used as the proxy server, otherwise an error will occur. After setting, you need to restart the service to take effect.
Step 6:
Use Google Chrome to operate the website, there will be an automatic recording effect
The script is recorded successfully, but it does not mean that the script can be run. It is necessary to debug the script, such as association and request header setting.
Reprints are welcome, but this statement must be retained without the author's consent, and a link to the original text is given in an obvious position on the article page, otherwise the right to pursue legal responsibility is reserved.
Article source: http://www.cnblogs.com/hong-fithing/