1. Sun HotSpot VM is a virtual machine that comes with JDK and Open JDK, and it is also the most widely used Java virtual machine.
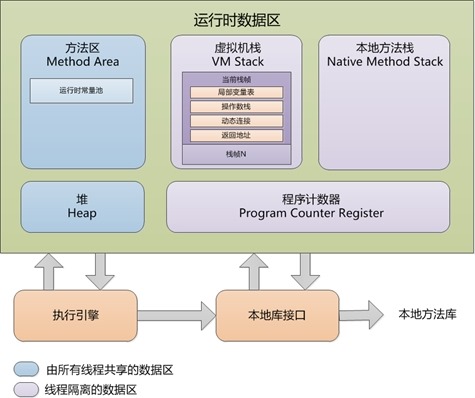
2. JVM memory distribution
Program Counter: A small memory space that can be seen as a line number indicator of the bytecode executed by the current thread. Basic functions such as branching, looping, jumping, exception handling, and thread recovery in the program all need to rely on this counter to complete. Since multithreading is implemented by switching threads in turn and allocating processor execution time, this area is a thread-private memory.
Virtual machine stack: Describes the memory model of Java method execution, used to store local variable tables, operand stacks, dynamic links, method exits, etc.
Heap: It is the largest piece of memory managed by the Java virtual machine. A memory area shared by all threads is created when the virtual machine starts, stores the instance, and is also the main method area managed by the garbage collector
: used to store class information, constants, static variables, and real-time compiled class information that have been loaded by the virtual machine. code, etc. HotSVM also performs GC for this area, mainly constant recovery and class
3. JVM memory allocation strategy
Object memory allocation, in the general direction, is allocated on the Java heap.
In most cases, objects are allocated in the new generation Eden area. When there is not enough space in the Eden area for allocation, the virtual machine will initiate a Minor GC.
In most cases, large objects directly enter the old age, and the virtual machine provides parameters to define the threshold of large objects. Objects that exceed the threshold will directly enter the old age.
Objects that are still alive after multiple Minor GCs (long-lived objects) will enter the old generation. The virtual machine provides parameters to set the threshold.
4. JVM garbage collection algorithm
Mark-Sweep Algorithm: First mark all objects that need to be reclaimed, and reclaim all marked objects uniformly after marking is completed.
Copy Algorithm: Divide the available memory into two equal-sized blocks according to their capacity, and use only one of them at a time. When a piece of memory is used up, it will be stored on another piece, and then the used memory space will be cleaned up at one time.
Mark-to-clean algorithm: The marking process is the same as the "mark-to-clean" algorithm, but instead of directly cleaning up the recyclable objects, the subsequent steps move the end of the object, and then directly clean up the memory outside the end boundary.
Generational collection algorithm: Generally, the Java heap is divided into the new generation and the old generation, and the most appropriate collection algorithm is adopted according to the characteristics of each generation. The new generation found that a large number of objects died, and the replication algorithm was used. Because of the high survival rate of objects in the old age, the "mark-sweep" or "mark-clean" algorithm must be used for recycling.
5. Garbage collector
Serial collector: It is a single-threaded collector that only uses one CPU or one collection thread to complete the garbage collection work. During garbage collection, all other worker threads must be suspended until the collection ends.
ParNew collector: It is a multi-threaded version of the Serial collector, except that it uses multiple threads for garbage collection, and the rest of the behavior is exactly the same as the Serial collector.
CMS collector: is a collector whose goal is to obtain the shortest recovery pause time. The process is divided into the following four steps:
initial mark
concurrent mark
remark
concurrent clear
6. JVM common startup parameters
-Xms / -Xmx — 堆的初始大小 / 堆的最大大小
-Xmn — 堆中年轻代的大小
-XX:-DisableExplicitGC — 让System.gc()不产生任何作用
-XX:+PrintGCDetails — 打印GC的细节
-XX:+PrintGCDateStamps — 打印GC操作的时间戳
-XX:NewSize / XX:MaxNewSize — 设置新生代大小/新生代最大大小
-XX:NewRatio — 可以设置老生代和新生代的比例
-XX:PrintTenuringDistribution — 设置每次新生代GC后输出幸存者乐园中对象年龄的分布
-XX:InitialTenuringThreshold / -XX:MaxTenuringThreshold:设置老年代阀值的初始值和最大值
-XX:TargetSurvivorRatio:设置幸存区的目标使用率
7.JAVA类生命周期
Java类从被加载到虚拟机内存中开始,到卸载出内存为止,它的整个生命周期包括:加载、验证、准备、解析、初始化、使用、卸载七个阶段。
8.JVM类加载
启动(Bootstrap)类加载器:是用本地代码实现的类装入器,它负责将 <Java_Runtime_Home>/lib下面的类库加载到内存中(比如rt.jar)。由于引导类加载器涉及到虚拟机本地实现细节,开发者无法直接获取到启动类加载器的引用,所以不允许直接通过引用进行操作。
标准扩展(Extension)类加载器:是由 Sun 的 ExtClassLoader(sun.misc.Launcher$ExtClassLoader)实现Java_Runtime_Home >/lib/extjava.ext.dir指定位置中的类库加载到内存中。开发者可以直接使用标准扩展类加载器。
系统(System)类加载器:是由 Sun 的 AppClassLoader(sun.misc.Launcher$AppClassLoader)实现的。径(CLASSPATH)中指定的类库加载到内存中。开发者可以直接使用系统类加
双亲委派机制描述 :某个特定的类加载器在接到加载类的请求时,首先将加载任务委托给父类加载器,依次递归,如果父类加载器可以完成类加载任务,就成功返回;只有父类加载器无法完成此加载任务时,才自己去加载。
9.JVM调优
查看堆空间大小分配(年轻代、年老代、持久代分配)
垃圾回收监控(长时间监控回收情况)
线程信息监控:系统线程数量
线程状态监控:各个线程都处在什么样的状态下
线程详细信息:查看线程内部运行情况,死锁检查
CPU热点:检查系统哪些方法占用了大量CPU时间
内存热点:检查哪些对象在系统中数量最大