Configure grafana to directly connect to the zabbix database
Since grafana is finally displayed in the graph through zabbix value, but because some monitoring items of zabbix may take a long time to obtain the value, we can make grafana directly connect to the database for direct value, so as to make the displayed graph more accurate
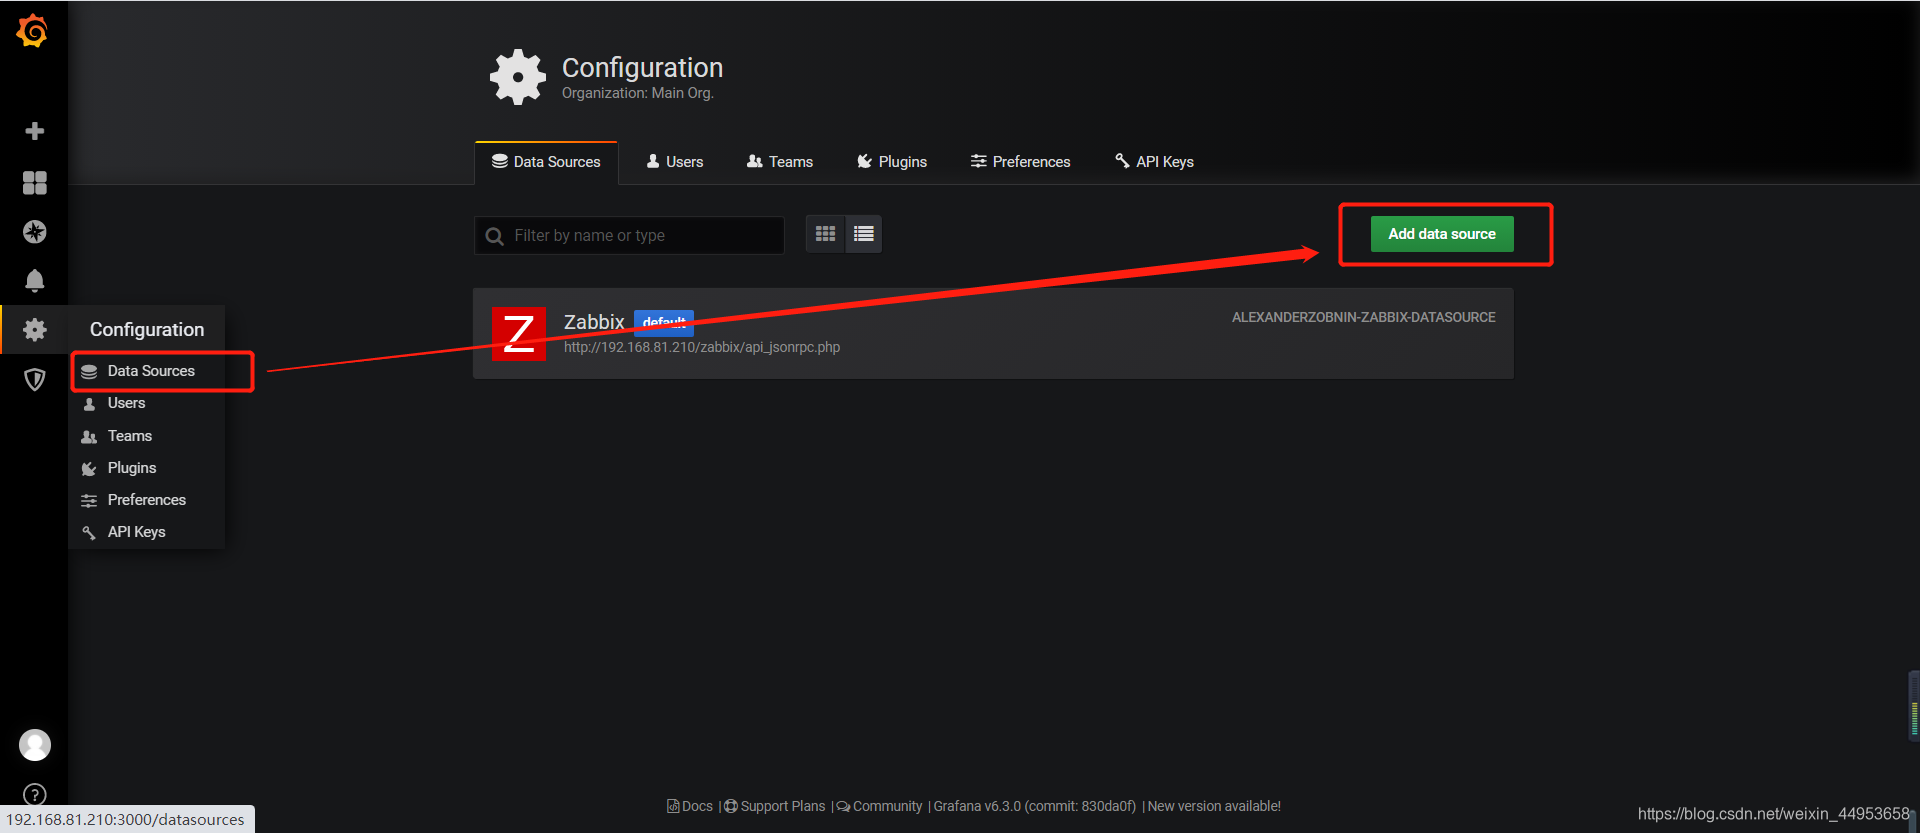
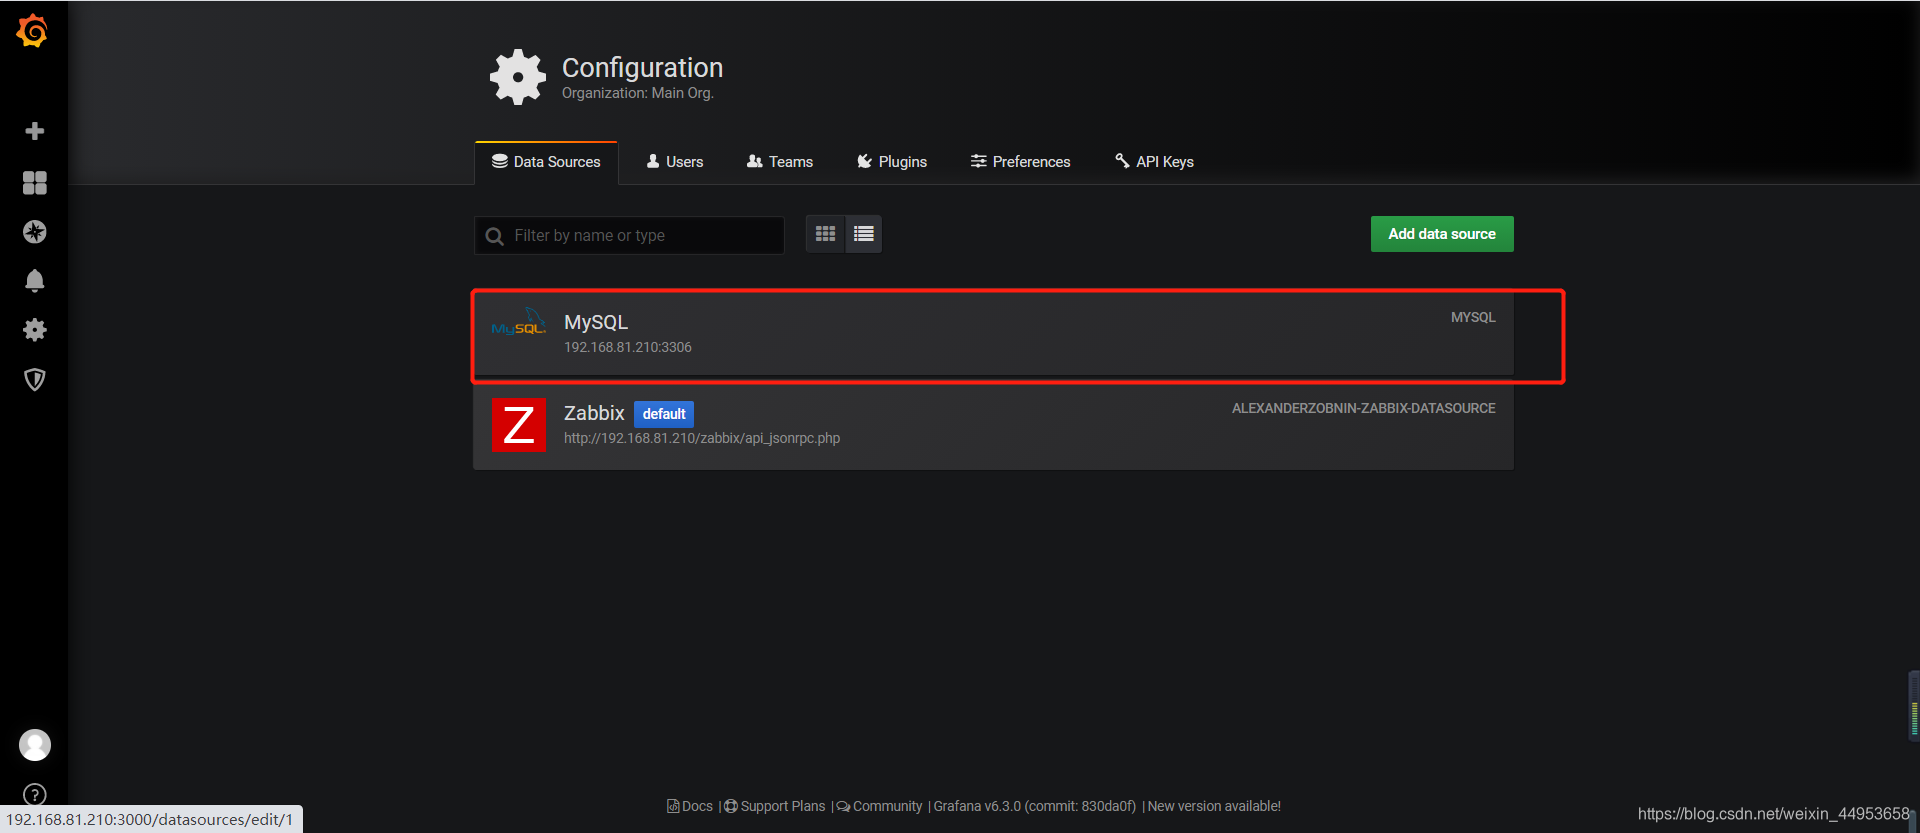
1. Add MySQL data source
Click Configure—Data Source—Add data source
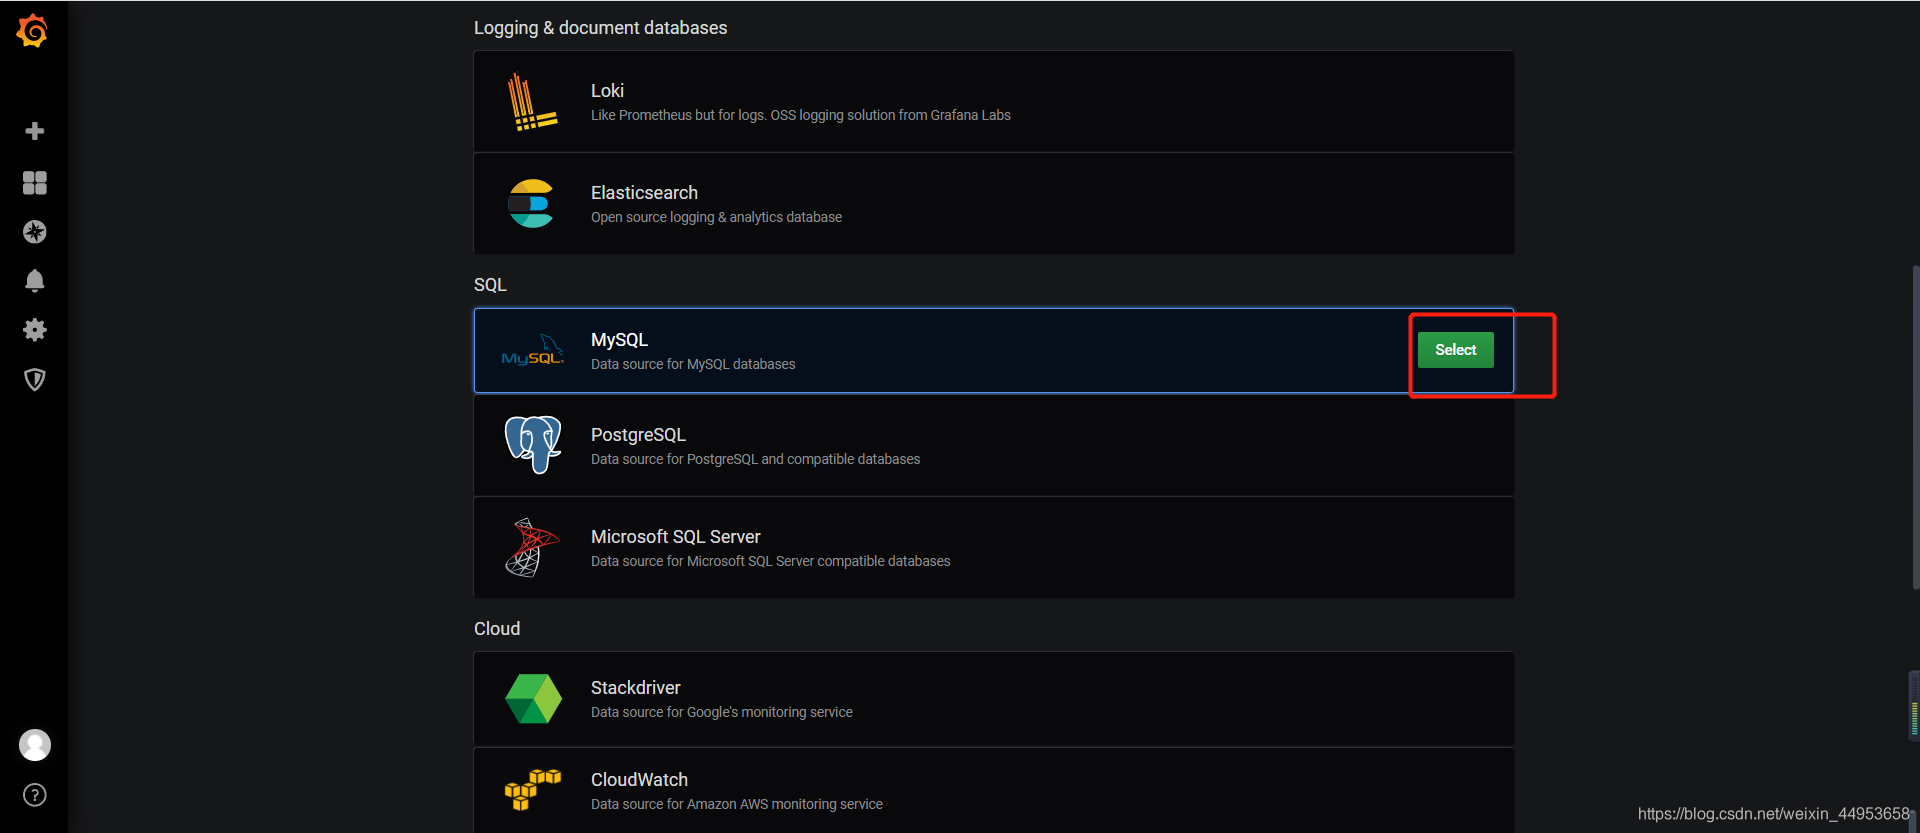
Choose MySQL
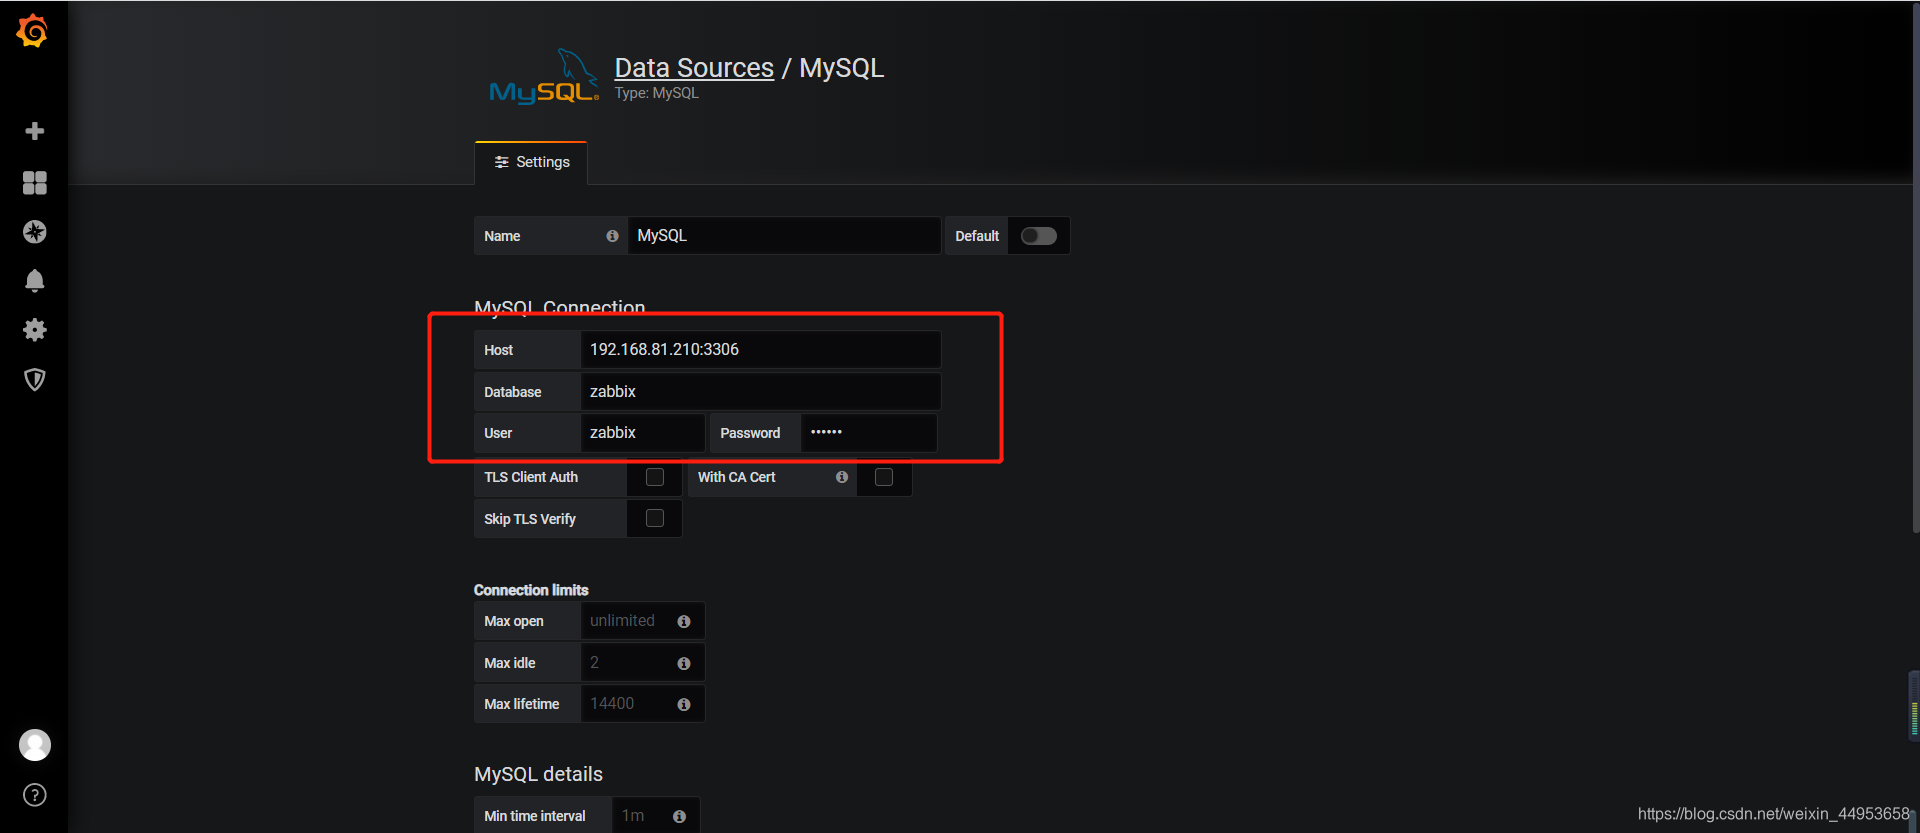
Fill in the MySQL database information
host:192.168.81.210
database:zabbix
user:zabbix
password:123456
Test whether the database connection is successful
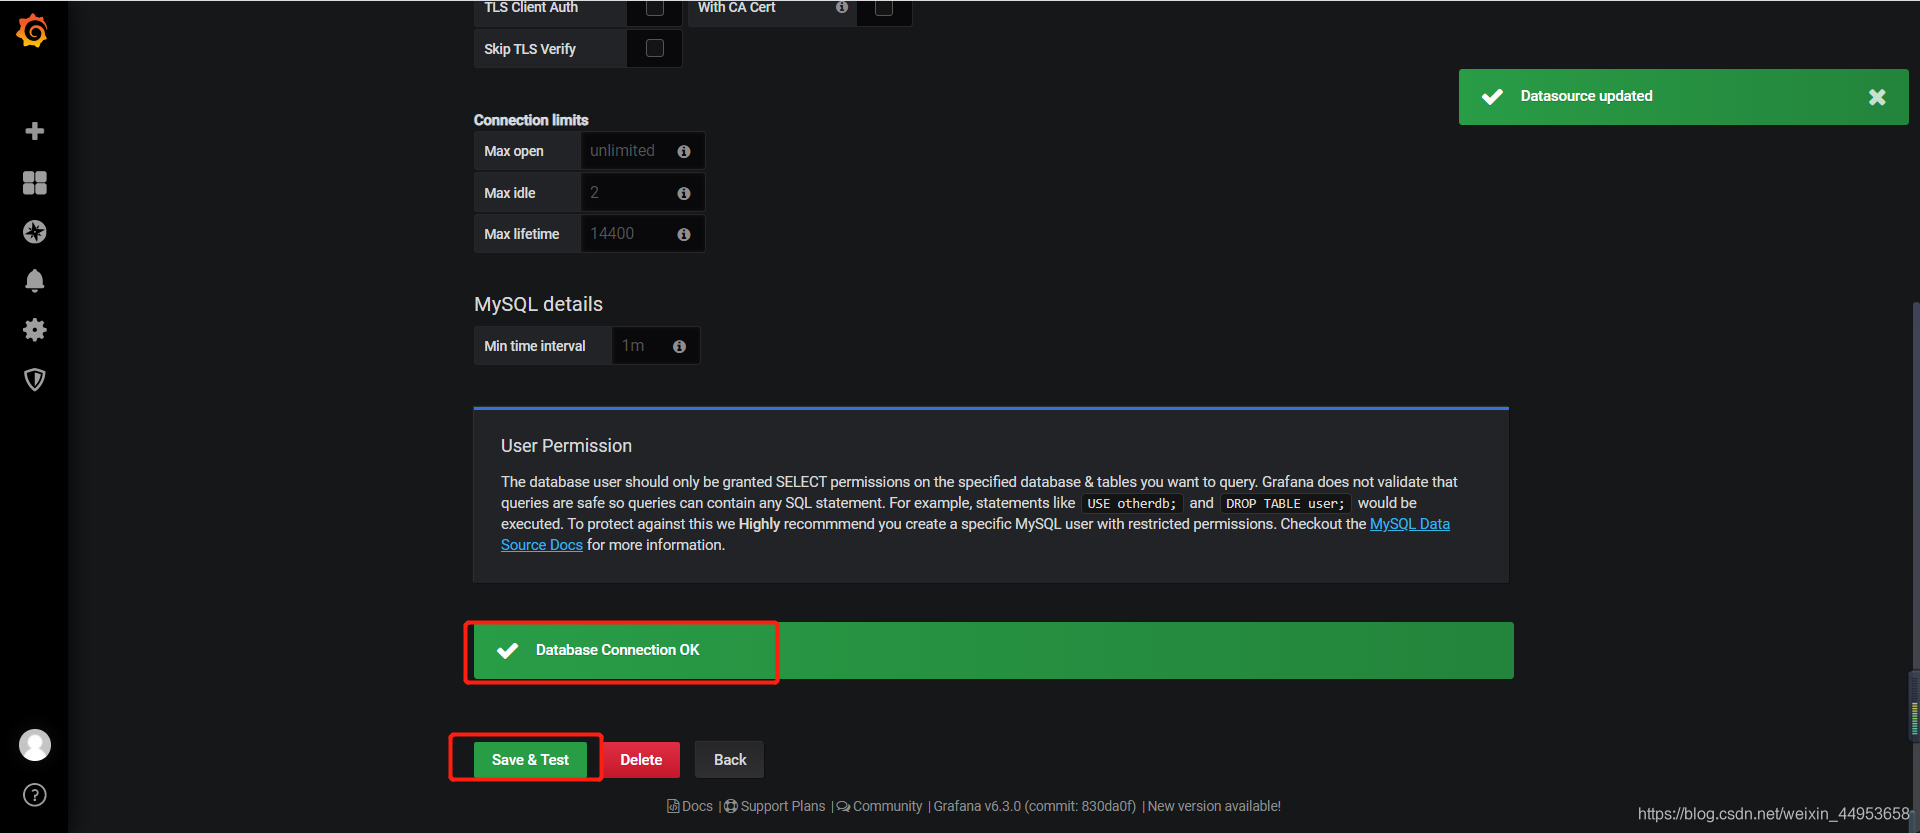
Added successfully
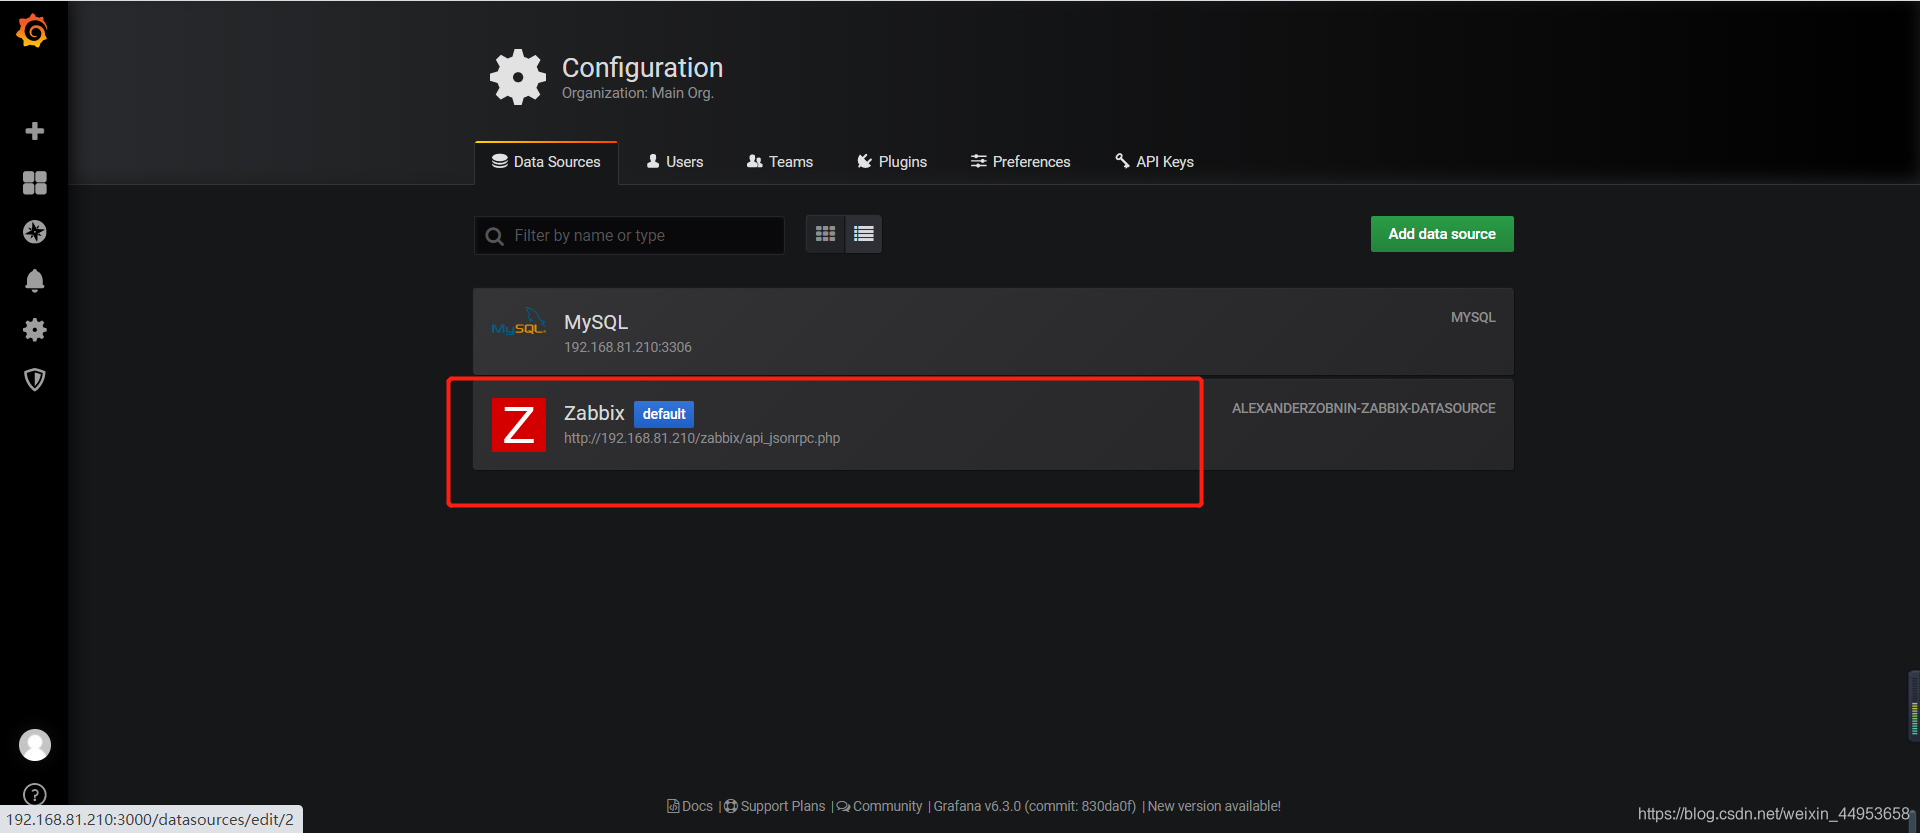
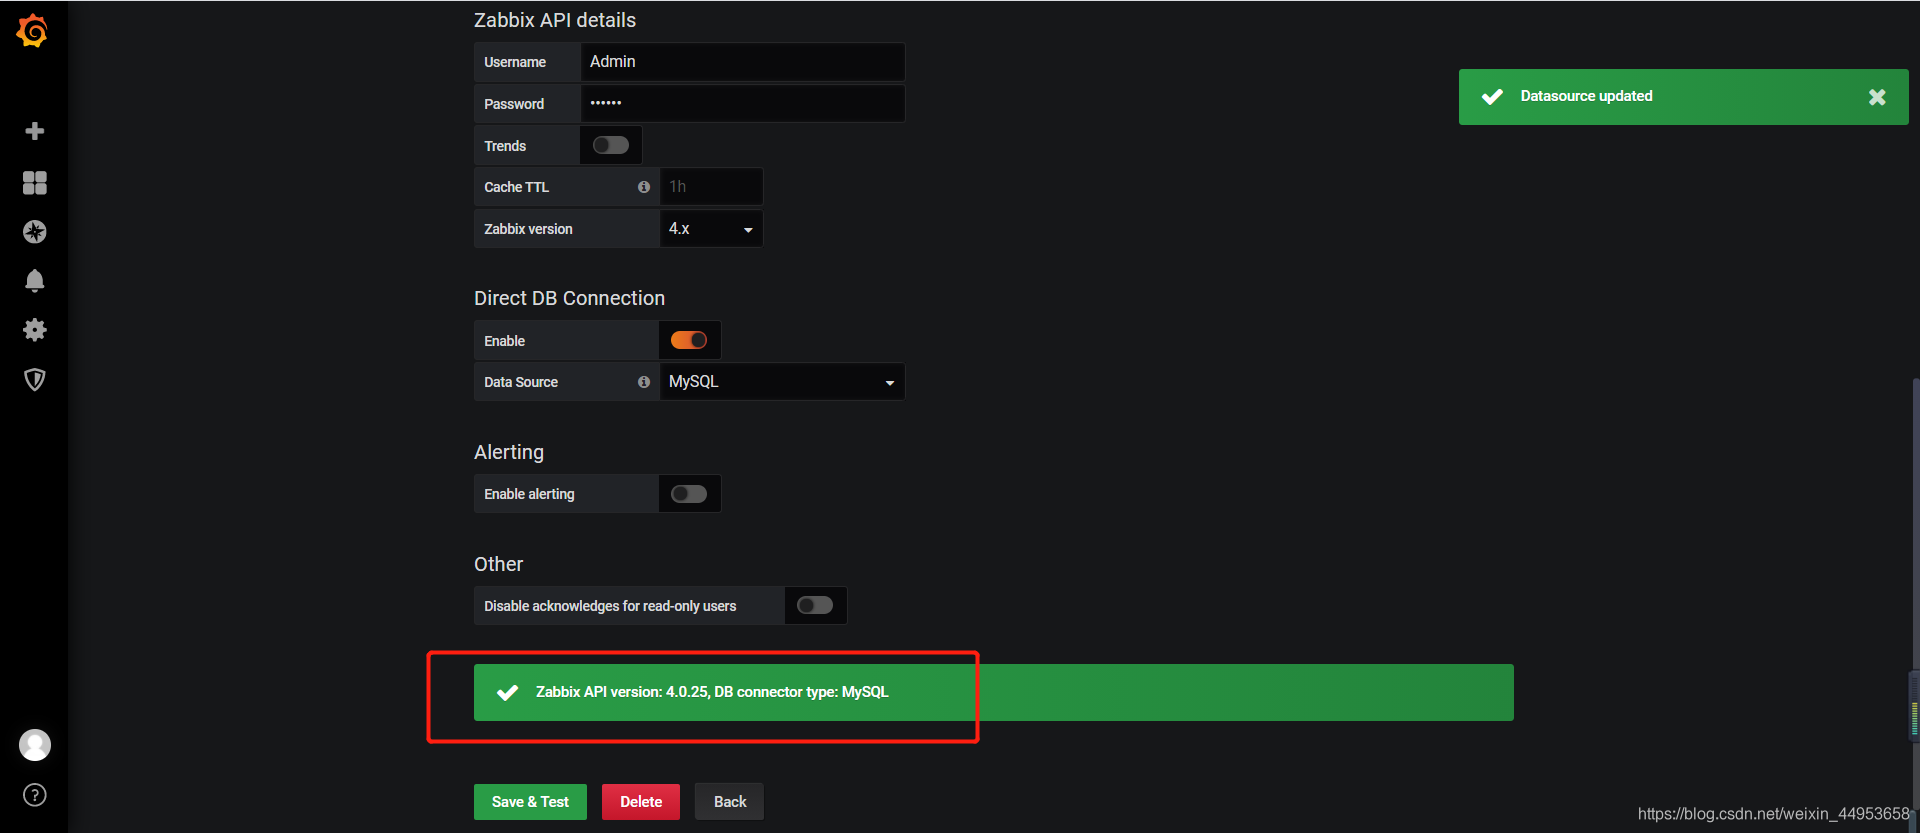
2. Configure zabbix source to connect to MySQL source
2.1. Click on the zabbix data source
2.2. Find Direct DB Connection
Click enable and select MySQL source
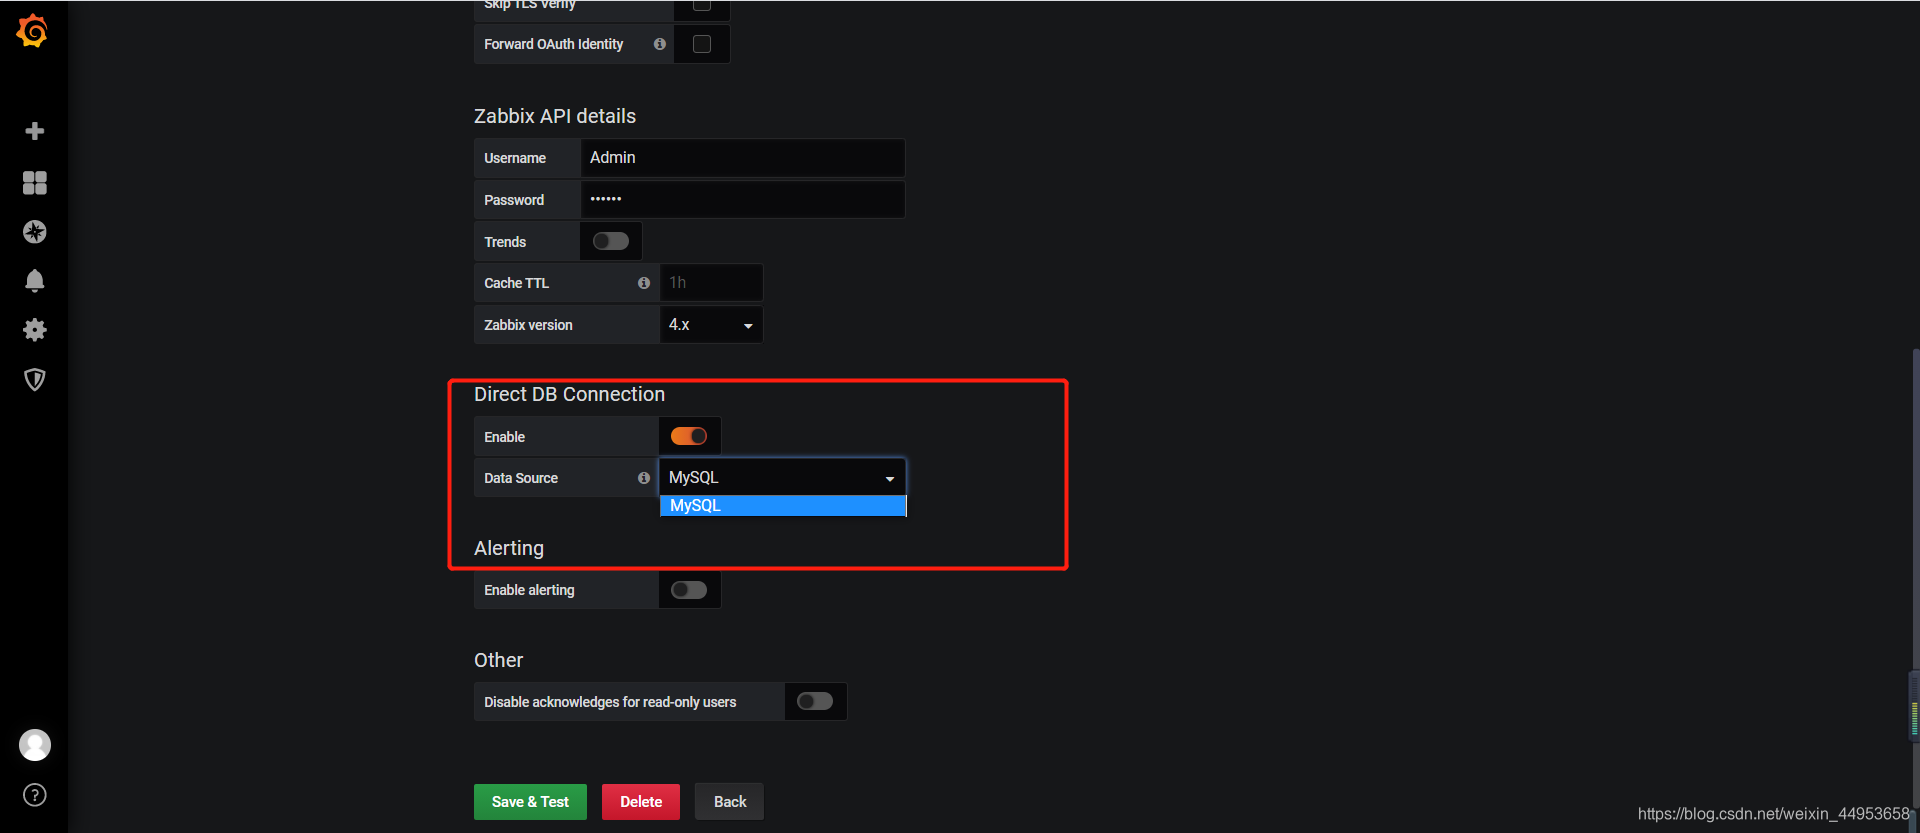
2.3. Save and test
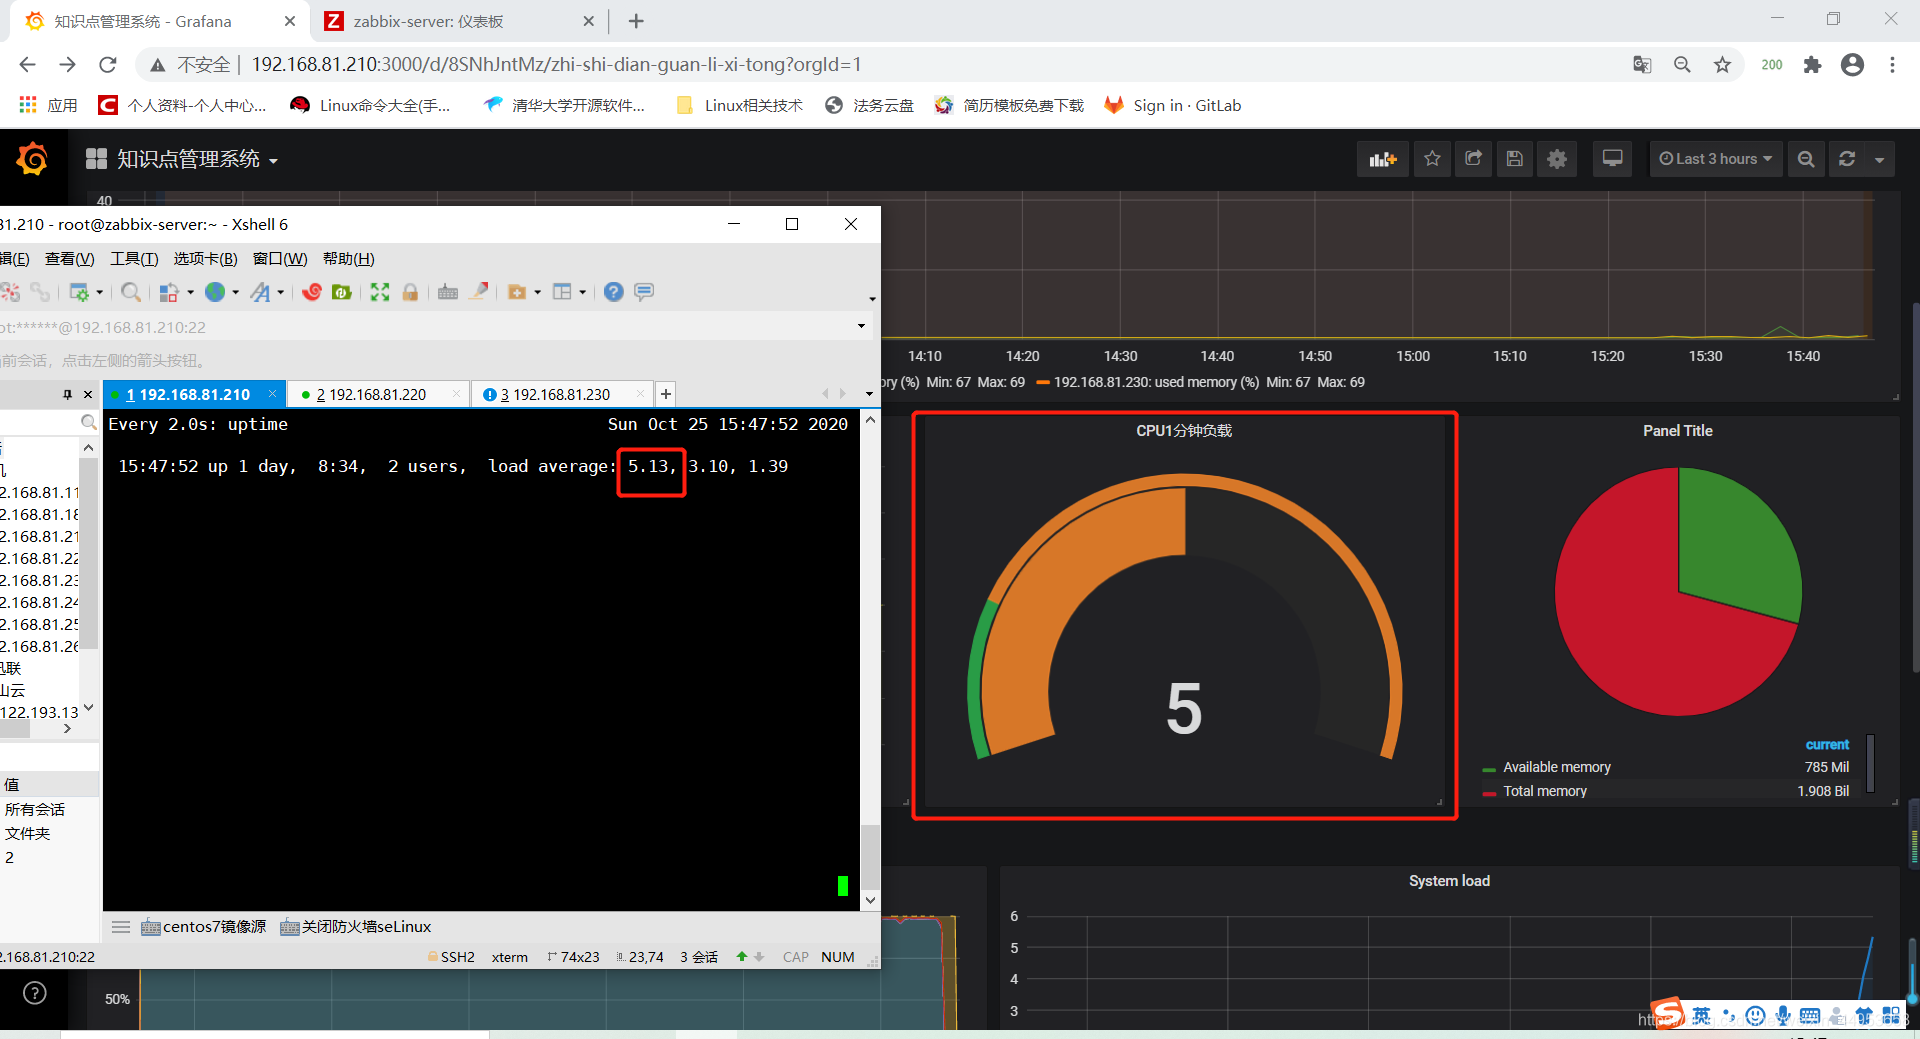
3. Test the accuracy of monitoring data
压测一下
[root@192_168_81_220 ~]# ab -n 100000 -c 3 http://192.168.81.210/zabbix/index.php
Really close