Grafana is an open source web-based data display tool, very good at doing dynamic display of time series data. As a new generation of high-performance time series database, DolphinDB database not only provides Grafana's data interface, but also Grafana's dolphindb-datasource plug-in. As long as you install dolphindb-datasource in Grafana, you can display the data of DolphinDB Table on the Web in the form of graphs, which is especially suitable for real-time performance monitoring, threshold warning and real-time data analysis in the Internet of Things.
This tutorial will introduce how Grafana connects to DolphinDB and displays DolphinDB data on the Web.
1. Install and start DolphinDB
Users can download the trial version of DolphinDB (version 0.8 and above) directly from the official website .
2. Install and start Grafana
Users can download and install Grafana directly from the Grafana official website , and start Grafana according to the official documentation. This tutorial uses Grafana 5.2.4 as an example, using Grafana's default configuration.
3. Install the dolphindb-datasource plugin
3.1 Download the plug-in source code from dolphindb/grafana-datasource .
3.2 Unzip the source code to the Grafana installation directory grafana-5.2.4/data/plugins, and change the folder name to dolphindb-datasource. Note that the data directory is automatically generated when Grafana is started.
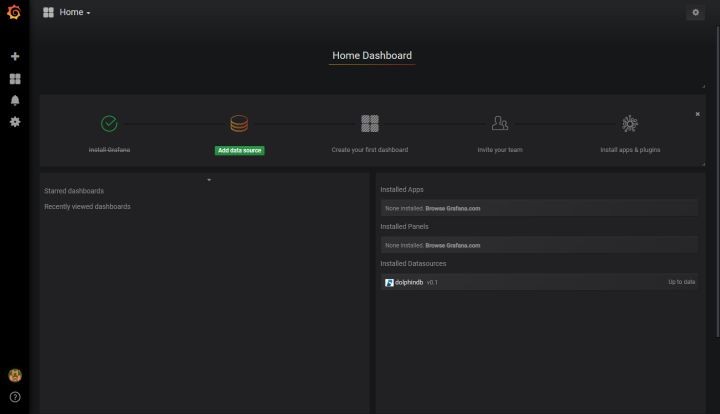
3.3 Restart Grafana. Enter http://localhost:3000 in the browser address bar to access Grafana. The initial user name and password of Grafana are both admin. After logging in, the initial interface is as follows:
4. Add dolphindb datasource
Click "Add data source" to enter the add datasource interface.
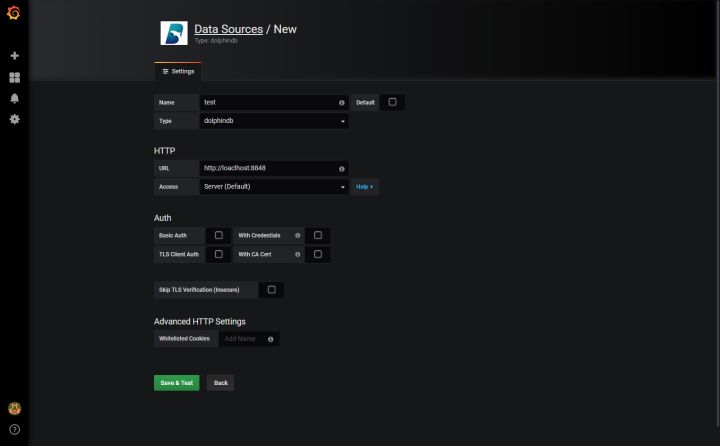
Name: The name of the datasource, this tutorial uses "test".
Type: select dolphindb
URL: Enter the address of DolphinDB datanode, example: http://localhost:8848
Use the default configuration for other options. Click "Save & Test", and the DolphinDB datasource is added successfully.
5. Data presentation
Here is an example to introduce how to display DolphinDB data in Grafana.
First, create a memory table testTable in DolphinDB, and write data to the table every 1 second for 200 seconds.
n=100000
t1=streamTable(n:0, `value`time,[DOUBLE,TIMESTAMP])
share t1 as testTable
t1=NULL
def writeData(){
	for (i in 0:200) {
		data = table(rand(35..50,1) as value,now()  as time)
		testTable.append!(data)
		sleep(1000)
	}
}
submitJob("jobId20180817001","writeDataToStreamingTable",writeData)
Click the second button on the left in Grafana to enter the following interface:
Click "New dashboard" to enter the add dashboard interface.
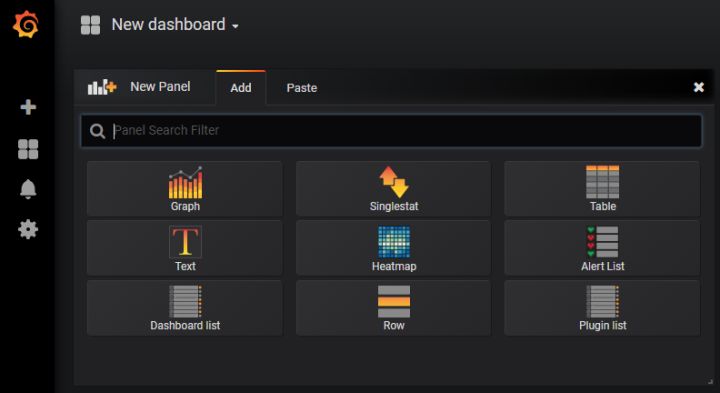
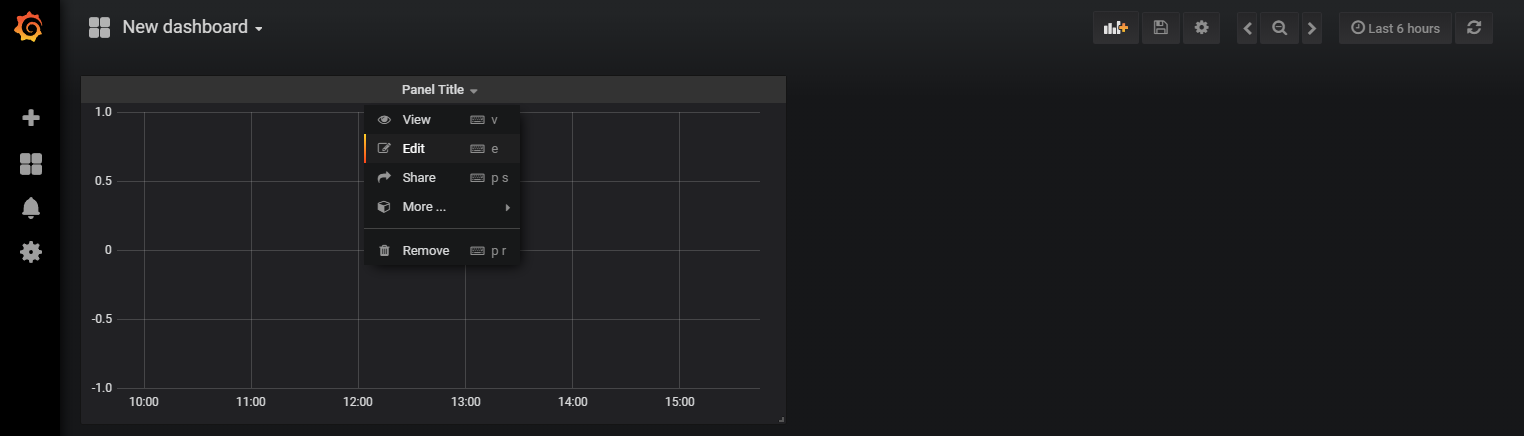
Select "Graph", click "Panel Title", and select "Edit".
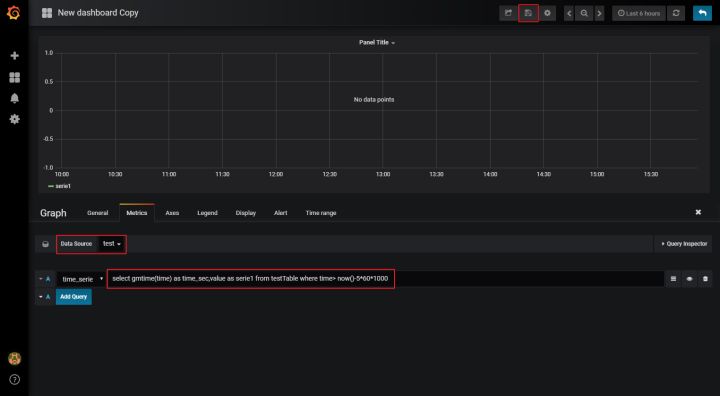
In the Metrics Tab, select "test" for Data Source, fill in the following SQL statement in Query to read the data of the previous 5 minutes, and click the save button in the upper right corner.
select gmtime(time) as time_sec,value as serie1 from testTable where time> now()-5*60*1000
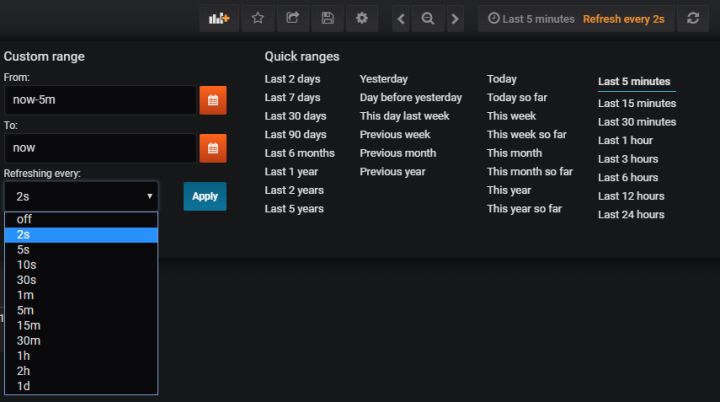
After saving, click the button in the upper right corner and select the refresh rate. This example refreshes every 2 seconds.

For more Grafana settings, please refer to Grafana official website .
Welcome to visit the official website and download the trial version of DolphinDB database