Pay attention to the official account : [ Xiao Zhang Python ], I have prepared 50+ Python fine e-books and 50G + high-quality video learning materials for you. The back-end reply keyword: 1024 can be obtained; if you have any questions about the content of the blog post, please go to the back-end of the official account Add the author [personal WeChat], you can communicate directly with the author
Hello, I’m Xiao Zhang, it’s been a long time since everyone~
Recently, I did a visual analysis of the Beijing second-hand housing data on the Lianjia platform, and got a general understanding of the current Beijing second-hand housing transaction situation, and finally came to a very tangible conclusion: you can’t buy a toilet for a lifetime. The words are not deceitful, they are true ; for specific analysis content, please see below
1. Tool description
The Python libraries used in this article are
pandas
re
requests
json
pyecharts
folium
random
stylecloud
jieba
pyquery
fake_useragent
time
Plus Baidu Map API
2. Data collection
All data from the chain of second-hand house trading platform, per arrangement 30 second-hand housing data above, we collect the first 100 pages of data, each of the second-hand housing transaction data extracted from the title, price, price, address, year, style rooms and other fields As a data source for visual analysis
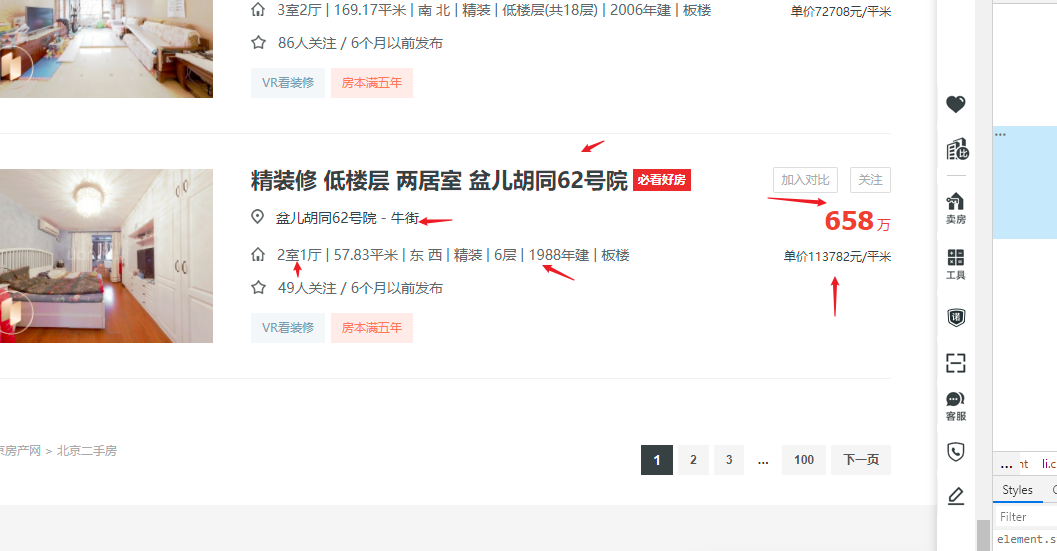
The website does not have a strong anti-crawl mechanism. The combination of requests + Cookies + PyQuery can be used when crawling. It is best to add a time.sleep() command during crawling and sleep every few seconds. The code is as follows:
import requests
from pyquery import PyQuery as pq
from fake_useragent import UserAgent
import time
import random
import pandas as pd


UA = UserAgent()
headers = {
'Accept-Language': 'zh-CN,zh;q=0.9,en;q=0.8,en-GB;q=0.7,en-US;q=0.6',
'Cookie': '你的Cookie',
'Host': 'bj.lianjia.com',
'Referer': 'https://bj.lianjia.com/ershoufang/',
'User-Agent': 'Mozilla/5.0 (Windows NT 10.0; Win64; x64) AppleWebKit/537.36 (KHTML, like Gecko) Chrome/88.0.4324.182 Safari/537.36',
}
num_page = 2
class Lianjia_Crawer:
    def __init__(self,txt_path):
        super(Lianjia_Crawer,self).__init__()
        self.file = str(txt_path)
        self.df = pd.DataFrame(columns = ['title','community','citydirct','houseinfo','dateinfo','taglist','totalprice','unitprice'])


    def run(self):
        '''启动脚本'''
        for i in range(100):
            url = "https://bj.lianjia.com/ershoufang/pg{}/".format(str(i))
            self.parse_url(url)
            time.sleep(random.randint(2,5))
            print('正在爬取的 url 为 {}'.format(url))
        print('爬取完毕!!!!!!!!!!!!!!')
        self.df.to_csv(self.file,encoding='utf-8')
    def parse_url(self,url):

        headers['User-Agent'] = UA.chrome
        res = requests.get(url, headers=headers)
        doc = pq(res.text)
        for i in doc('.clear.LOGCLICKDATA .info.clear'):
            try:
                pq_i = pq(i)
                title = pq_i('.title').text().replace('必看好房', '')
                Community = pq_i('.flood .positionInfo a').text()

                HouseInfo = pq_i('.address .houseInfo').text()
                DateInfo = pq_i('.followInfo').text()
                TagList = pq_i('.tag').text()
                TotalPrice = pq_i('.priceInfo .totalPrice').text()
                UnitPrice = pq_i('.priceInfo .unitPrice').text()
                CityDirct = str(Community).split(' ')[-1]
                Community = str(Community).split(' ')[0]
                data_dict ={
                    'title':title,
                               'community':Community,
                               'citydirct':CityDirct,
                               'houseinfo':HouseInfo,
                               'dateinfo':DateInfo,
                               'taglist':TagList,
                               'totalprice':TotalPrice,
                    'unitprice':UnitPrice
                }
                print(Community,CityDirct)
                self.df = self.df.append(data_dict,ignore_index=True)
                #self.file.write(','.join([title, Community, CityDirct, HouseInfo, DateInfo, TagList, TotalPrice, UnitPrice]))
                print([title, Community, CityDirct, HouseInfo, DateInfo, TagList, TotalPrice, UnitPrice])
            except Exception as e:
                print(e)
                print("索引提取失败,请重试!!!!!!!!!!!!!")


if __name__ =="__main__":
    txt_path = "ershoufang_lianjia.csv"
    Crawer = Lianjia_Crawer(txt_path)
    Crawer.run() # 启动爬虫脚本
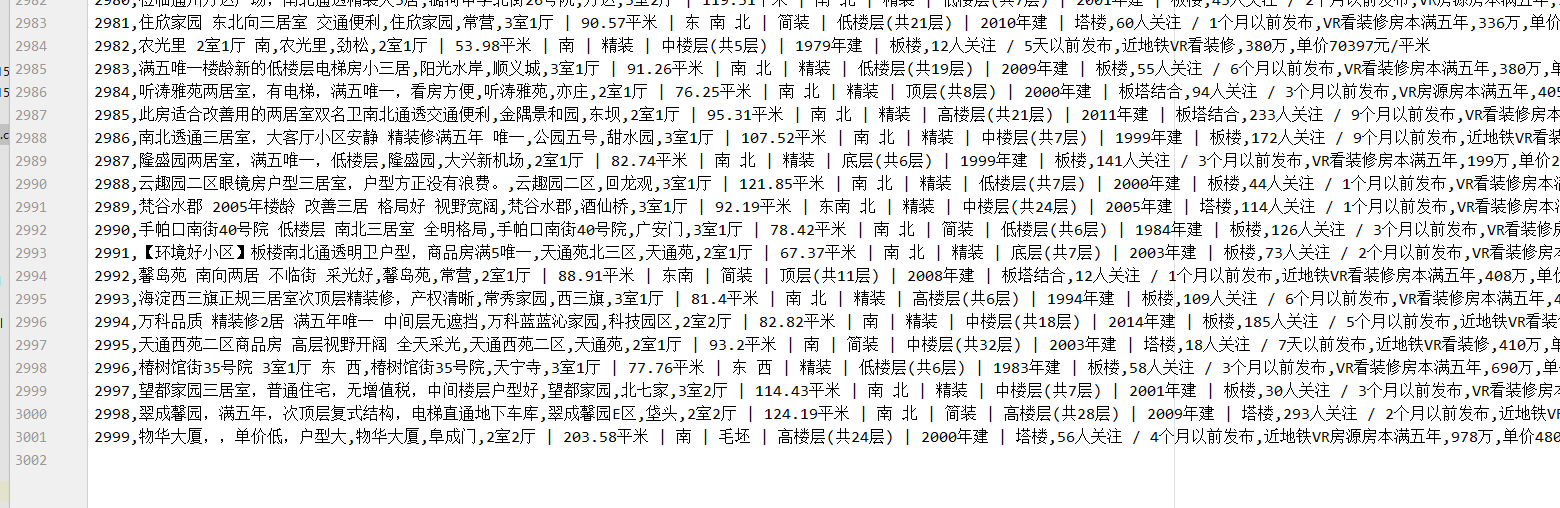
In the end, a total of 3000 pieces of data were collected:
3. Address latitude and longitude coordinate conversion
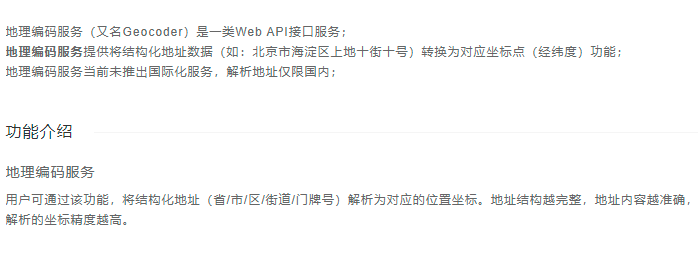
The obtained data is that the address is in the form of a string (for example 梵谷水郡*酒仙桥), the latitude and longitude data is needed when the map location is marked later, and all addresses need to be converted into latitude and longitude coordinates. This step is done with the help of Baidu Map API.
3.1 Baidu Map AK Application
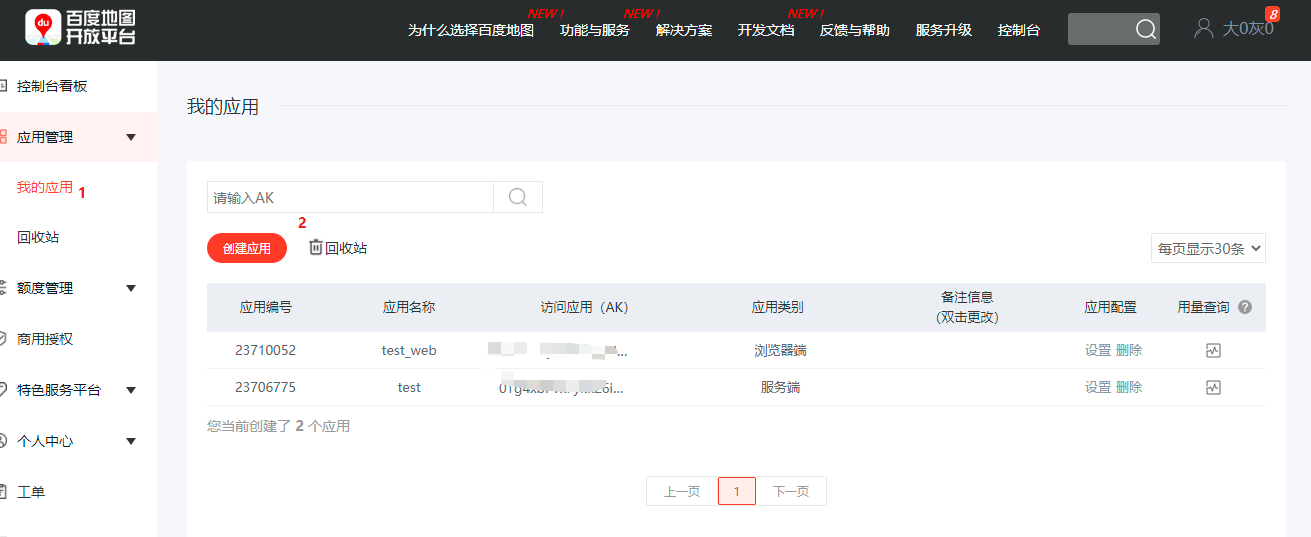
Use the API need to 百度地图开放平台apply for a AK-tested code, URL: https: //lbsyun.baidu.com/apiconsole/center#/home, log in to your Baidu account, create a console application,
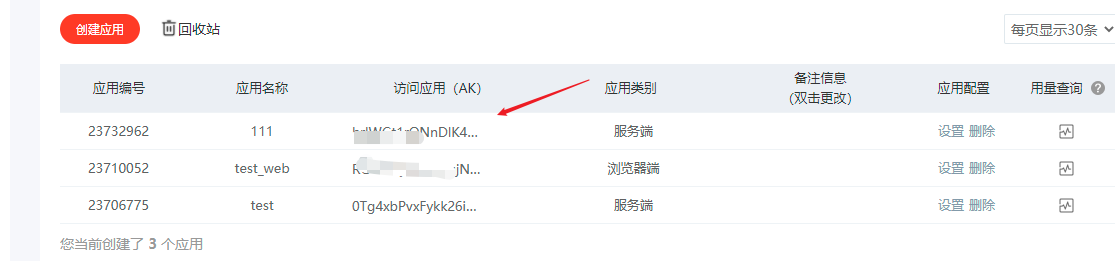
Console Panel -> My Application -> Create Application
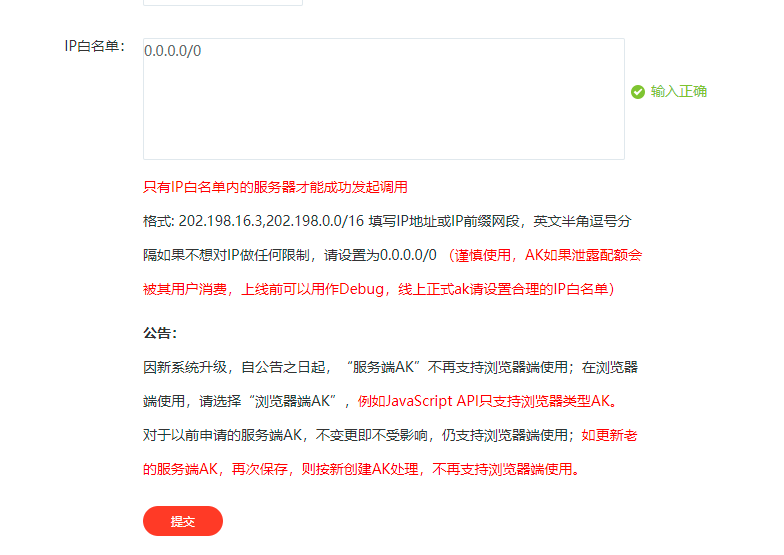
Other parameters are the default, the application name can be customized, the IP whitelist is filled in 0.0.0.0/0, and click submit
After the above steps are completed, there will be an additional application in the console panel, which we just created.
3.2 Address latitude and longitude coordinate conversion
After obtaining your AK parameters, pass AK and address (Chinese address) as parameters to the following function to obtain the corresponding latitude and longitude coordinates
def get_location(address,AK):
    #根据地址转化为经纬度
    try:
        url = 'http://api.map.baidu.com/geocoding/v3/?address={}&output=json&ak={}&callback=showLocation'.format(address,AK)
        res_test = requests.get(url).text
        res = re.search('\((.*?)\)', res_test).group(0).strip('(').strip(')')
        lng = json.loads(res)['result']['location']['lng']
        lat = json.loads(res)['result']['location']['lat']
        print(lng, lat)
        return lng, lat
    except Exception as e:
        print('error ---------\n')
        return None
Baidu Maps API address latitude and longitude conversion function orientation is not limited to provinces, municipalities, can locate the house number, address as long as you provide the more detailed, more accurate latitude and longitude information obtained
4. Visual analysis
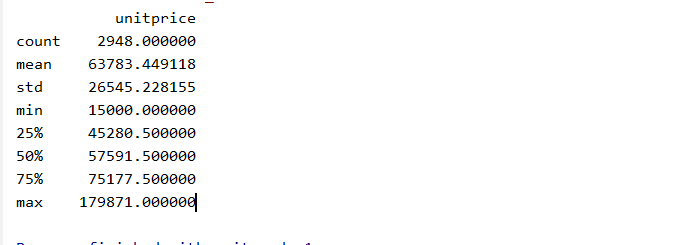
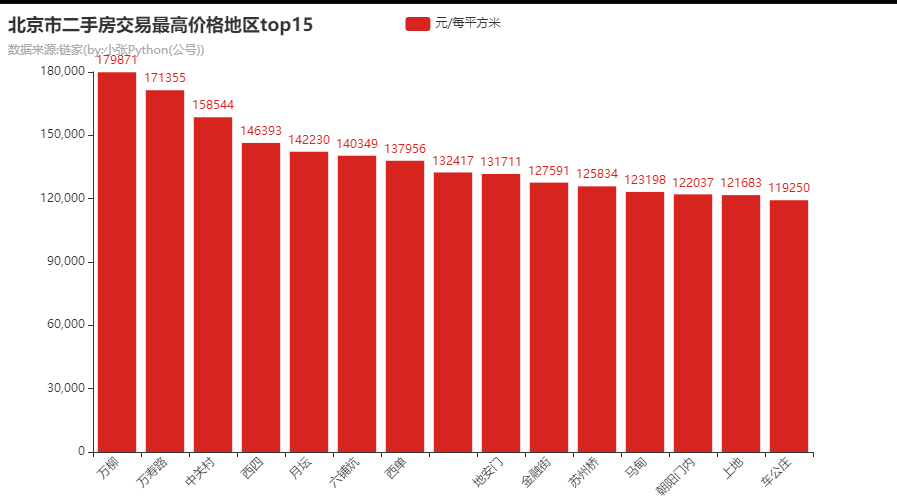
This part enters the content of visual analysis. Is the city Beijing after all, so the first thing is to pay attention to the housing price problem. Among the data captured, the highest is nearly 190,000+/per square, and the lowest is only 15,000/per square.
I see that 15,000 per square meter is not calm, this data must be tricky (Beijing house prices cannot be so low by common sense); in order to verify the idea, first mark the real estate location (Longitude and latitude map mark with the help of Baidu map address related Demo)
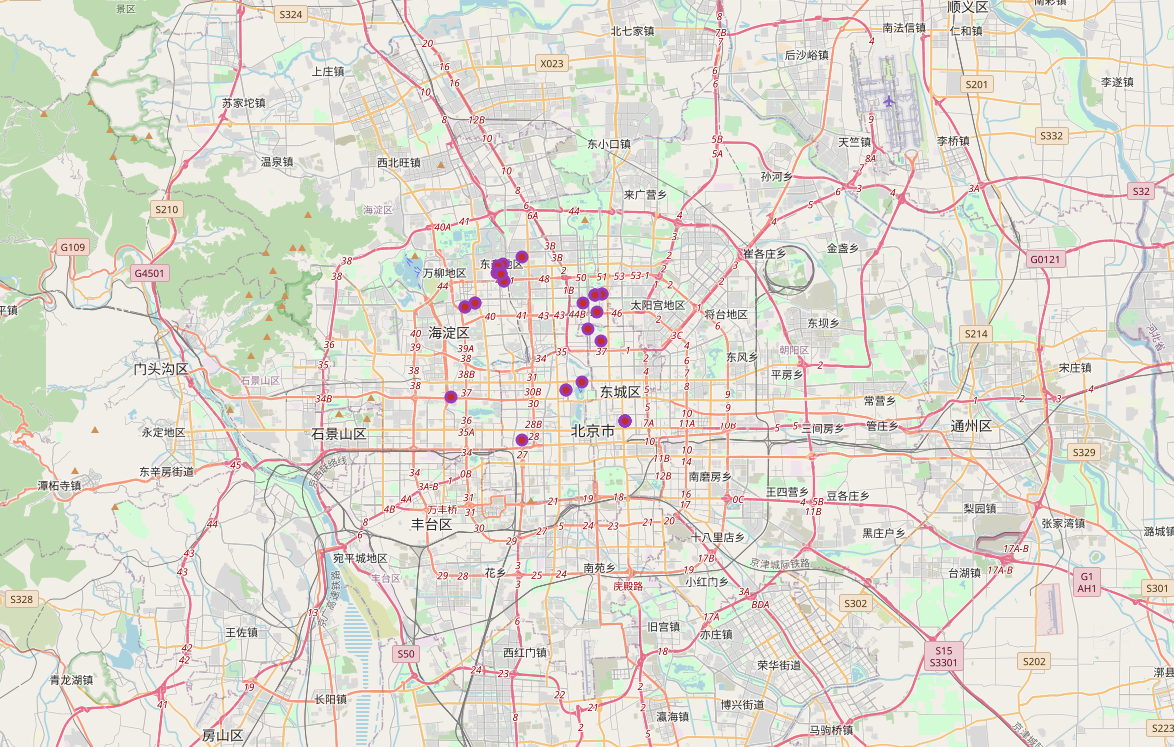
Let's take a look at the top ten:
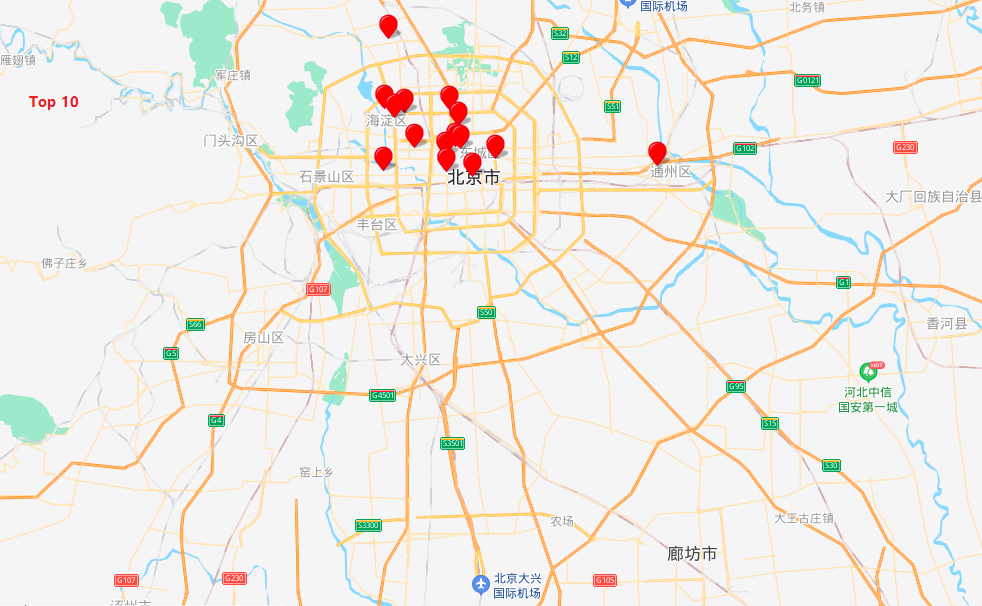
The above is the location of the top 10 areas with the highest house prices. It seems that the geographical location is not bad. They are all within the third and fourth ring roads and are located in the vicinity of the city center. If you only look at the map of this map, you can't get useful information. You can compare Top 10 with the lowest house price
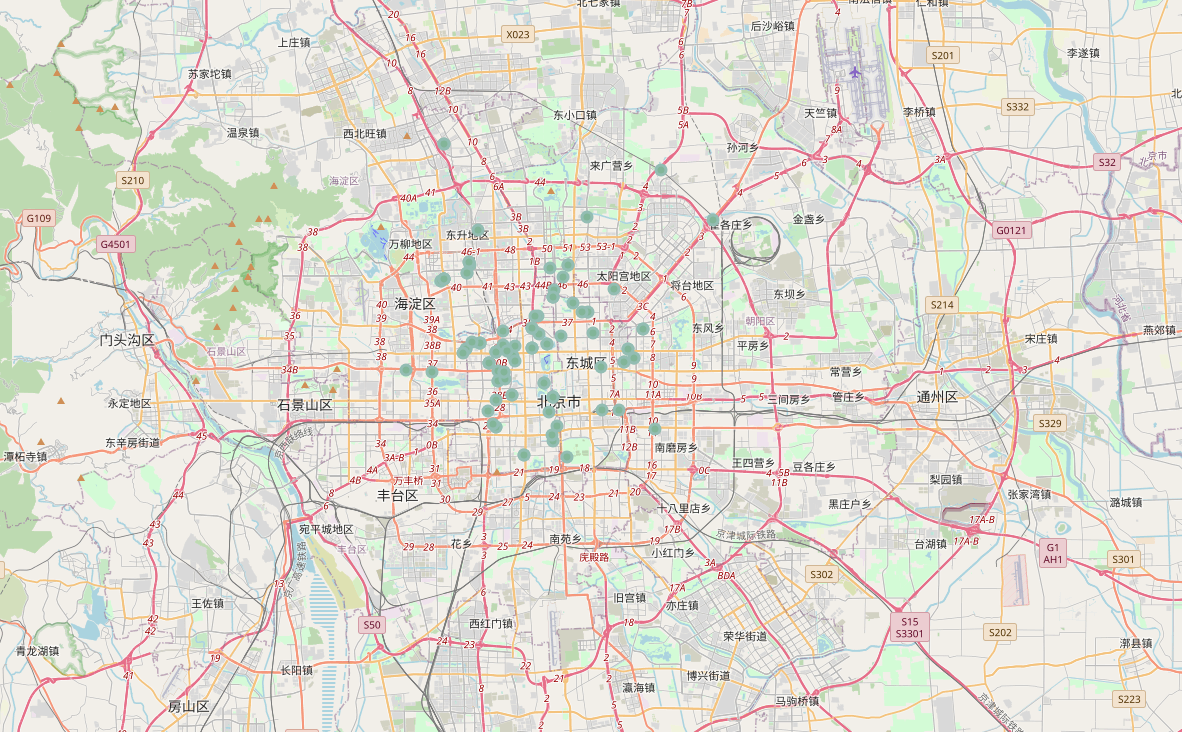
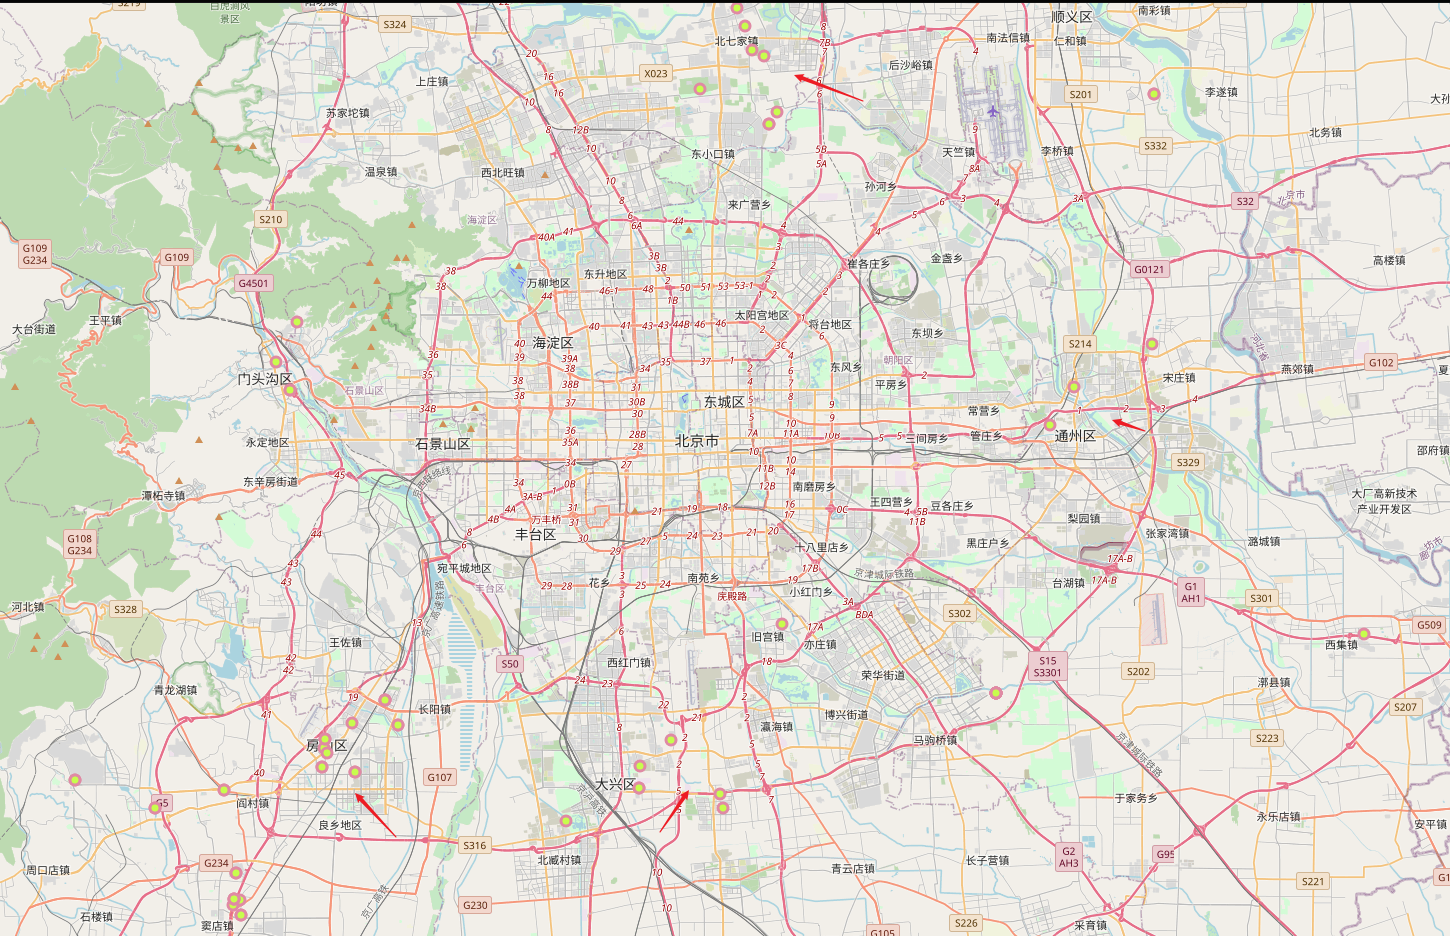
Here are the bottom ten
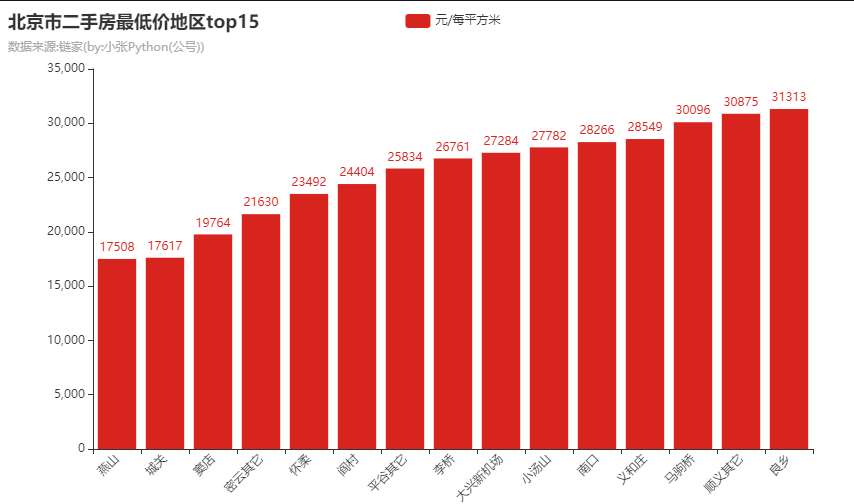
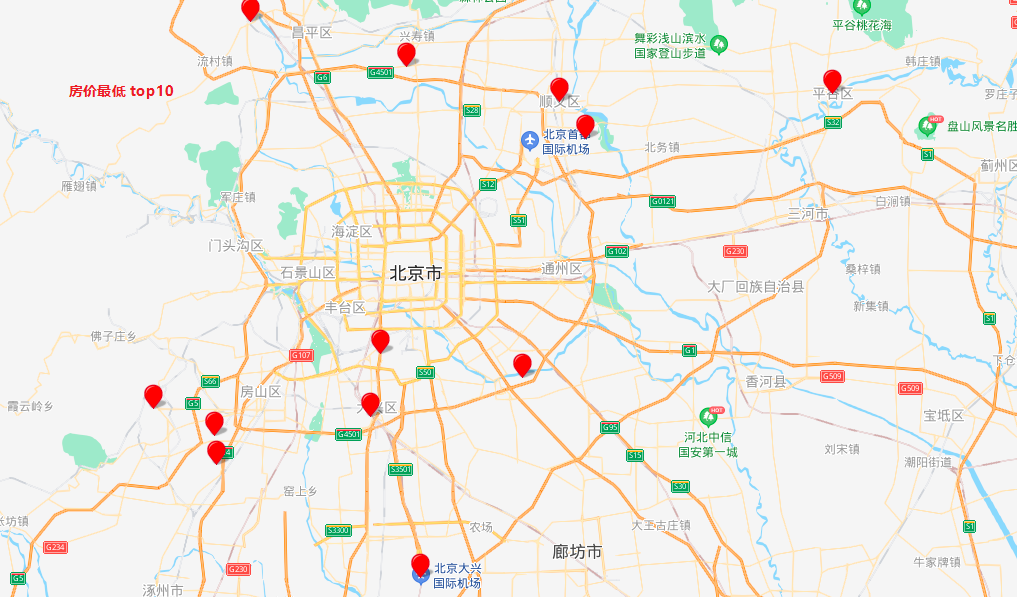
Top ten lots distributed after Beijing ranked second-hand housing prices, prices ranging from 15 000 -3 million in, did not see this before just think the price is above map marked seller wrong, the seller after the discovery after reading this chart is hanging Sheep's head sells dog meat , with the name of Beijing, and sells houses outside Beijing (some houses are already located in Hebei). This may be one of the routines of selling houses.
If something goes wrong, there must be a monster . Whether buying a house or buying other goods, the seller will not give us a discount for no reason. When the price is far below the market price, the transaction needs to be cautious, cautious, and cautious!
Rate I is divided into five sections, namely 0-3万、3-8万、8-12万、12-15万,15万+five sections, look at their share of distribution
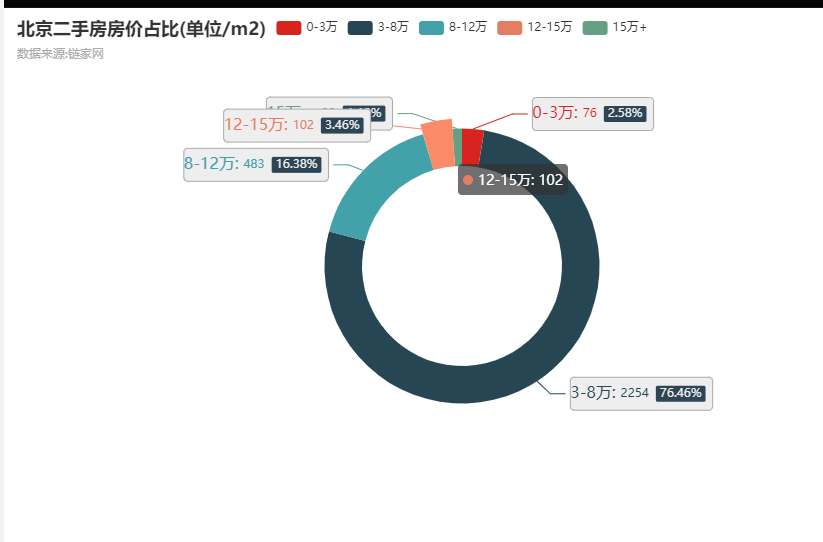
Among them, house prices between 30,000 and 80,000 accounted for the largest share of 76%, followed by 80,000 to 120,000, and 120,000 to 150,000, which accounted for 16.38% and 3.46% in turn, while the housing price of 150,000+ accounted for the least, only About 1.12%;
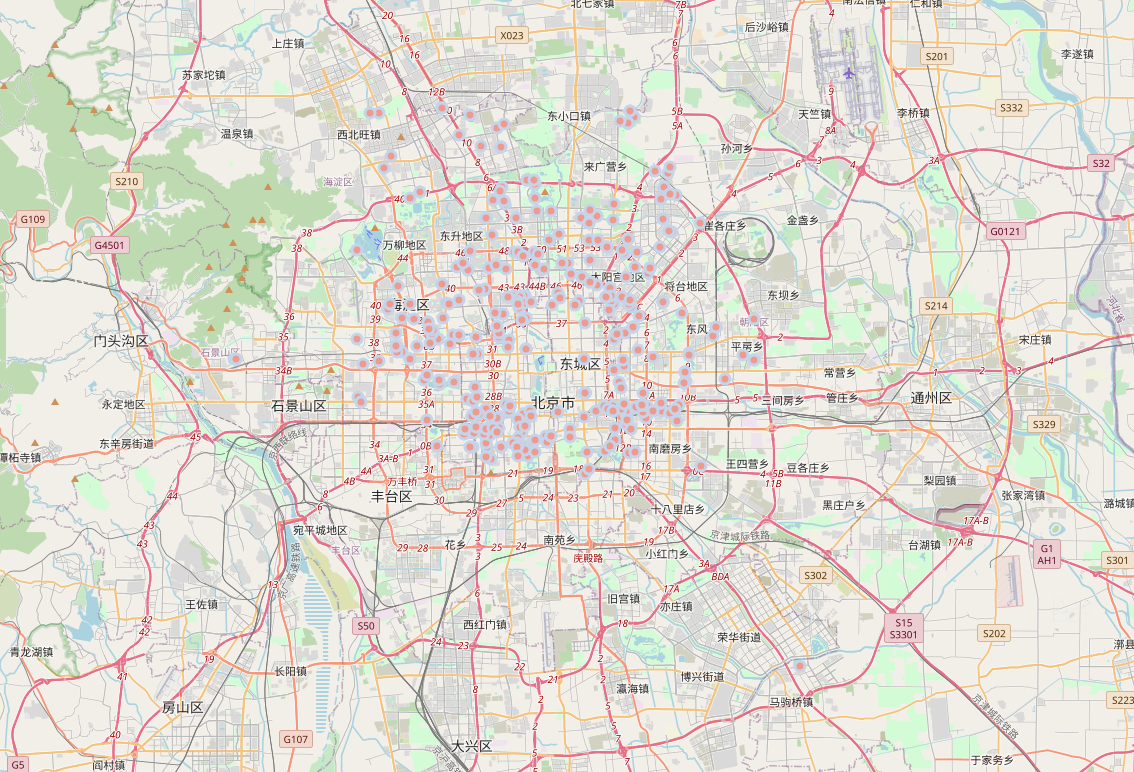
Next, let’s take a look at the distribution of second-hand houses at different prices in Beijing.
150,000+
12-15 million
8-12 million
30,000-80,000
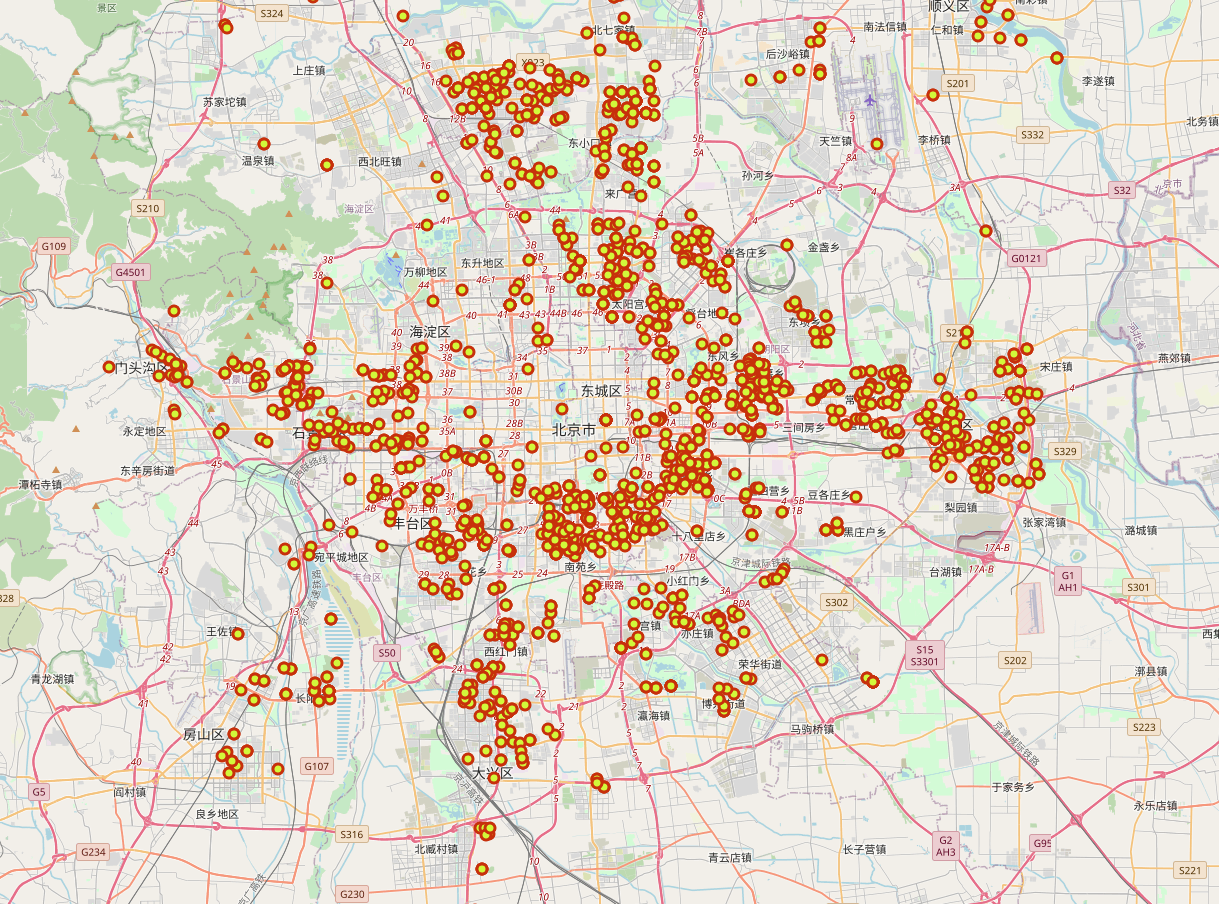
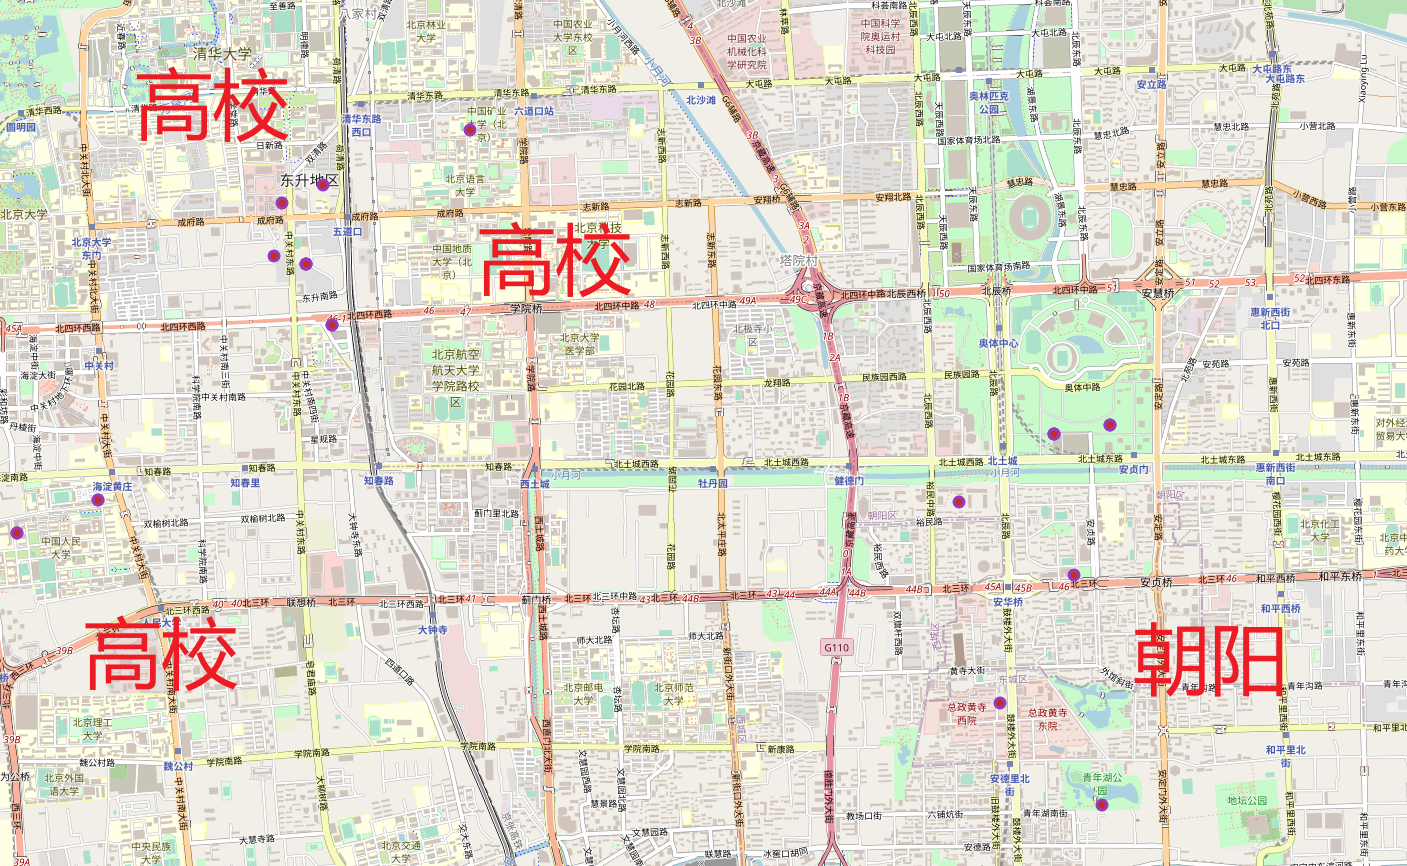
From the perspective of location distribution, Beijing’s housing price is 80,000 as a watershed, and the distribution of properties within 80,000+ and 80,000 has changed significantly. The higher the price, the closer to the city center; from the map information, I want to buy a good location in Beijing house, is expected to have the lowest prices in 80,000 + 80,000 What is the concept, also said that if you want to buy a 50-square-meter house in Beijing, the minimum should be 4 million!
About 150,000+ real estate, there are roughly two areas, one is the university area (surrounded by the People’s University, Beihang University, Tsinghua University and other universities), and the other is located in the lower right corner, which is Beijing’s Chaoyang District
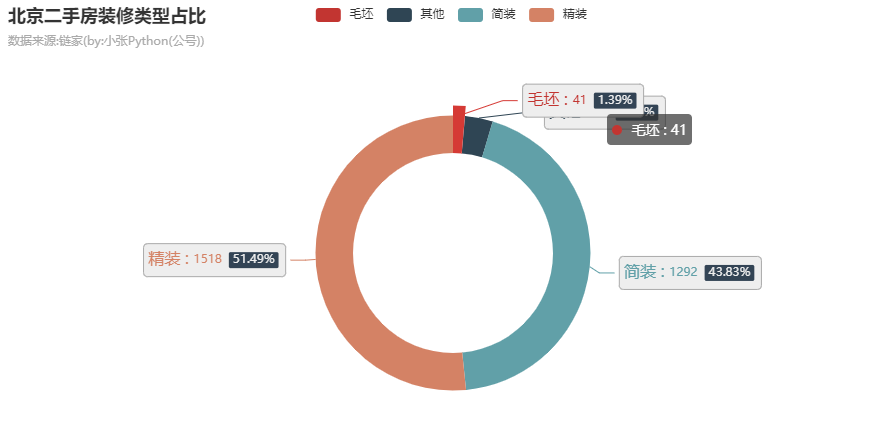
The second-hand houses sold in Beijing are not necessarily renovated, they may be rough (after the construction and delivery, no decoration has been carried out); referring to the figure below, the second-hand houses in Beijing accounted for about 1.39% of the rough, 41 units, which were bought by the householder These houses are likely to be used for asset appreciation rather than as rigid needs;
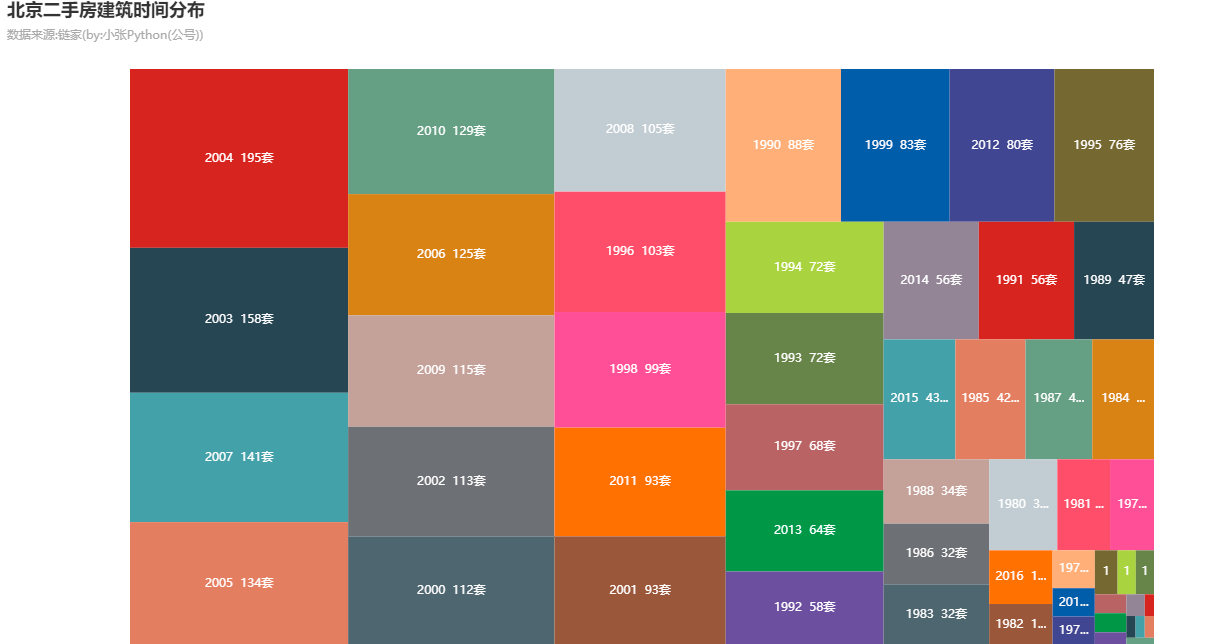
Take a look at the time distribution of second-hand housing construction in Beijing with the help of the Treemap chart. Most of them are concentrated in the nine years from 2002 to 2010. Beijing real estate also developed rapidly during this period. After 2015, it significantly slowed down, due to the fact that the construction area has reached Saturation coupled with pressure from relevant national policies
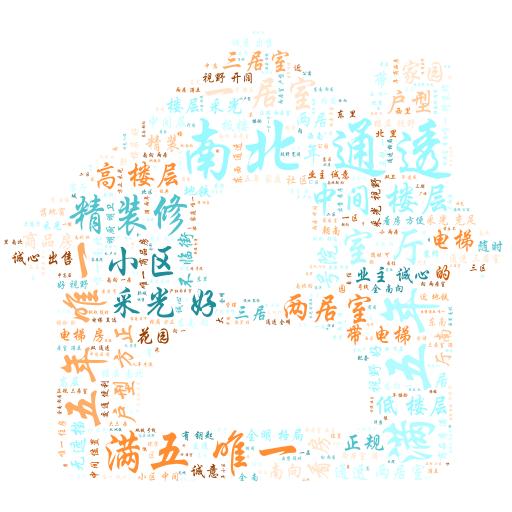
Zhang posted last word cloud as the end of this article, select a text message to 3000 real estate title information from the graph view, the title of high-frequency words have South transparent, high floor, refined decoration, good lighting , etc., it can be said These characteristics are also the biggest selling points of most listings (disregarding factors such as price, location, etc.)
5. Small summary
The analysis angle of Beijing second-hand housing in this article is not comprehensive. It only makes a simple analysis around several dimensions such as housing price, location, construction year, etc. The analysis results are for learning only, and the authenticity of the data is investigated.
Okay, the above is the whole content of this article. Finally, thank you all for reading. See you in the next issue~
6, source code acquisition
Regarding all the source code and data acquisition methods involved in this article, please go to the WeChat public account : Xiao Zhang Python and reply with the keyword 210303 in the background ~