table of Contents
Pandas handles missing data NaN
pandas combined with plot drawing
pandas series and dataFrame
The relationship between pandas and numpy: numpy is a list, pandas is a dictionary, and pandas is built on numpy.
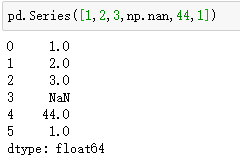
The form of Series: the index is on the left and the value is on the right. If no index is specified for the data, an integer index from 0 to N-1 (N is the length) is automatically created.
DataFrame is a tabular data structure, each column can be a different value type, both row index and column index.

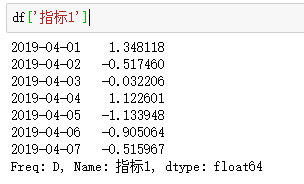
Take the "indicator 1" column of df: df['indicator 1']
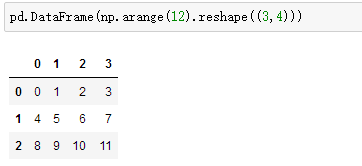
Create a set of data without a given row label and column label: pd.DataFrame(np.arange(12).reshape((3,4)))
Create data with special treatment for each column of data:

View data type: df.dtypes
View the serial number of the index (row): df.index
View the name of each data (column): df.columns
View all values of df: df.values
View the summary of the data (count, average, maximum value, etc.): df.describe()

Flip data: df.T
Sort the index of the data : df.sort_index(axis=1, ascending=False)
Sort the values of the data : df.sort_values(by='A')
pandas select data
Select a column A: df['A'] or df.A
Choose from 0 to 2 more columns: df[0:2]
Select 1 row according to the label : df.loc[0] [Select the row with index 0]
Select all rows (: means all rows): df.loc[:,['A','B']] [Select columns A and B of all rows]
df.loc[3,['A','B']] [Select two columns A and B in row 3]
Select data according to location (index) : df.iloc[3,1] [data in row 3 and column 1]
df.iloc[2:3,0:3] [Data in rows 2 to 3, columns 0 to 3]
df.iloc[[0,3],0:3] [Data in rows 0 and 3, columns 0 to 3]
Filter by judgment: df[df.A==2] [Select the row whose column A is 2]
pandas setting value
Use index: df.iloc[2,2] = 1111 [Modify the second row, the second column]
Use label: df.loc['20190401','B'] = 2222 [Modify row '20190401', column'B']
According to the condition: df.B[df.A>4] = 0 [If column A is greater than 4, change it to 0]
By row or column: df['F'] = np.nan [Add a new column F, and set the value to NaN]
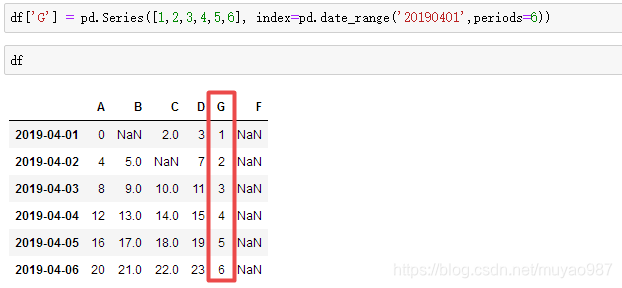
df_original['title_keywords'] = ['' for _ in range(content_num)]Add data: df['G'] = pd.Series([1,2,3,4,5,6], index=pd.date_range('20190401',periods=6))
Pandas handles missing data NaN
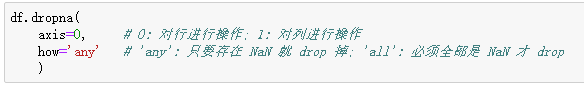
Directly remove rows or columns with NaN (pd.dropna()):
Replace the value of NaN with other values (pd.fillna()): df.fillna(value=0) [Replace all with 0]
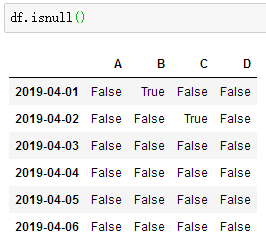
Determine whether each value is missing data: df.isnull()
Check whether there is NaN in the entire data table, and return True if it exists: np.any(df.isnull()) == True
pandas import and export
Formats that pandas can read and access: csv, excel, json, html, pickle, etc. [ official document ]
Read csv: data = pd.read_csv('student.csv')
Access data into pickle: data.to_pickle('student.pickle')
pandas data merge
Concat vertical merge: res = pd.concat([df1, df2, df3], axis=0) [It can be found that the index has not changed]

Ignore_index (reset index) of concat parameter: res = pd.concat([df1, df2, df3], axis=0, ignore_index=True )
The join of the concat parameter (combination method, default join='outer'): res = pd.concat([df1, df2], axis=0, join='outer') [Vertical merge according to column, with the same column The top and bottom are merged together, and the other independent columns form their own columns, and the original positions without values are filled with NaN. 】
The join of the concat parameter (the merge method is changed to join='inner'): res = pd.concat([df1, df2], axis=0, join='inner') [Only the same columns are merged together, the others Will be abandoned]
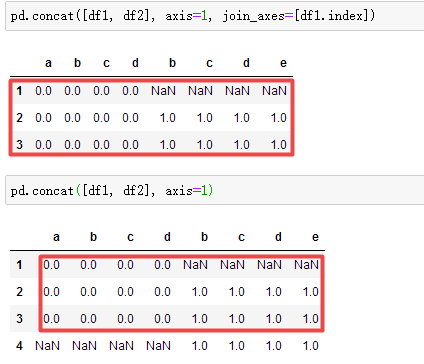
The join_axes of the concat parameter: [join according to the row index of df1, the following figure 2 removes join_axes]
Append has only vertical merging, not horizontal merging:
df1.append(df2, ignore_index=True) [Merge df2 under df1, reset index]
df1.append([df2, df3], ignore_index=True) [Merge multiple dfs, merge df2 and df3 under df1, reset index]
df1.append(s1, ignore_index=True) [Merge series, merge s1 to df1, reset index]
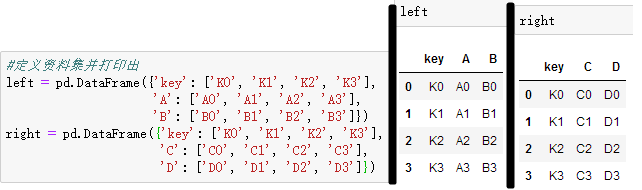
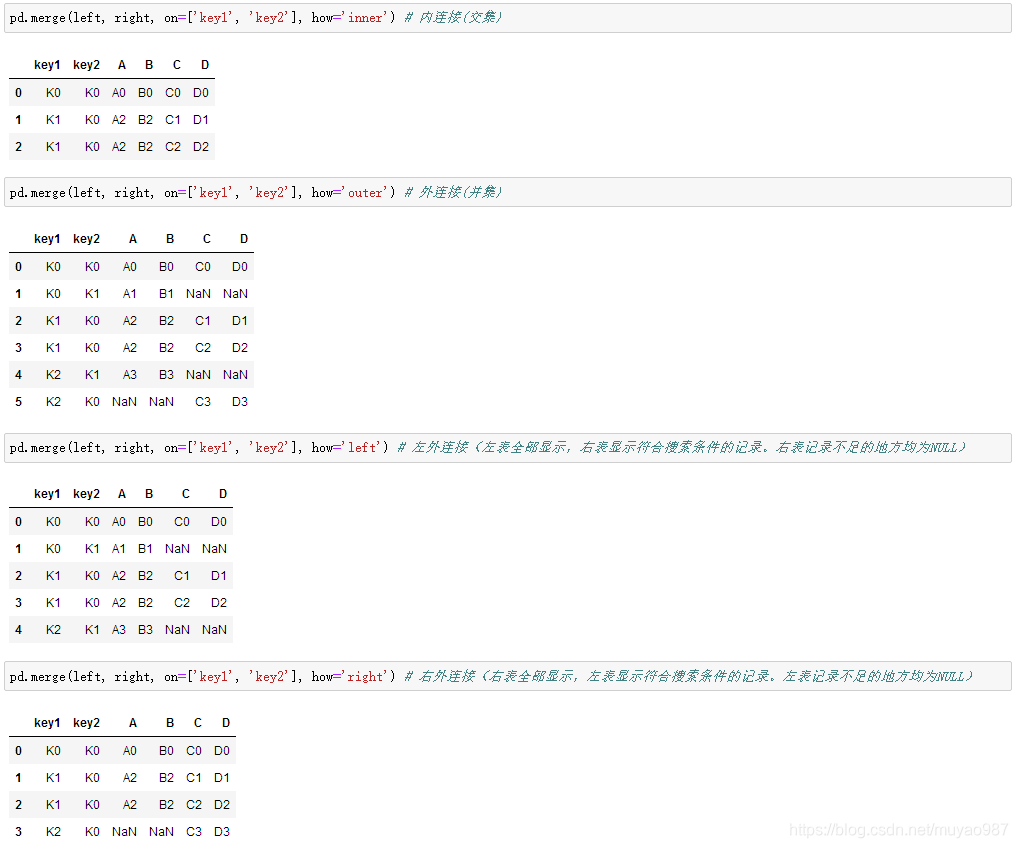
Merge is used for two groups of data with key column [Sample data is as follows]
Combine key1 and key2 columns and print out four results ['left','right','outer','inner']:
The indicator=True of the merge parameter will put the merged record in a new column
The indicator=str of the merge parameter, custom column name

根据index合并:res = pd.merge(left, right, left_index=True, right_index=True, how='outer')
The suffixes of the merge parameter solves the problem of overlapping (overlapping) [the name K0 has a 1-year-old male, a 4-year-old female, and a 5-year-old female]

pandas combined with plot drawing
import matplotlib.pyplot as plt
Randomly generate 1000 data, the default index of Series is an integer starting from 0

Generate a 1000*4 DataFrame and accumulate them

The scatter chart has only two attributes, x and y, so we can specify data for x and y respectively [line1 in the figure below]
Draw another one on the same ax, select different data columns, different colors and labels [line2 in the figure below]
Display picture [line3 below]

END