The Data
This section describes how to load data on Orange. We will also show how to explore data, discover some basic statistical characteristics, and how to sample data.
Data Input
Orange can read files in the native tab-delimited format, and can also load data from any major standard spreadsheet file type, such as CSV and Excel. This machine’s tab-separated file format usually has the feature name (or column name) in the first line; the attribute type in the second line, which can be continuous, discrete, time, or string; the third line contains some Meta information is used to identify dependent characteristics (classes), irrelevant characteristics (ignored) or meta characteristics (meta). Look at the following data:
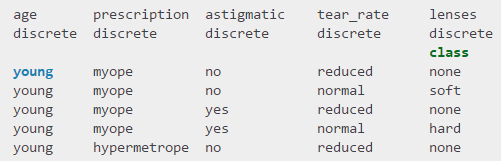
This data set has four attributes (patient age, glasses prescription, astigmatism concept, tear production rate information) and three values about the patient's prescription information encoding (hard contact lens, soft contact lens, no lens)
import Orange

data = Orange.data.Table('lenses')

print(data.domain.attributes)
print(data.domain.class_var)

for d in data[:3]:
    print(d)
Advanced output display:
import Orange
data = Orange.data.Table("lenses")
print("Attributes:", ", ".join(x.name for x in data.domain.attributes))
print("Class:", data.domain.class_var.name)
print("Data instances", len(data))

target = "soft"
print("Data instances with %s prescriptions:" % target)
atts = data.domain.attributes
for d in data:
    if d.get_class() == target:
        print(" ".join(["%14s" % str(d[a]) for a in atts]))
Saving the Data
import Orange
data = Orange.data.Table("lenses")
myope_subset = [d for d in data if d["prescription"] == "myope"]
new_data = Orange.data.Table(data.domain, myope_subset)
new_data.save("lenses-subset.tab")
Exploration of the Data Domain
Explore the data and count the number of discrete and continuous features.
import Orange

data = Orange.data.Table("imports-85.tab")
n = len(data.domain.attributes)
n_cont = sum(1 for a in data.domain.attributes if a.is_continuous)
n_disc = sum(1 for a in data.domain.attributes if a.is_discrete)
print("%d attributes: %d continuous, %d discrete" % (n, n_cont, n_disc))

print("First three attributes:",
      ", ".join(data.domain.attributes[i].name for i in range(3)))

print("Class:", data.domain.class_var.name)
Orange objects can be retrieved and accessed by feature names, just like Python columns and dictionaries.
print("First attribute:", data.domain[0].name)
name = "fuel-type"
print("Values of attribute '%s': %s" %
      (name, ", ".join(data.domain[name].values)))
Data Instances
The data table stores data instances. It can be indexed and traversed like a Python list, and the data instance can be treated as a vector and accessed by element index or feature name. For iris data
import Orange

data = Orange.data.Table("iris")
print("First three data instances:")
for d in data[:3]:
    print(d)

print("25-th data instance:")
print(data[24])

name = "sepal width"
print("Value of '%s' for the first instance:" % name, data[0][name])
print("The 3rd value of the 25th data instance:", data[24][2])


average = lambda x: sum(x)/len(x)

print("%-15s %s" % ("Feature", "Mean"))
for x in data.domain.attributes:
    print("%-15s %.2f" % (x.name, average([d[x] for d in data])))


average1 = lambda xs: sum(xs)/float(len(xs))

targets = data.domain.class_var.values
print("%-15s %s" % ("Feature", " ".join("%15s" % c for c in targets)))
for a in data.domain.attributes:
    dist = ["%15.2f" % average1([d[a] for d in data if d.get_class() == c])
            for c in targets]
    print("%-15s" % a.name, " ".join(dist))
Code for fast calculation of class distribution:
import Orange
from collections import Counter

data = Orange.data.Table("lenses")
print(Counter(str(d.get_class()) for d in data))
Orange Datasets and NumPy
import orange
import numpy as np

data = Orange.data.Table("iris")

print(data.X[:3])
print(data.Y[:3])

mean = np.mean(data.X,axis=0)
print(mean)


#numpy数组转成dataset
X = np.array([[1,2],[4,5]])
data = Orange.data.Table(X)
print(data.domain)

#设置有意义的名字
domain = Orange.data.Domain([Orange.data.ContinuousVariable("lenght"),
                                 Orange.data.ContinuousVariable("width")])
data = Orange.data.Table(domain, X)
print(data.domain)
another example:
size = Orange.data.DiscreteVariable("size", ["small", "big"])
height = Orange.data.ContinuousVariable("height")
shape = Orange.data.DiscreteVariable("shape", ["circle", "square", "oval"])
speed = Orange.data.ContinuousVariable("speed")

domain = Orange.data.Domain([size, height, shape], speed)

X = np.array([[1, 3.4, 0], [0, 2.7, 2], [1, 1.4, 1]])
Y = np.array([42.0, 52.2, 13.4])

data = Orange.data.Table(domain, X, Y)
print(data)
Missing Values
import numpy as np

data = Orange.data.Table('voting.tab')

print(data[2])

#查看是否缺失
print(np.isnan(data[2][0]))
print(np.isnan(data[2][1]))

#统计缺失率
for x in data.domain.attributes:
    n_miss = sum(1 for d in data if np.isnan(d[x]))
    print("%4.1f%% %s" % (100.*n_miss/len(data), x.name))

#至少缺失一个值统计
print(sum(any(np.isnan(d[x]) for x in data.domain.attributes) for d in data))
Data Selection and Sampling
data = Orange.data.Table("iris.tab")
print("Dataset instances:", len(data))
subset = Orange.data.Table(data.domain,
                           [d for d in data if d["petal length"] > 3.0])
print("Subset size:", len(subset))


#特征选择
new_domain = Orange.data.Domain(list(data.domain.attributes[:2]),
                                data.domain.class_var)
new_data = Orange.data.Table(new_domain, data)

print(data[0])
print(new_data[0])


#特征采样
sample = Orange.data.Table(data.domain, random.sample(data, 3))

#或者随机采样属性
atts = random.sample(data.domain.attributes, 2)
domain = Orange.data.Domain(atts, data.domain.class_var)
new_data = Orange.data.Table(domain, data)
print(new_data[0])
Reference for this article: http://docs.orange.biolab.si/3/data-mining-library/tutorial/data.html#orange-datasets-and-numpy
When doing the correlation analysis, I found the Orange library and Orange visualization tools, so I will learn about it. If the data set is obtained, after installing Orange.exe (abbreviation), there is a data set that comes with it.