Introduction
In the microservice environment, one request may cause dozens or hundreds of calls between server-side services. At this time, once there is a problem, there are some issues that we need to consider:
- How to quickly locate the problem?
- What services are involved in the problem?
- Which service has the problem?
At this time, distributed link tracking (Spring Cloud Sleuth) can help us solve the problem.
Official website schematic diagram:
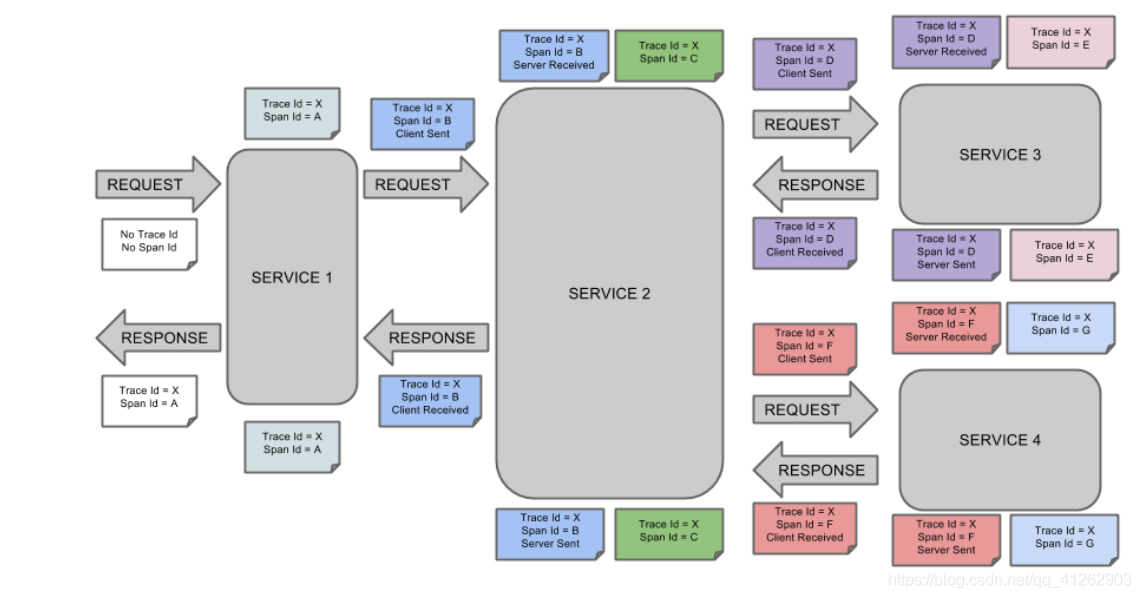
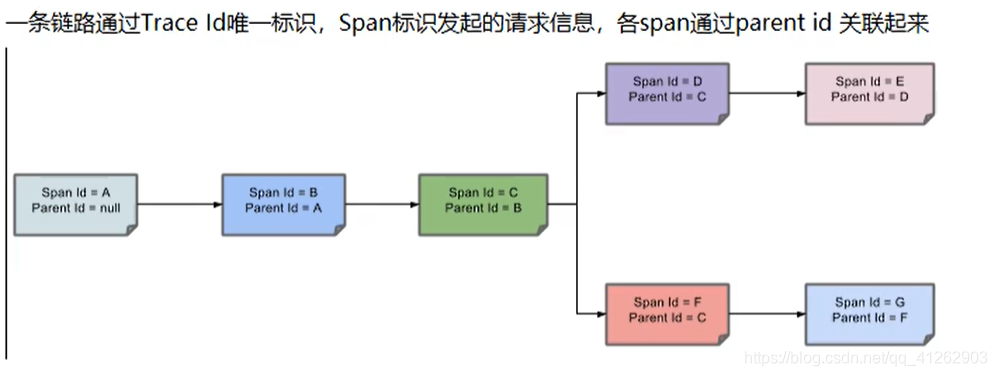
simple schematic diagram:
Glossary:
- Trace: A Span set similar to a tree structure, which represents a call link and has a unique identifier
- span: Indicates the source of the call link. A popular understanding of span is a request for information.
Simple to use
First create a project and introduce the following dependencies:
 <dependency>
            <groupId>org.springframework.boot</groupId>
            <artifactId>spring-boot-starter-web</artifactId>
        </dependency>
        <dependency>
            <groupId>org.springframework.cloud</groupId>
            <artifactId>spring-cloud-starter-sleuth</artifactId>
        </dependency>
Configure a name for the current service to facilitate testing:
spring.application.name=sleuth-hello
Create a testHelloController
@RestController
public class HelloController {

   public static final Logger logger = LoggerFactory.getLogger(HelloController.class);

   @GetMapping("/hello")
    public void hello1(){
        logger.info("hello spring cloud sleuth");
    }
}
Next, start the project call /hellointerface test, and you can see the following log in the console. The
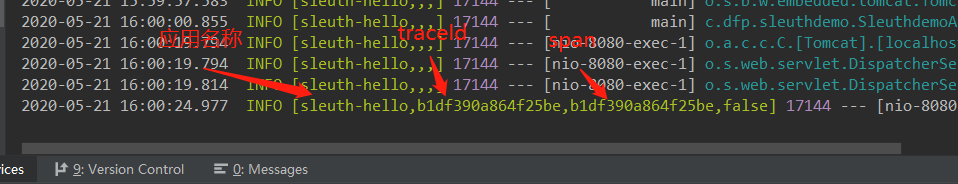
last one falsemeans: whether to output the information to services such as Zipkin for collection and display.
Define two more interfaces and hello2call in to hello3form a call chain:
 @GetMapping("/hello2")
    public String hello2() throws InterruptedException {
        logger.info("hello2");
        Thread.sleep(500);
        return restTemplate.getForObject("http://localhost:8080/hello3",String.class);
    }
    @GetMapping("/hello3")
    public String hello3() throws InterruptedException {
        logger.info("hello3");
        Thread.sleep(500);
        return "hello3";
    }
Restart and call the interface hello2

A trace is composed of multiple spans, a trace is equivalent to a call chain, and a span is each call process in this chain.
Integration with Zipkin
Zipkin is an open source distributed tracking system, open sourced by Twitter. It is dedicated to collecting service timing data to solve the delay problem in the microservice architecture, including data collection, storage, search and display.
Prepare the environment
After Spring Cloud H version, there is no need to install Elasticsearch, Zipkin and other packages as cumbersome as before. Only need to download a jar package to start. Download address https://dl.bintray.com/openzipkin/maven/io/zipkin/java/zipkin-server/
Start after downloading
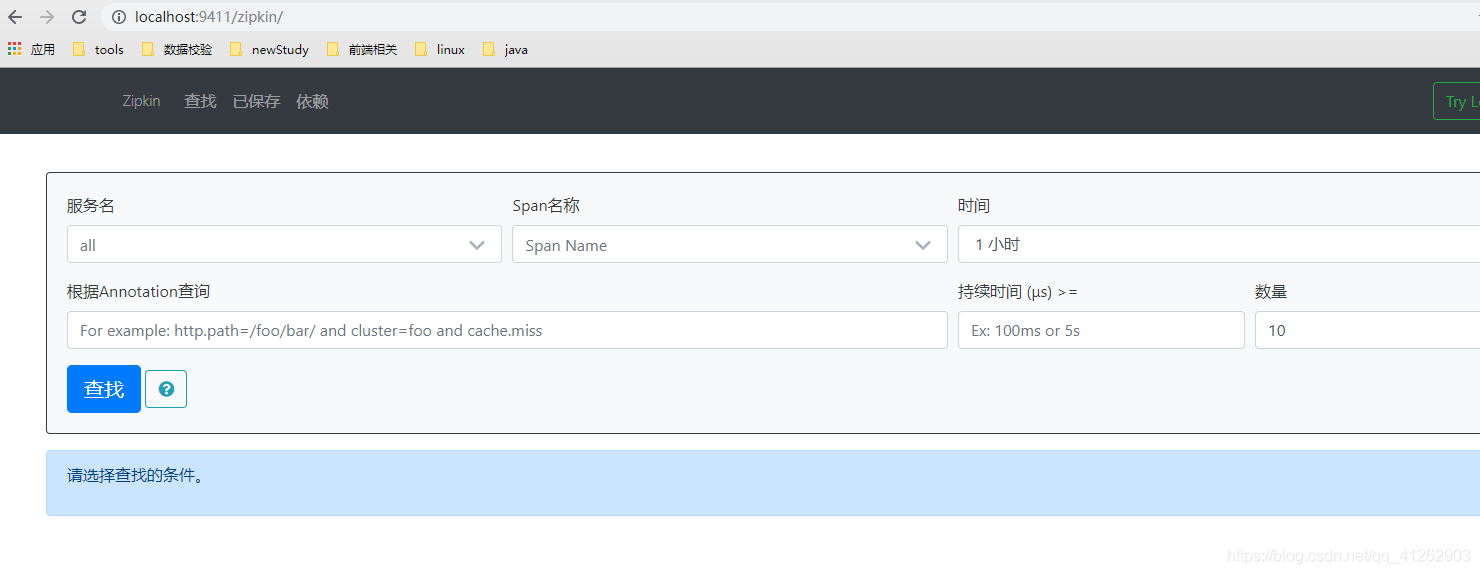
View server http://localhost:9411/
Integration
Add dependency:
 <!--包含了sleuth+zipkin-->
 <dependency>
            <groupId>org.springframework.cloud</groupId>
            <artifactId>spring-cloud-starter-zipkin</artifactId>
        </dependency>
Add configuration file:
# zipkin/sleuth 地址
spring.zipkin.base-url=http://localhost:9411
# 配置采样比例 默认0.1
spring.sleuth.sampler.rate=1
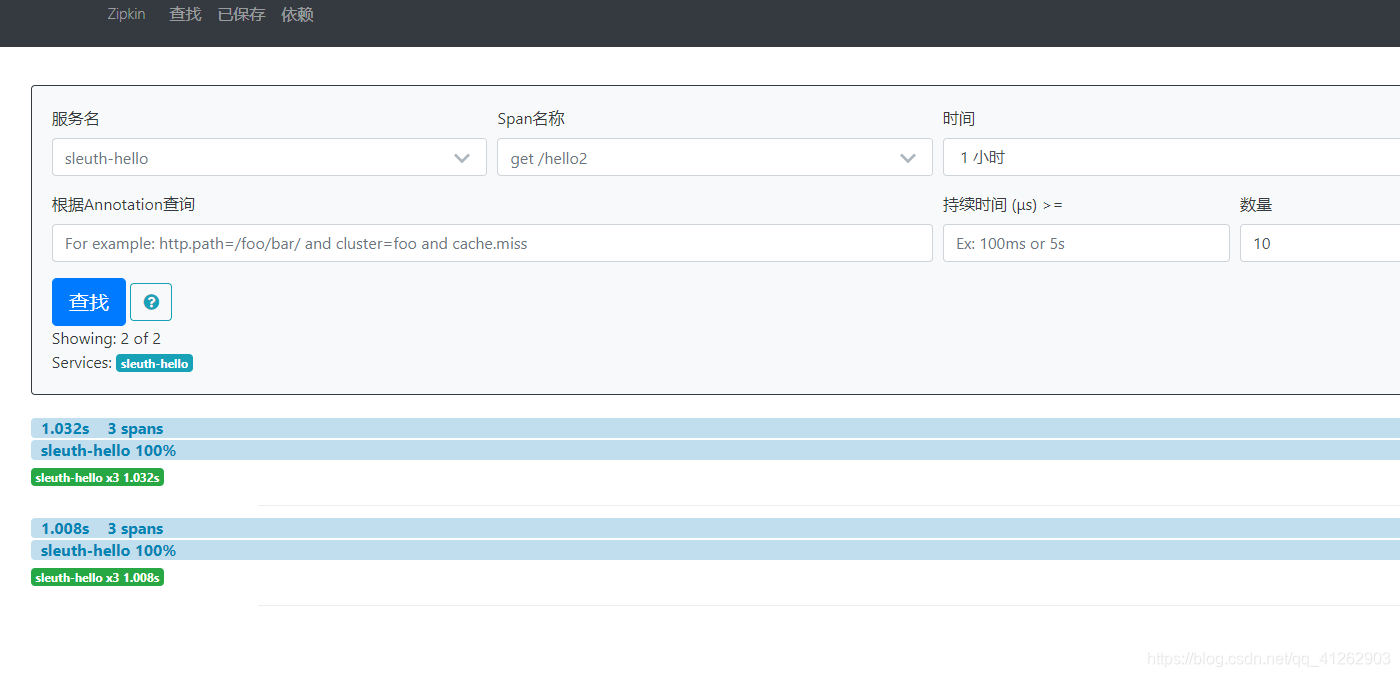
Restart the project, call the /hello2interface, and check the call trace at http://localhost:9411/