Part I: the Spring Cloud - Configuration Center Config
1. Why do you need Spring Cloud Sleuth
Micro-service architecture is a distributed architecture, which by business services unit, a distributed system tends to have a number of service units. Due to the large number of service units, the complexity of the business, if something goes wrong and abnormal, it is difficult to locate. Mainly reflected in, a request may need to call a number of services, and call complexity of internal services, it determines the problem is difficult to locate. Therefore, the micro-service architecture, must implement a distributed link tracking, to follow up a request in the end what services involved in order to participate and how to achieve the steps each request is clearly visible, out of the question, quickly positioning .
In short for a large FAQ micro-services architecture system is as follows: how to call chains series, quickly locate the problem; how to clarify the dependencies between micro services; how the performance of each service interface points off; how to track traffic flow deal with.
2. spring Cloud Sleuth Profile
Source official website Terms Translation: https://cloud.spring.io/spring-cloud-static/spring-cloud-sleuth/2.2.2.RELEASE/reference/html/#terminology
spring Cloud Sleuth provides a distributed tracing for spring Cloud the solution, which borrowed heavily from Google Dapper, Twitter Zipkin and Apache HTrace design, first take a look Sleuth term, Sleuth borrowed terms of Dapper.
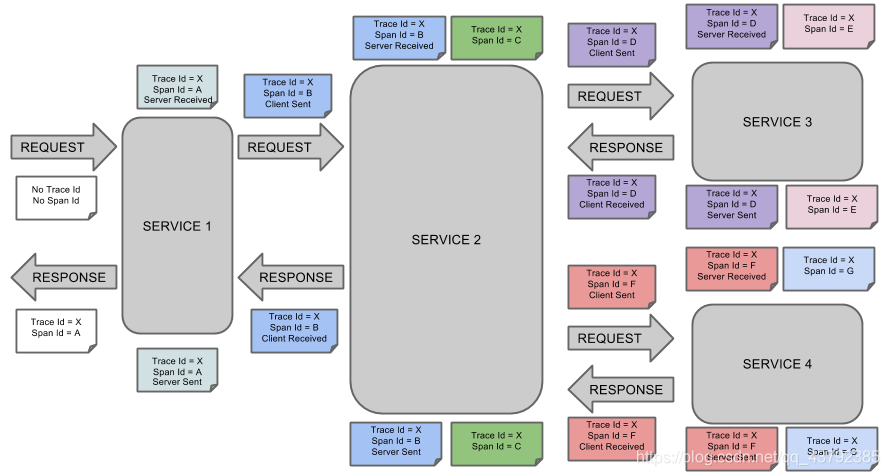
- span (span): The basic unit of work. id uniquely identifies with a span of 64. In addition to the ID, span also contain additional data, such as described, event timestamp, annotation value pairs (label), spanID, span the parent ID and the like. When the span is to start and stop recording time information. Initialization span is called "rootspan", and trace equal the span id's ID.
- trace (trace): a set of shared tree "rootspan" is referred to as the span traceo trac composition also use a 64-bit ID that uniquely identifies all share the span of the trace in the trace ID
- annotation (annotation): annotation is used to record the presence of the event, in which the core annotation is used to define the start and end request.
CS (Client sent client sends): The client initiates a request, the annotation describes the start of the span.
SR (server Received server receives): the server and get ready to process requests it. If you subtract the time stamp with CS SR, you can get network latency. C)
the SS (Server The server sends Sent): annotation indicates that the request processing is completed (when the response back to the client). If the time stamp subtracted by SR SS, the server can get the time required to process the request.
CR (Client Received client receives): span end identification. The client receives a successful response from the server side. If the CR time stamp subtracted CS, the time required can be obtained from the client sends a request to the server in response to the
Spring Cloud Sleuth can track more than 10 kinds of types of components:. Async, Hystrix, messaging, websocket, rxjava, scheduling, web (Spring MVC Controller, Servlet), webclient (Spring RestTemplate), Feign, Zuul official website: HTTPS: // cloud.spring.io/spring-cloud-static/spring-cloud-sleuth/2.2.2.RELEASE/reference/html/#integrations
Here is a simple example of FIG micro service call chain to the official:
3. build ZIPkin Server environment
Because sleuth for distributed link tracking are just some of the recorded data, the data we have people to read and process will inevitably be too much trouble, so we generally give it Zipkin Server uniform handling on such data.
3. 1 Zipkin Profile
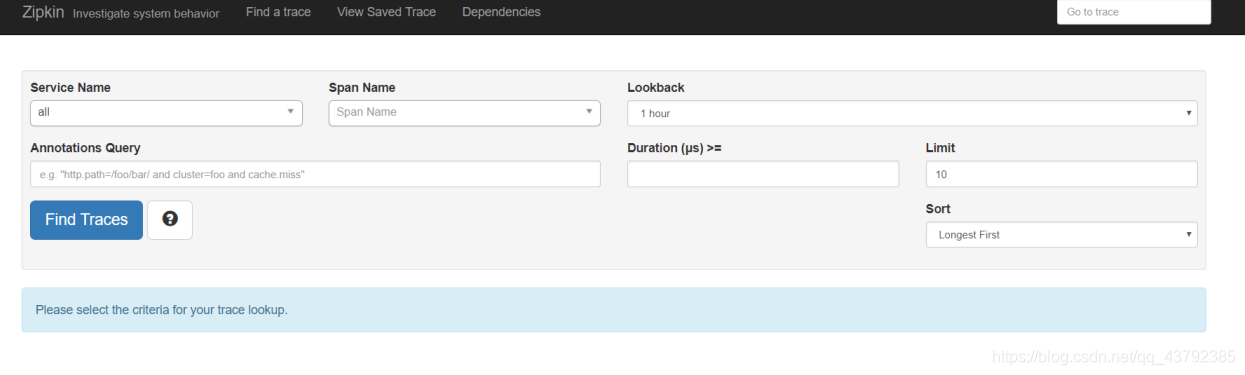
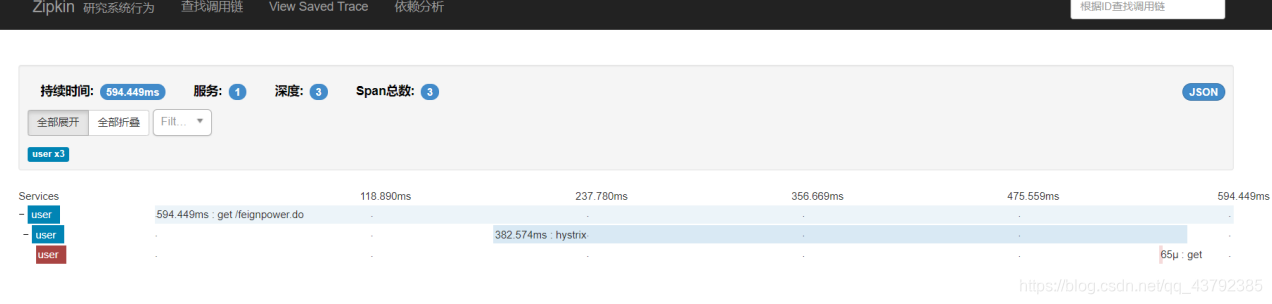
Zipkin is an open source distributed tracking system by Twitter Open Source company, it is committed to regular data collection services, in order to solve the delay problem micro-service architecture, including data collection, storage, search and show.
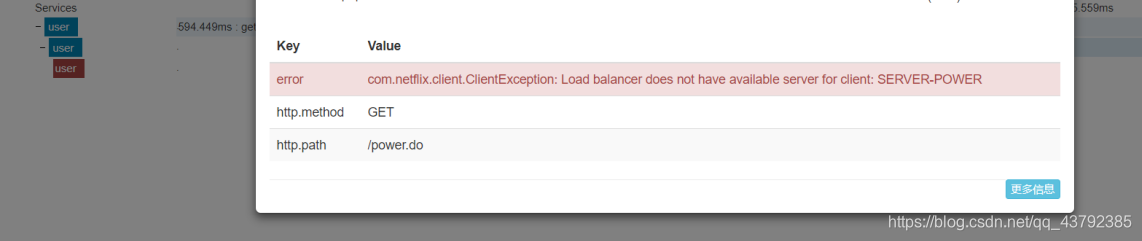
Each service report to zipkin timing data, zipkin UI will generate a dependency diagram according to Zipkin by calling relations, showing how much each service tracking request through the system so that developers can easily through a Web front-end data collection and analysis, for example, each user service request processing times, etc., can be easily monitored bottlenecks present in the system.
Providing Zipkin pluggable data storage: In-Memory, MySql, Cassandra and Elasticsearch. The next test is stored using In-Memory convenient and direct manner, production recommended Elasticsearch.
Official website address: https://zipkin.io/
open source address (recommended access): https://github.com/openzipkin/zipkin
3. 2 Server built environment
In zipkin2.7.x later it does not support custom server needs to use the official version or Docker, so here introduce the recommended two ways. After starting the service access Zipkin UI: HTTP: // your_host: 9411 / Zipkin / .
3. Use the official version 2.1
It requires JRE 8 above, to execute the following instructions:
curl -sSL https://zipkin.io/quickstart.sh | bash -s
java -jar zipkin.jar
3. Installation 2.2 docker
docker environment before installation and basic use of reference Bowen: summary Docker learning (using centos7-1804)
docker run -d -p 9411:9411 openzipkin/zipkin
3. 2.3 custom server service
Create a maven project, dependent on the introduction of
		<dependency>
			<groupId>io.zipkin.java</groupId>
			<artifactId>zipkin-autoconfigure-ui</artifactId>
			<version>2.8.4</version>
		</dependency>
		<dependency>
			<groupId>io.zipkin.java</groupId>
			<artifactId>zipkin-server</artifactId>
			<version>2.8.4</version>
		</dependency>
Add comment startup class
package com.qqxhb.zipkin;

import org.springframework.boot.SpringApplication;
import org.springframework.boot.autoconfigure.SpringBootApplication;
import zipkin.server.internal.EnableZipkinServer;

/**
 * @author Administrator
 * @version 1.0
 **/
@EnableZipkinServer
@SpringBootApplication
public class ZIPkinApplication {
	public static void main(String[] args) throws Exception {
		SpringApplication.run(ZIPkinApplication.class, args);
	}

}
配置 YML
server:
  port: 9411
spring:
  application:
    name: springcloud-sleuth
management:
  metrics:
    web:
      server:
        autoTimeRequests: false
Successful launch interface is as follows:
4. Sleuth micro-services integration Zipkin
The introduction of micro-reliance in service
		<dependency>
			<groupId>org.springframework.cloud</groupId>
			<artifactId>spring-cloud-starter-sleuth</artifactId>
		</dependency>
		<dependency>
			<groupId>org.springframework.cloud</groupId>
			<artifactId>spring-cloud-starter-zipkin</artifactId>
		</dependency>
Add the configuration yml
spring:
  application:
    name: service-provider-course
  zipkin:
    base-url: http://localhost:9411  #指定Zipkin server地址
  sleuth:
    sampler:
      probability: 1.0  #request采样的数量 默认是0.1 也即是10%  顾名思义 采取10%的请求数据  因为在分布式系统中,数据量可能会非常大,因此采样非常重要。我们示例数据少最好配置为1全采样
Start micro-services and calls
5. Zipkin Server Data Persistence
We just describes how to link distributed call information is uploaded to zipkin server but have a question:
When zipkin restart our distributed data link all cleared. Because zipkin server default data is stored in the memory of them, so when you restart the service memory naturally also cleared.
Providing Zipkin pluggable data storage: In-Memory, MySql, Cassandra and Elasticsearch. The next test is stored using In-Memory convenient and direct manner, production recommended Elasticsearch.
Zipkin and Elasticsearch integrate basic concepts and entry on Elasticsearch please refer to previous blog post: full-text search -Elasticsearch , Docker build Elasticsearch cluster integration Springboot .
First, we introduce rely on our zipkin server inside:
		<dependency>
			<groupId>io.zipkin.java</groupId>
			<artifactId>zipkin-autoconfigure-storage-elasticsearch-http</artifactId>
			<version>2.3.1</version>
		</dependency>
Server and then modify the configuration file as follows (adding Elasticsearch configuration):
server:
  port: 9411
spring:
  application:
    name: springcloud-sleuth
management:
  metrics:
    web:
      server:
        autoTimeRequests: false
zipkin:
  storage:
    type: elasticsearch
    elasticsearch:
      cluster: springcloud
      hosts: http://localhost:9200
      index: zipkin
Now restart Zipkin Server and the data stored in Elasticsearch in, even if the restart ZIPkin call chain data will not be lost. Source Address: https://github.com/qqxhb/springcloud-demo .
