Linux disassembly debugging method
Linux kernel modules or applications often crash due to various reasons. In general, function call stack information is printed. In this case, how do we locate the problem? This document introduces a disassembly method to assist in locating such problems.
The code example is as follows:
#include <signal.h>
#include <stdio.h>
#include <stdlib.h>
#include <execinfo.h>
#include <fcntl.h>
#include <string.h>
#include <unistd.h>
#include <sys/types.h>
#include <sys/stat.h>
#define PRINT_DEBUG
#define MAX_BACKTRACE_LEVEL 10
#define BACKTRACE_LOG_NAME "backtrace.log"
static void show_reason(int sig, siginfo_t *info, void *secret)
{
void *array[MAX_BACKTRACE_LEVEL];
size_t size;
#ifdef PRINT_DEBUG
char **strings;
size_t i;
size = backtrace(array, MAX_BACKTRACE_LEVEL);
strings = backtrace_symbols(array, size);
printf("Obtain %zd stack frames.\n", size);
for(i = 0; i < size; i++)
printf("%s\n", strings[i]);
free(strings);
#else
int fd = open(BACKSTRACE_LOG_NAME, O_CREAT | O_WRONLY);
size = backtrace(array, MAX_BACKTRACE_LEVEL);
backtrace_symbols_fd(array, size, fd);
close(fd);
#endif
exit(0);
}
void die() {
char *str1;
char *str2;
char *str3;
char *str4 = NULL;
strcpy(str4, "ab");
}
void let_it_die() {
the();
}
int main(int argc, char **argv){
struct sigaction act;
act.sa_sigaction = show_reason;
sigemptyset (& act.sa_mask);
act.sa_flags = SA_RESTART | SA_SIGINFO;
sigaction(SIGSEGV, &act, NULL);
sigaction(SIGUSR1, &act, NULL);
sigaction(SIGFPE, &act, NULL);
sigaction(SIGILL, &act, NULL);
sigaction(SIGBUS, &act, NULL);
sigaction(SIGABRT, &act, NULL);
sigaction(SIGSYS, &act, NULL);
let_it_die();
return 0;
}
In this example, we use a custom signal processing function to obtain and print the function call stack information by calling backtrace() and backtrace_symbols() when the program is abnormal. Next we compile and run the program.

When compiling, the -g and -rdynamic options are added, mainly to add debugging information. It can be seen that an exception occurred during runtime, the function call stack was printed, and the stack frame was 7 layers. In the stack frame information, the kernel reverses layer by layer when obtaining the function call stack information, so the order of function calls is reversed, that is, main->let_it_die()->die().
The format displayed on each line of the function call stack is: the executable file where the offending code is located (symbol + relative displacement) [load address]
Take the call stack information line "./backtrace(main+0xf7) [0x80488cd]" as an example to show that the current executable file is backtrace, and the code line is offset from the address of the main symbol to the 0xf7 line. Normally, it can be executed In the assembly code that is disassembled from the file, the address where the main symbol is located plus the relative displacement is equal to the subsequent load address. Sometimes, maybe because of the version update, after we recompile the code to generate the executable file, and then disassemble and analyze the problem, because the code is updated compared with the time when the problem occurs, then main+0xf7 may not be equal to the call printed when the problem occurs The load address of the stack. By calculating the value of the sign plus the relative displacement, and then comparing it with the load address, you can confirm whether the code is consistent with the problem.
Next we disassemble the executable file
justin@ubuntu:~/workspace/backtrace$ objdump -dS backtrace > backtrace.asm
Next, we will locate the problem by analyzing the disassembled assembly code and the call stack information when the problem occurs. First, start from the bottom call stack, namely ./backtrace() [0x804873d], and search for the 0x804873d address symbol in the assembly code, as follows :
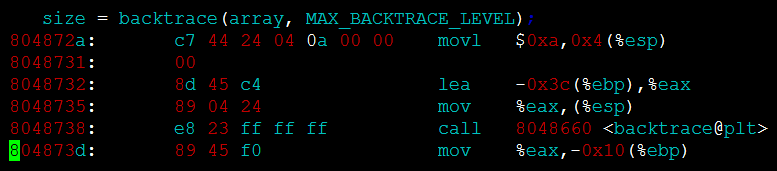
You can see the corresponding code line size = backtrace(array, MAX_BACKTRACE_LEVEL); By looking at the code, you can know that this function is called in the show_reason function. Try to find the address of the show_reason symbol in the assembly code:
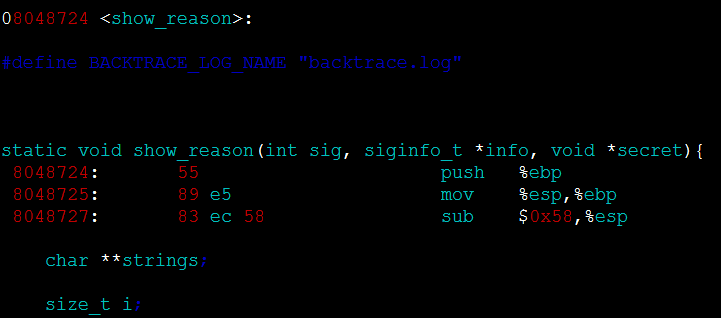
Analyzing the code, I found that the show_reason function is a custom exception handling function when an exception occurs. I tried to find the address 0xb7707410 printed by the call stack information of the upper layer. It was found that it was not in the assembly code, indicating that it was an external address, because show_reason is an internal exception in the program. It will only be called when the program is abnormal, so the internal code must be the cause of the program exception, so next we analyze the next line of call stack information, that is, ./backtrace(die+0x18) [0x80487c0]. First, find the die symbol in the assembly code, its address is 0x80487a8.
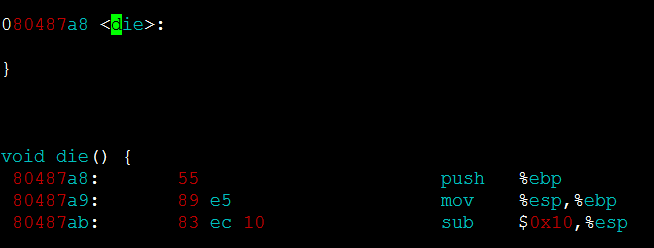
Use this address to load the relative displacement 0x18 equal to 0x80487c0 and the load address displayed on the function call stack is the same. Find the line of the address in the assembly code:

It can be seen that the problem is in strcpy(str4, "ab"); this line of code, you can clearly see that the previously defined str4 is a null pointer, and copying the string to the area pointed to by the null pointer will cause a null pointer exception.
Of course, in more cases, we will not be able to disassemble the disassembly information of the source code and the assembly code because we cannot find the corresponding code when the problem occurs, or the exported executable file is compiled without debugging options. . For the former case, the load address has no reference meaning. We can only find the symbol in the disassembly information, find the error line through the relative displacement, and compare and analyze the problem with the existing code. For the latter, we can only locate the assembly code of the error line, and then read the assembly code snippets to analyze the cause of the problem.
Usually we use objdump disassembly to analyze the problem, but also use two other particularly useful commands, namely nm and addr2line.
nm is used to export the symbol table from the executable file, and its function is similar to readelf –s or objdump –T(t)
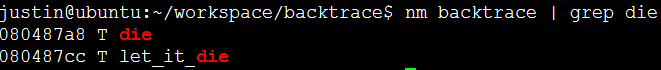
The address of die symbol and let_it_die symbol searched by nm command is the same as the disassembled address.
The addr2line command can print symbols, executable files and error code lines from executable files by specifying the address:

Here I tried to find the load address in ./backtrace(die+0x18) [0x80487c0], and found the die function called when an error occurred. The error line is line 80:
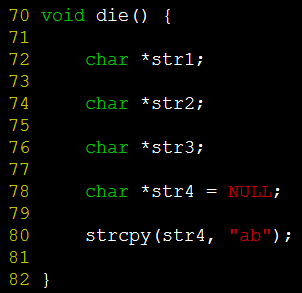
It can be clearly seen that addr2line locates the line where strcpy is called in the die function.