Write catalog title here
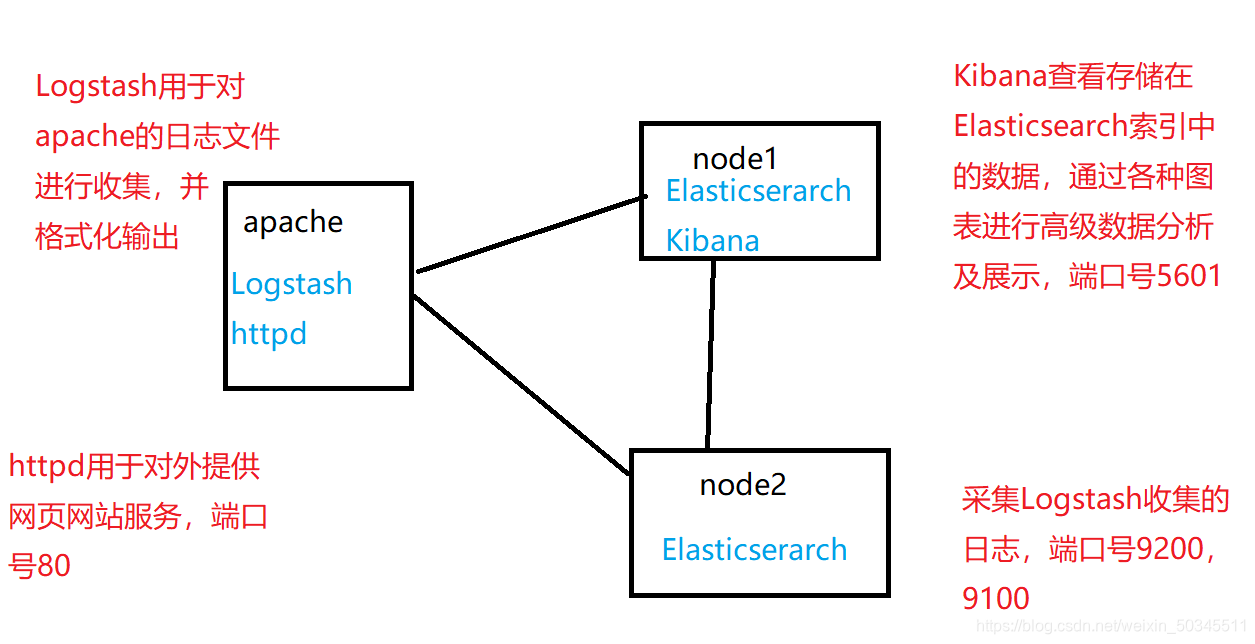
1. Introduction to ELK Daily Analysis System
ELK is actually Elasticsearch+Logstash+Kibana
1.1 Elasticsearch (index database)
Provides a full-text search engine with distributed multi-user capabilities
1.1.1 Elasticserarch core concepts
1. Near real-time (NRT)
lasticsearch is a near real-time search platform, which means that there is a slight delay from indexing a document until the document can be searched (usually 1 second)
2. Cluster (cluster) clustering Management
A cluster is organized by one or more nodes, which together hold your entire data and provide indexing and search functions together. One of the nodes is the master node. This master node can be elected and provides cross-node joint search and search functions. The cluster has a unique name. The default is elasticsearch. The cluster name is very important. Each node is added to its cluster based on the cluster name. Therefore, make sure to use different cluster names in different environments.
A cluster can have only one node. It is strongly recommended to configure it in cluster mode when configuring elasticsearch.
es has a cluster mechanism, nodes are added to the cluster through the cluster name, and at the same time, the nodes in the cluster will have their own unique identification (own name)
3. The node (node)
is a single server, which is a cluster Part of it, stores data and participates in the indexing and search functions of the cluster. Like a cluster, nodes are also identified by names, and the default is a character name randomly assigned when the node is started. Of course, you can define it yourself. The name is also very important and is used to identify the node corresponding to the server in the cluster.
Nodes can be added to the cluster by specifying the cluster name. By default, each node is set to join the elasticsearch cluster. If multiple nodes are started, assuming they can automatically discover each other, they will automatically form a cluster called elasticsearch.
4. Index (index)
An index is a collection of documents with similar characteristics. For example, you can have an index for customer data, another index for a product catalog, and an index for order data. An index is identified by a name (must be all lowercase letters), and when we want to index, search, update, and delete documents corresponding to this index, we must use this name. In a cluster, you can define as many indexes as you want.
The index is relative to a relational database library.
5. Type (type)
In an index, you can define one or more types. A type is a logical classification/partition of your index, and its semantics are completely up to you. Usually, a type is defined for documents that have a set of common fields. For example, let's suppose you run a blogging platform and store all your data in an index. In this index, you can define one type for user data, another type for blog data, and of course, you can also define another type for comment data.
Type is relative to table
6, document of relational database.
A document is a basic information unit that can be indexed. For example, you can have a document for a certain customer, a document for a certain product, and of course, you can also have a document for a certain order. Documents are expressed in JSON (Javascript Object Notation) format, and JSON is an Internet data interaction format that exists everywhere. In an index/type, you can store as many documents as you want. Note that although a document is physically located in an index, in fact a document must be indexed and assigned a type in an index. The document is relative to the columns of the relational database.
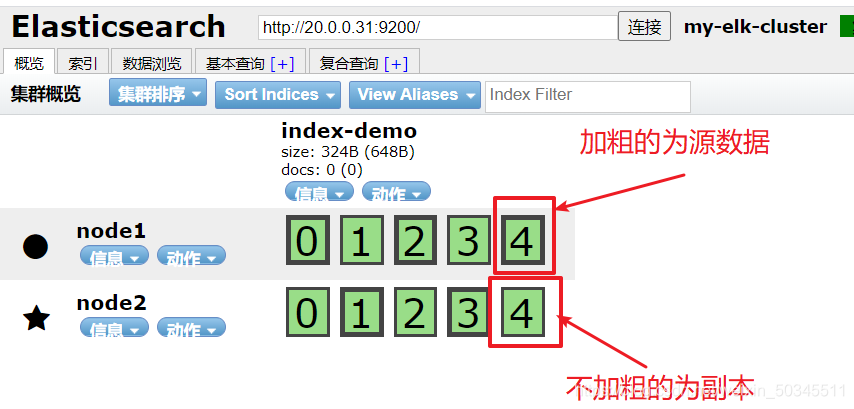
1.1.2 Shards & replicas
1.2.1 The main reason for sharding
① Horizon split expansion, increasing storage capacity
② Distributed and cross-sharding operations, improving performance and throughput
1.2.2 The main reason for the copy
① High availability, in order to deal with sharding or node failure, the shard copy should be on different nodes
② Improve performance and increase throughput
1.2 Logstash (collect, output, store logs)
1.2.1 Introduction to Logstash
①A powerful data processing tool
②It can realize data transmission, format processing, formatted output,
data input, data processing (such as filtering, rewriting, etc.), and data output.
③ Logstash is written in JRuby language and is simple based on message (message based) Architecture, and run on the Java Virtual Machine (JVM). Unlike a separate agent or server, LogStash can be configured with a single agent combined with other open source software to achieve different functions.
1.2.2 LogStrash main components
Shipper
Indexer
Broker
Search and Storage
Web Interface
1.2.3 Logstash working principle
Collect: Data input
Enrich: Data processing, such as filtering, rewriting, etc.
Transport: Data output (called by other modules)
1.3 Kibana (display display data)
1.3.1 Introduction to Kibana (Get data from ES)
An open source analysis and visualization platform search for Elasticsearch, view the data stored in the Elasticsearch index, and perform advanced data analysis and display through various charts
1.3.2 Kibana main functions
Elasticsearch seamless
integration Data integration, complex data analysis
to benefit more team members
Flexible interface, easier to share
flexible configuration, visualization of multiple data sources
Simple data export
Two, ELK deployment
2.1 System environment
2.1.1 Network environment
| equipment | IP address | install software |
|---|---|---|
| node1 | 20.0.0.31 | Kibana, Elasticserarch |
| node2 | 20.0.0.32 | Elasticserarch |
| apache | 20.0.0.33 | Logstash、httpd |
Turn off the firewall (all devices)
systemctl stop firewalld
setenforce 0
Address mapping (node1, node2)
vi /etc/hosts

2.1.2 Topology diagram
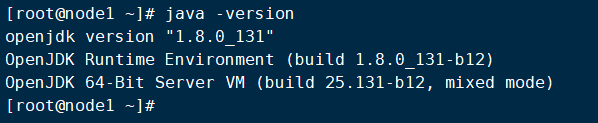
2.1.3 java environment variables
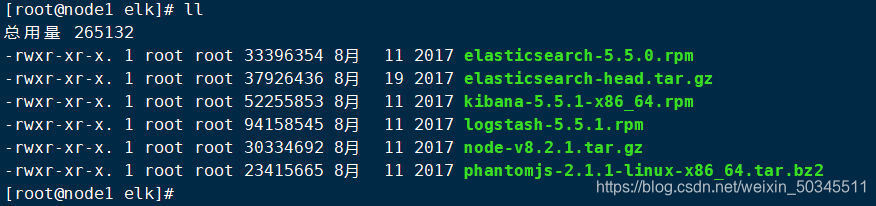
2.1.4 Software packages required for security
2.2 Elasticserarch deployment
2.2.1 Elasticsearch installation
1. Cut to the directory containing the elasticsearch-5.5.0.rpm package, and perform rpm installation
rpm -ivh elasticsearch-5.5.0.rpm
2. Back up and modify the configuration file
cp /etc/elasticsearch/elasticsearch.yml /etc/elasticsearch/elasticsearch.yml.bak
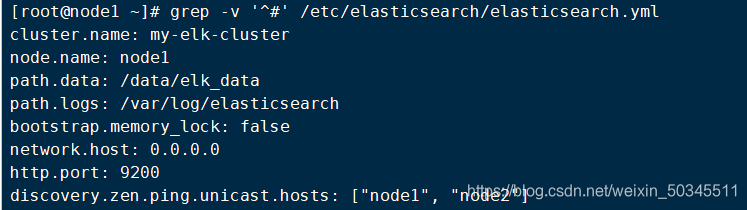
vi /etc/elasticsearch/elasticsearch.yml
Make changes to the following
cluster.name: my-elk-cluster   #集群名字
node.name: node1               #节点名字
path.data: /data/elk_data      #数据存放路径(需要创建)
path.logs: /var/log/elasticsearch   #日志存放路径
bootstrap.memory_lock: false     #不启动的时候锁定内存(前端缓存,与Iops--性能测试方式,每秒读写次数有关)
network.host: 0.0.0.0            #提供服务绑定的IP地址,0.0.0.0代表所有地址
http.port: 9200                #侦听端口为9200
discovery.zen.ping.unicast.hosts: ["node1", "node2"]     # 集群发现通过单播实现
3. Create data storage files and authorize
mkdir -p /data/elk_data
chown elasticsearch:elasticsearch /data/elk_data/
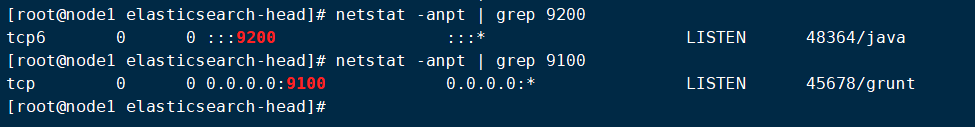
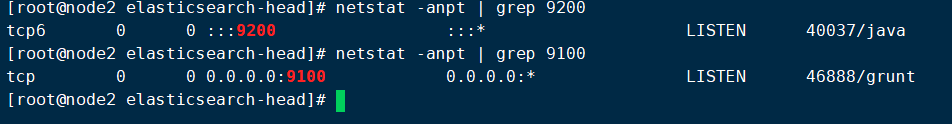
4. Start the service and check
systemctl start elasticsearch
netstat -anpt | grep 9200

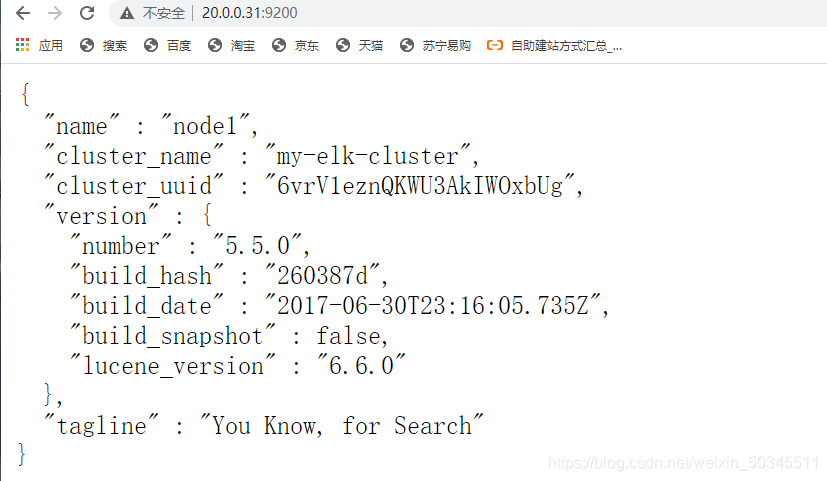
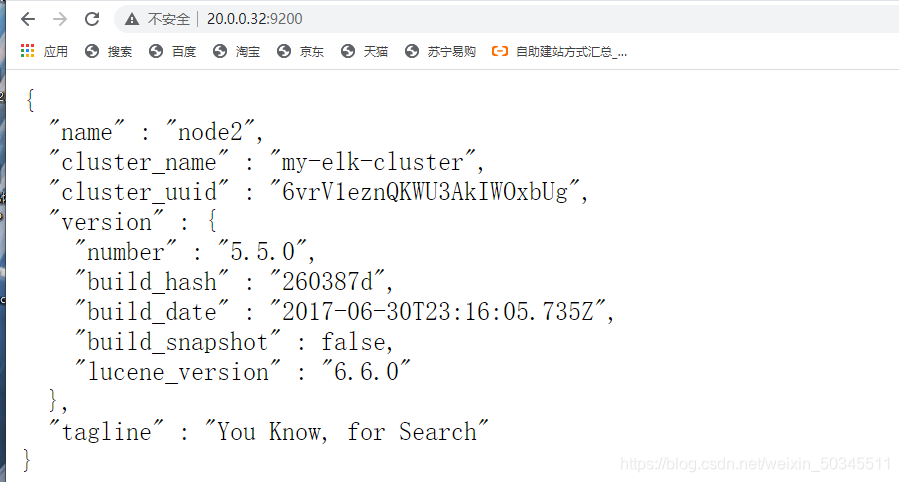
5. Browser access test
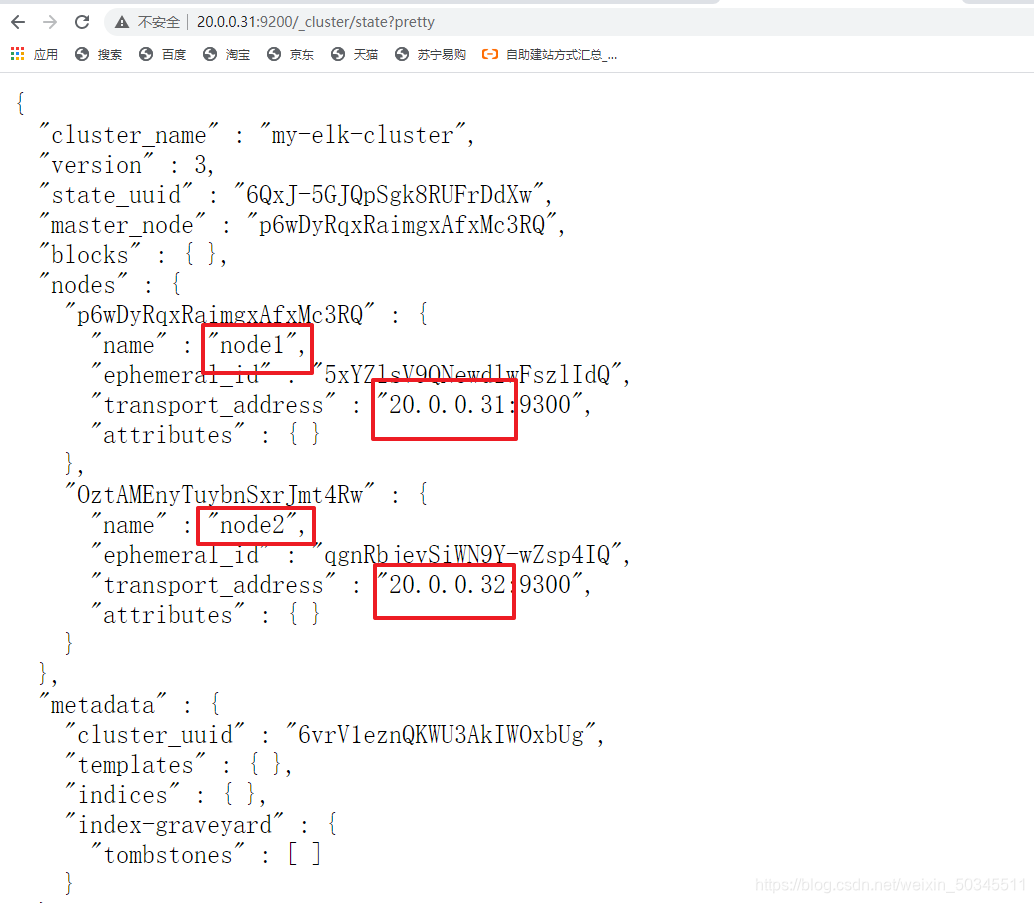
6. Check the health and status of the cluster
http://20.0.0.31:9200/_cluster/state?pretty
2.2.2 Install node components
1. Install dependencies
yum -y install gcc gcc-c++ make
2. Cut to the directory where node-v8.2.1.tar.gz is located for operation
Installation time is about 47 minutes
tar xf node-v8.2.1.tar.gz -C /opt/
cd /opt/node-v8.2.1/
./configure
make && make install
2.2.3 Install phantomjs front-end framework
tar xf phantomjs-2.1.1-linux-x86_64.tar.bz2 -C /usr/local/src/
cd /usr/local/src/phantomjs-2.1.1-linux-x86_64/bin/
cp phantomjs /usr/local/bin/
2.2.4 Install elasticsearch-head front-end framework
Cut to the directory where elasticsearch-head is located for operation
tar xf elasticsearch-head.tar.gz -C /usr/local/src/
cd /usr/local/src/elasticsearch-head/
npm install
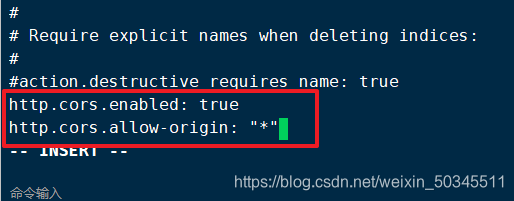
2.2.5 Edit the main configuration file
vi /etc/elasticsearch/elasticsearch.yml
Add at the end
http.cors.enabled: true       开启跨域访问支持,默认为false
http.cors.allow-origin: "*"    跨域访问允许所有域名地址
Restart service
systemctl restart elasticsearch
View port status
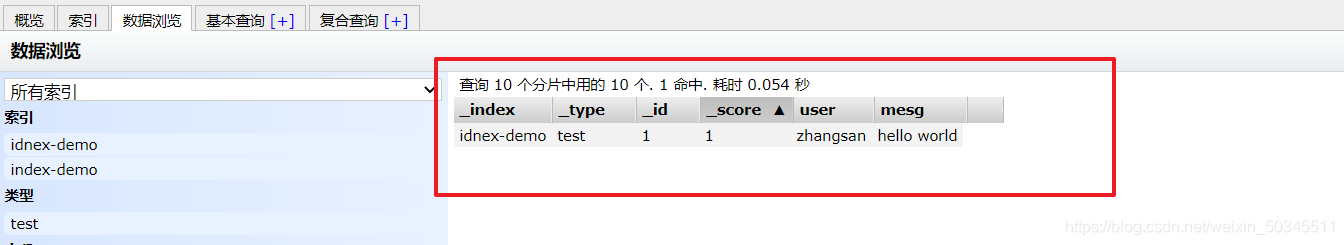
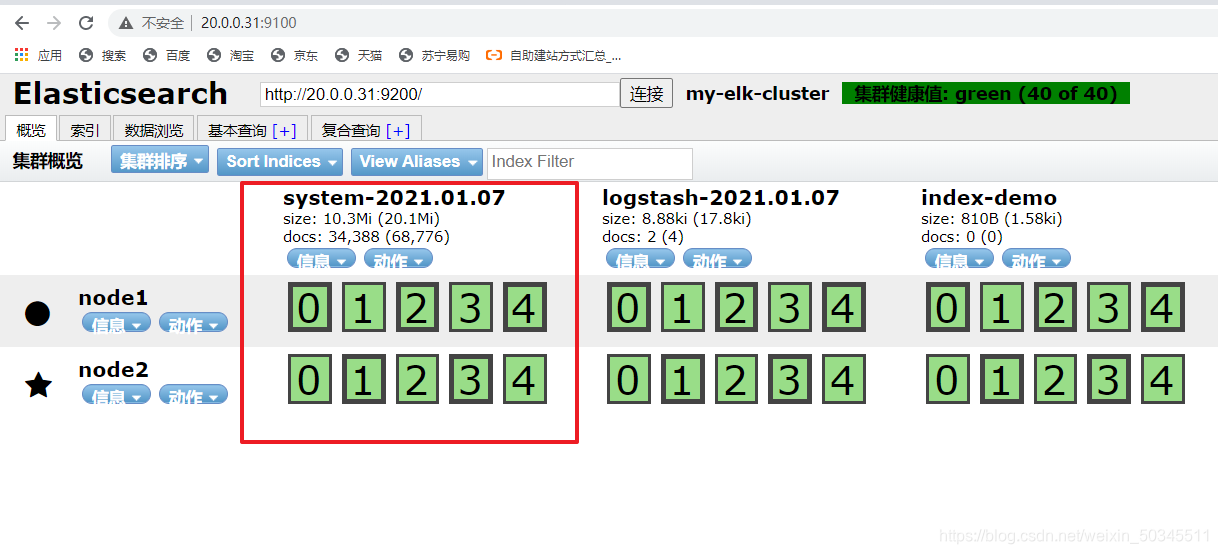
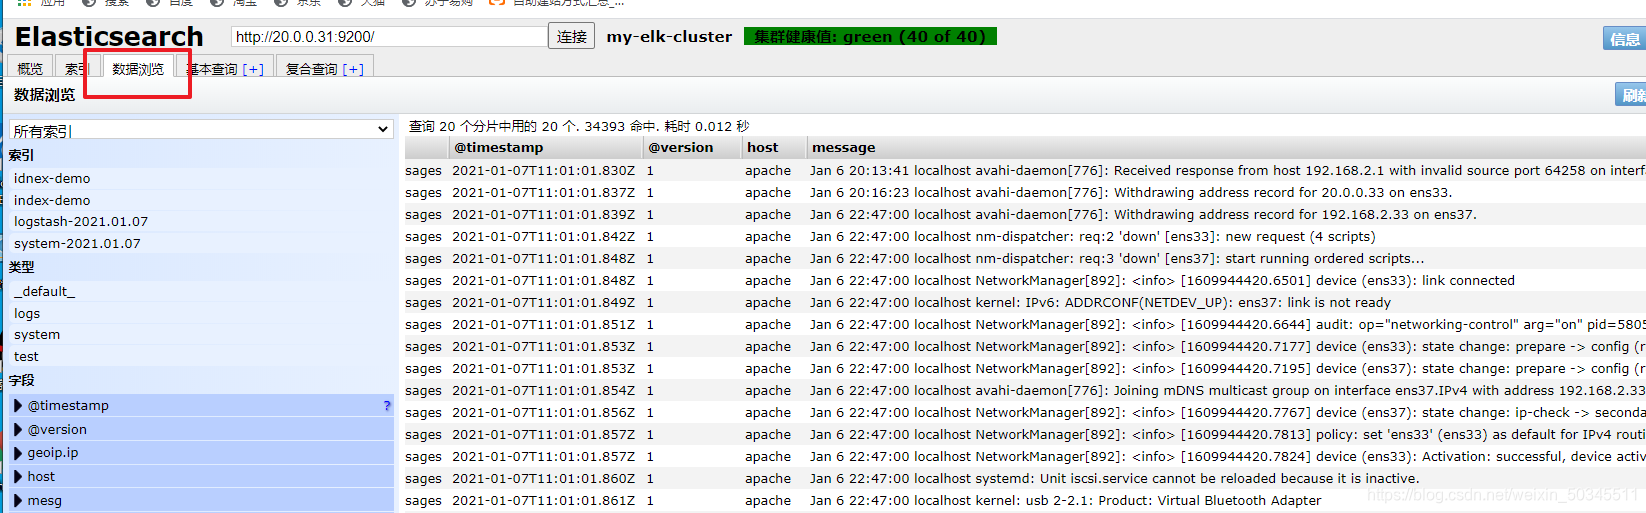
2.2.6 es front-end index display simulation
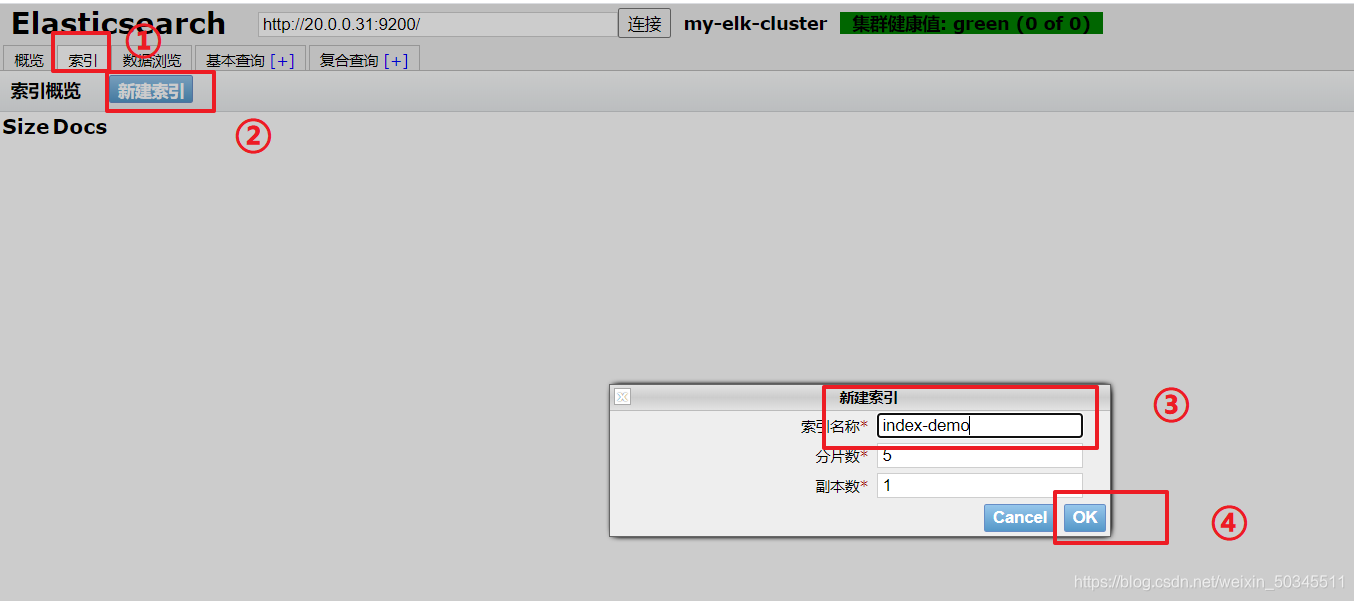
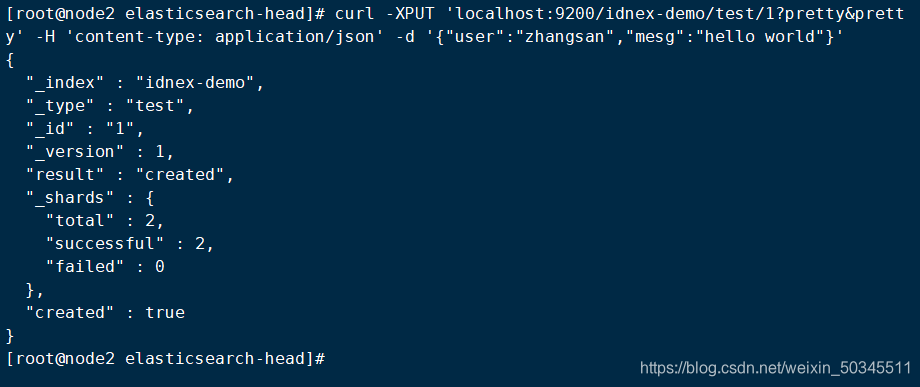
Create index on node1
curl -XPUT 'localhost:9200/idnex-demo/test/1?pretty&pretty' -H 'content-type: application/json' -d '{"user":"zhangsan","mesg":"hello world"}'
Refresh in the browser to view the information through the browser
2.3 deploy logstash
2.3.1 Install apache
Install apache using yum
yum -y install httpd
Turn on and check status
systemctl start httpd
netstat -anpt | grep 80

2.3.2 Install logstash
rpm -ivh logstash-5.5.1.rpm
systemctl start logstash.service
systemctl enable logstash.service
ln -s /usr/share/logstash/bin/logstash /usr/local/bin/
Logstash command test
logstash -e 'input { stdin{} } output { stdout{} }'
Field description explanation
-f Through this option, you can specify the configuration file of logstash. Configure logstash according to the configuration file.
-e followed by a string can be used as the configuration of logstash (if it is "", stdin is used as input and stdout as output by default)
-t test whether the configuration file is correct, and then exit

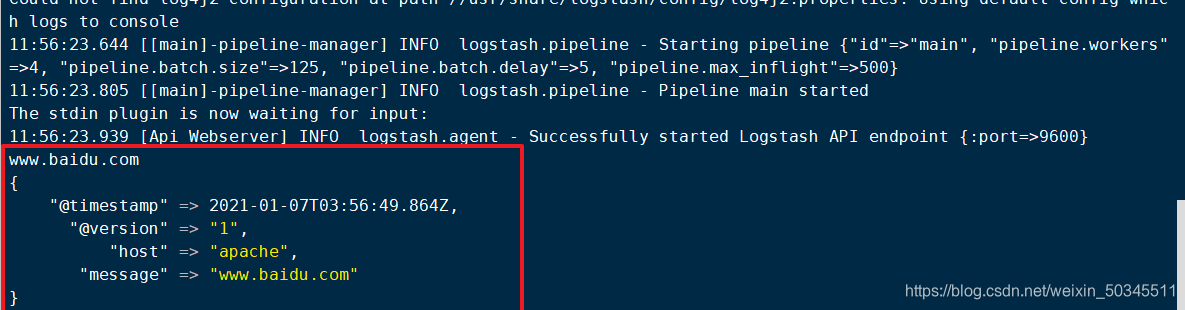
Use rubydebug to display detailed output, codec is a kind of encoder
logstash -e 'input { stdin{} } output { stdout{} }'
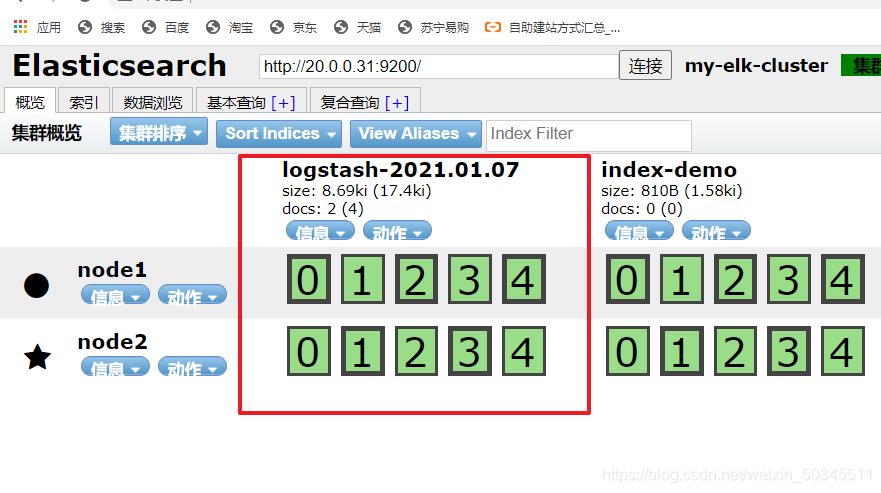
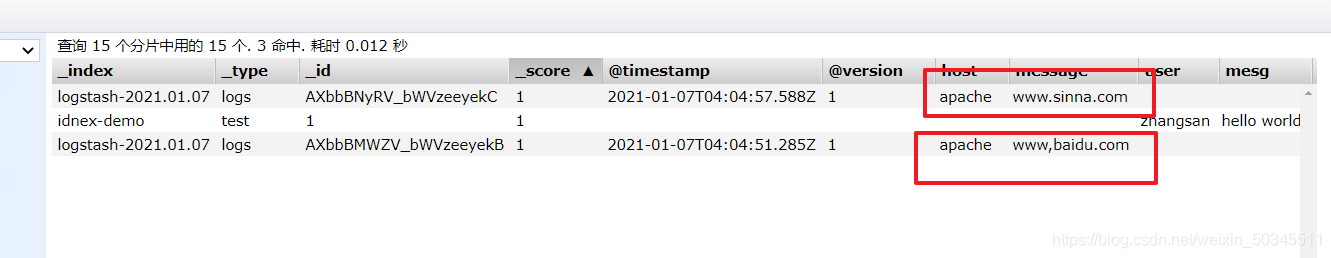
Use logstash to write information to elasticsearch
logstash -e 'input { stdin{} } output { elasticsearch { hosts=>["20.0.0.31:9200"] } }'
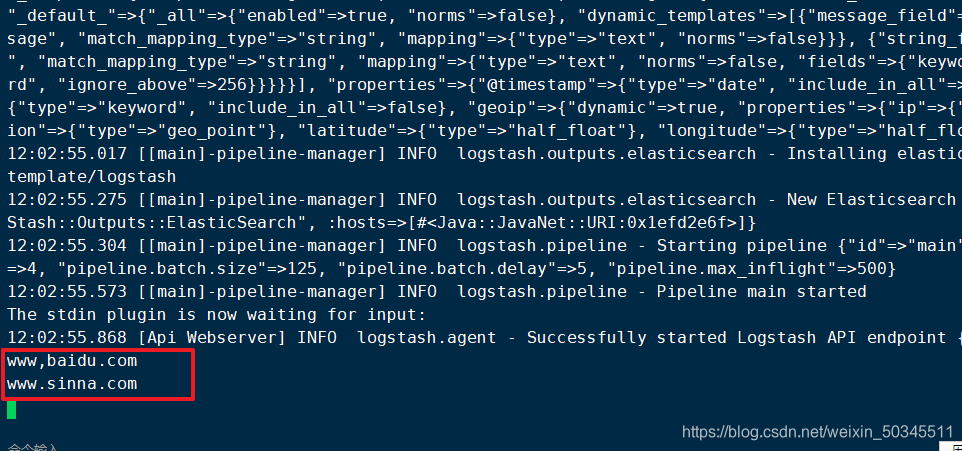
Go to browser to view
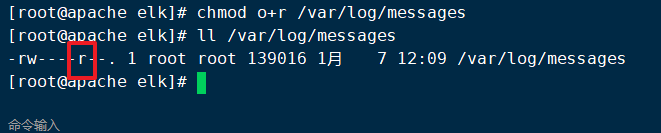
2.3.3 Collect system logs through logstash
Log information gives other users the permission to read
chmod o+r /var/log/messages
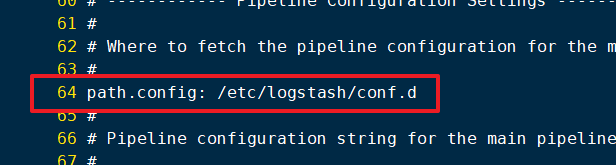
vi /etc/logstash/conf.d/system.conf
input {
      file{
          path => "/var/log/messages"
          type => "system"
          start_position => "beginning"
          }
       }
output {
       elasticsearch {
           hosts => ["20.0.0.31:9200"]
           index => "system-%{+YYYY.MM.dd}"
           }
        }
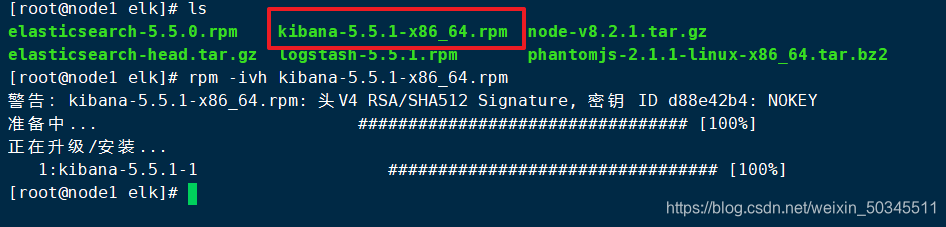
2.3 Kibana
rpm -ivh kibana-5.5.1-x86_64.rpm
cp /etc/kibana/kibana.yml kibana.yml.bak
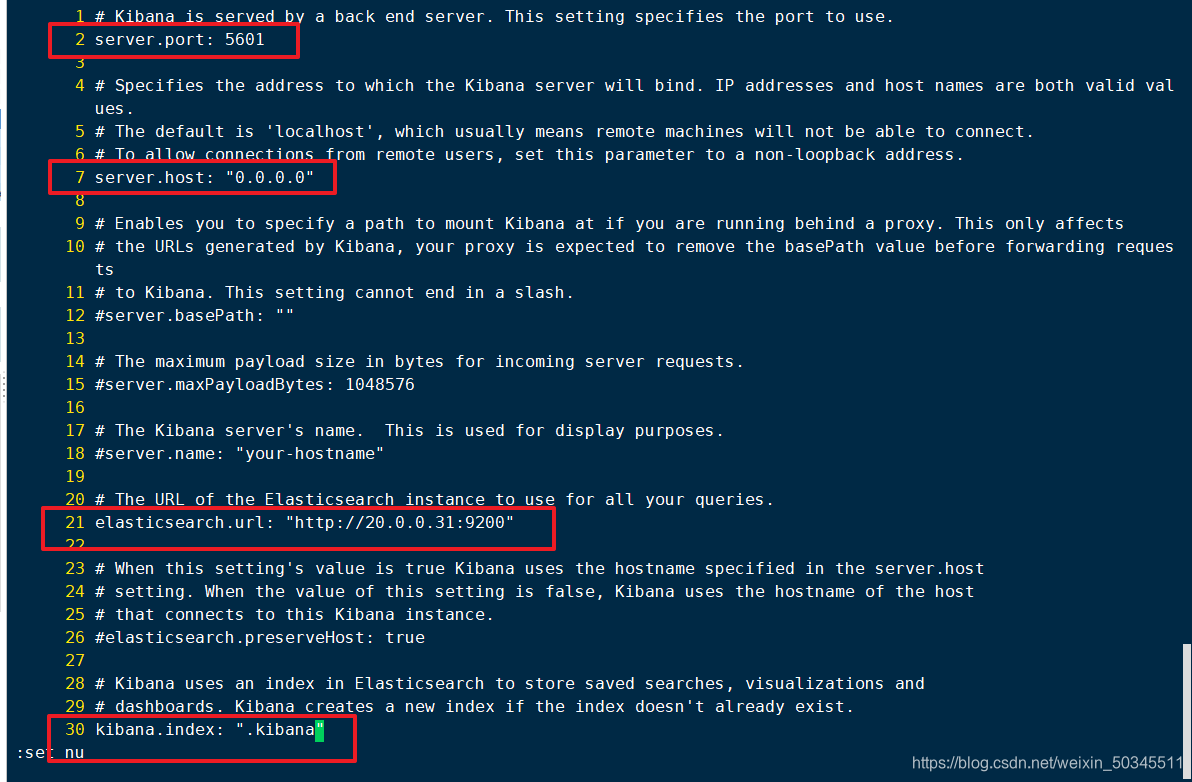
vi /etc/kibana/kibana.yml
 2 server.port: 5601           kibana打开的端口
 7 server.host: "0.0.0.0"                                   kibana侦听所有网段地址
 21 elasticsearch.url: "http://20.0.0.11:9200"     和elasticsearch建立联系
 30 kibana.index: ".kibana"                                在elasticsearch中添加.kibana索引
Dynamic kibana
systemctl start kibana.service
systemctl enable kibana.service
Three, test ELK
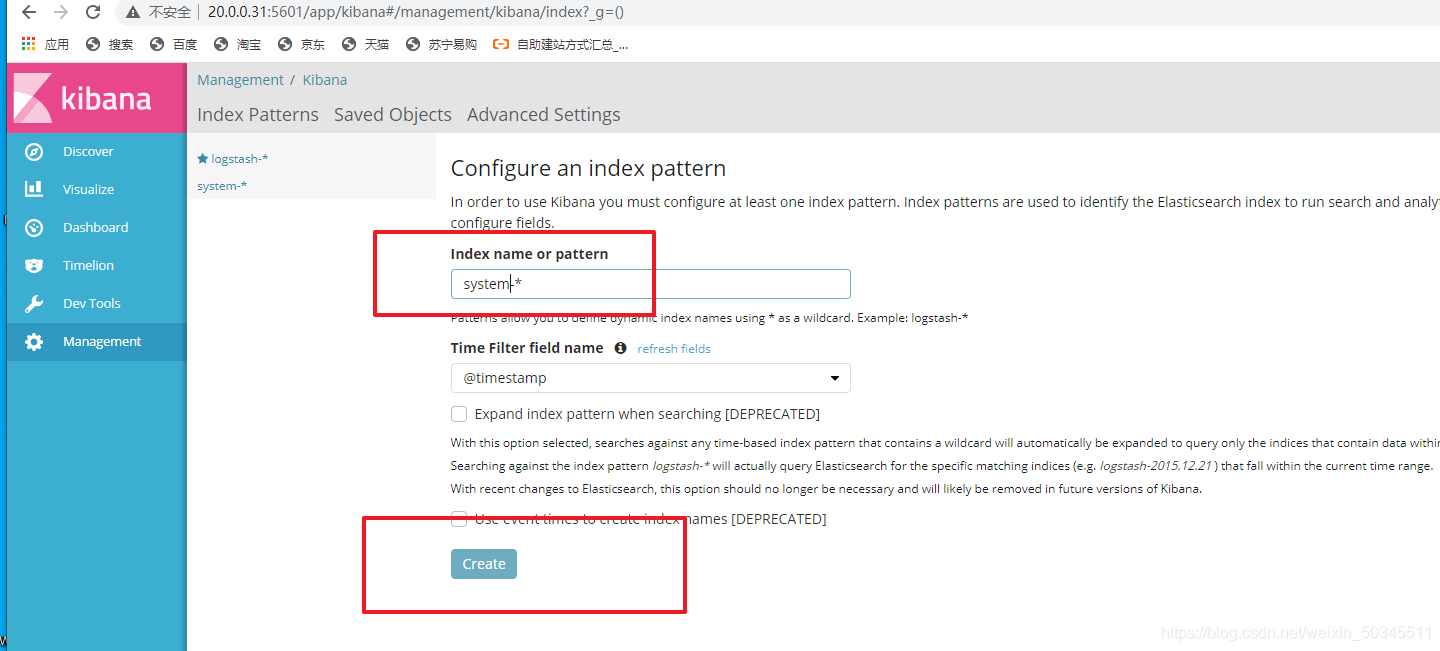
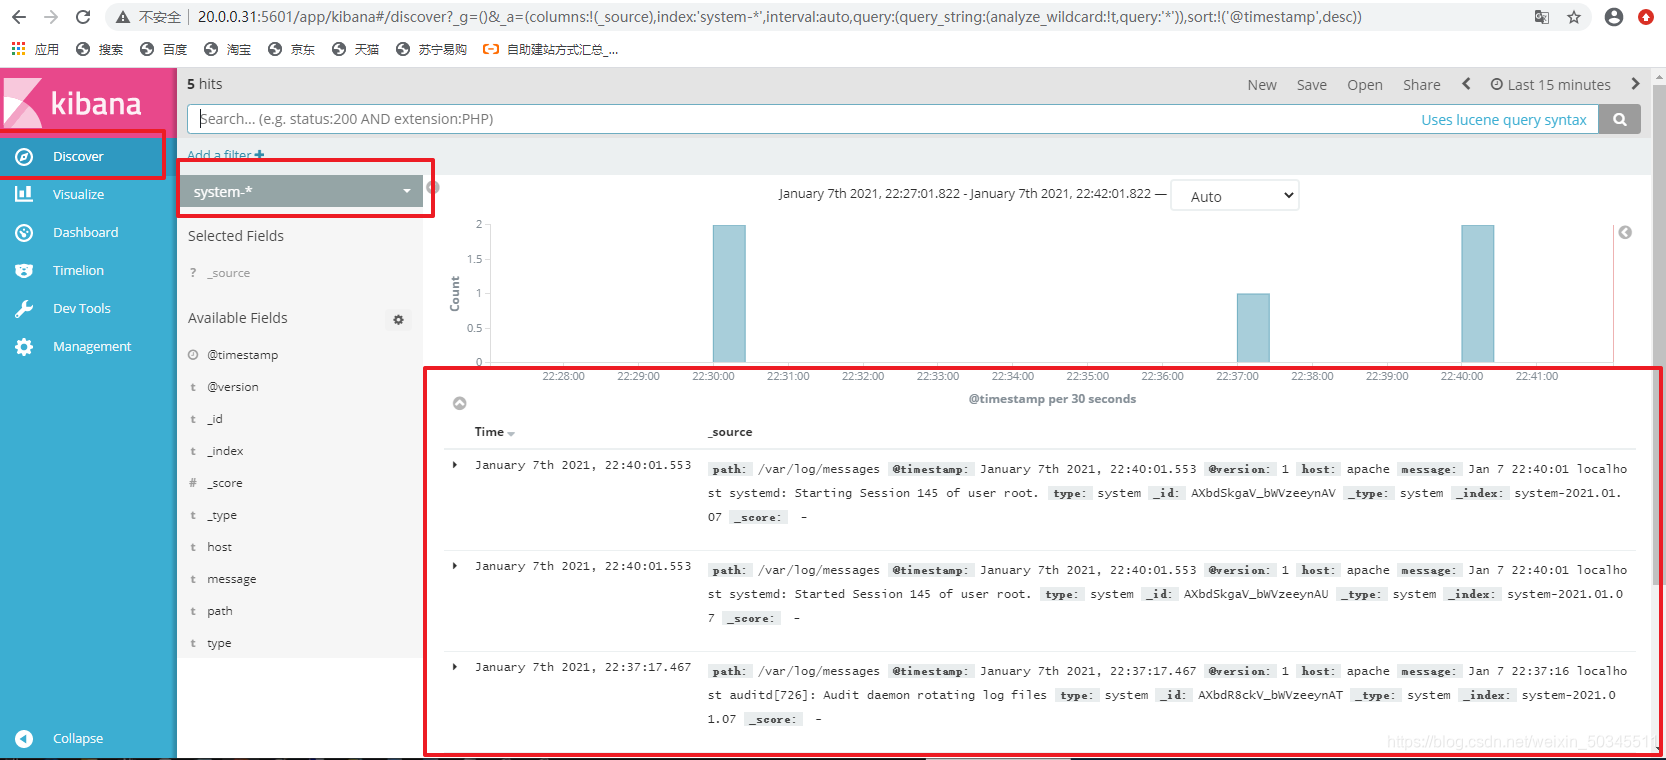
3.1 Test kibana's analysis of system log files
Enter the node1IP address in the browser and bring the port number (20.0.0.31:5601)
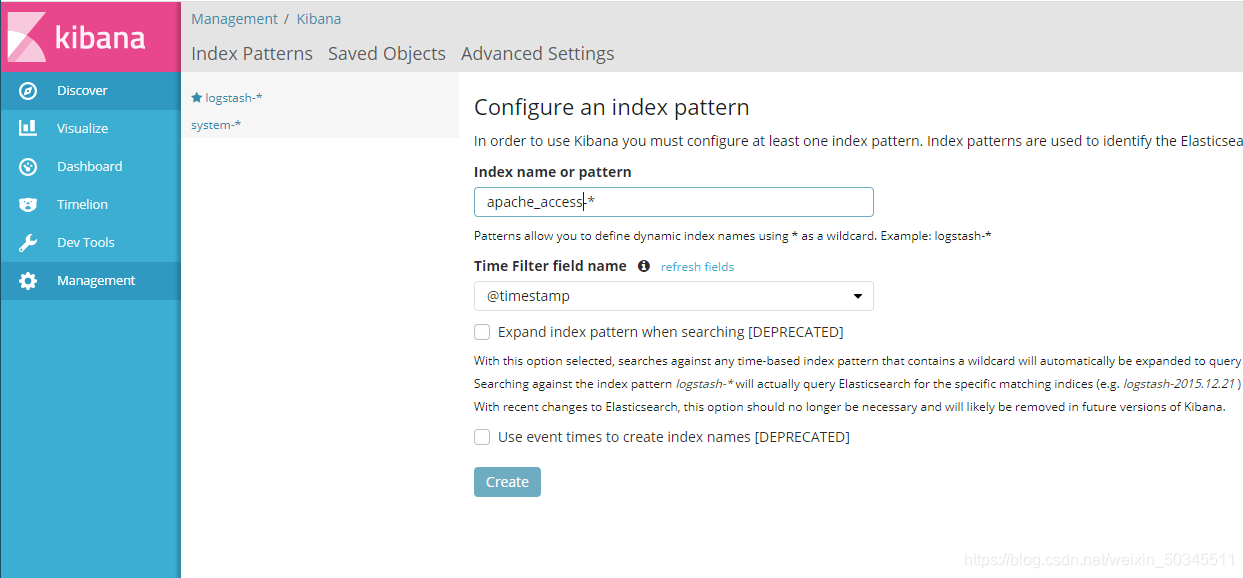
Docking system log, and click belowCreate(创建)
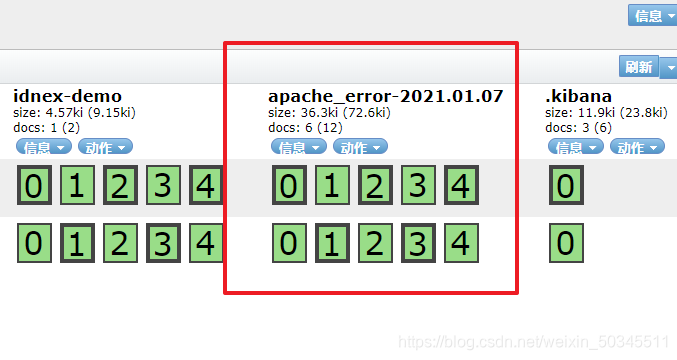
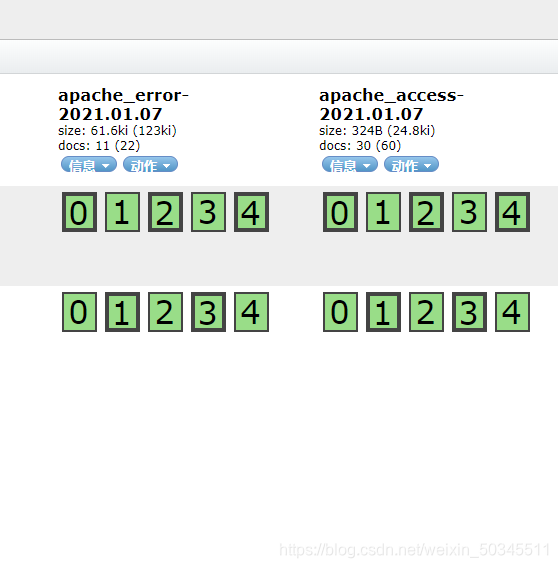
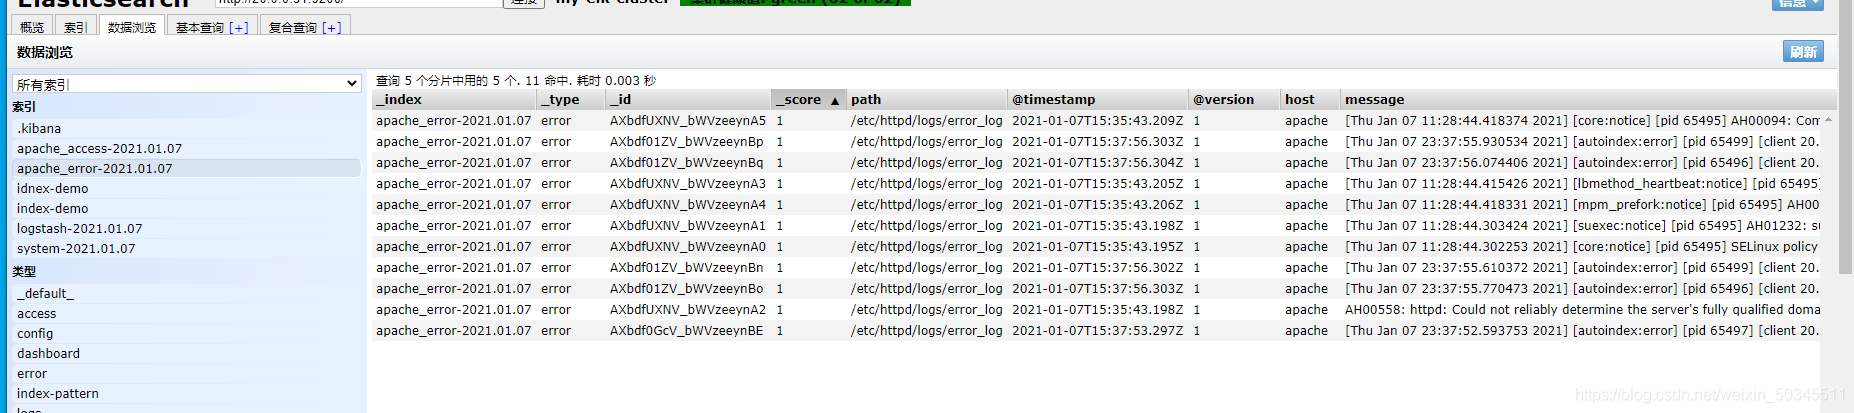
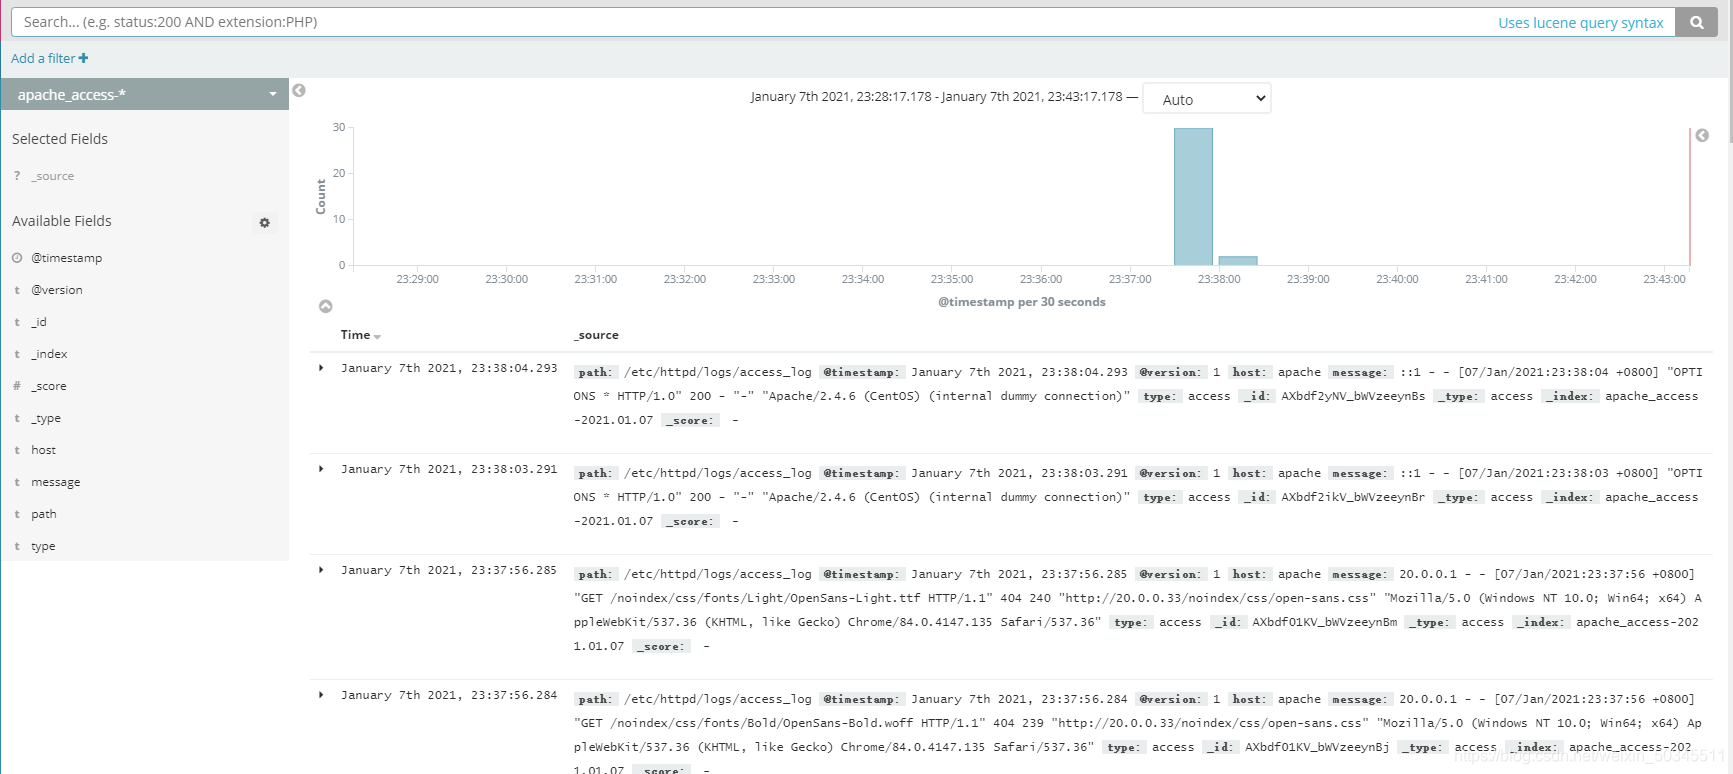
3.2 Docking with the apache log file on the apache host
vi /etc/logstash/conf.d/apache_log.conf
input {
      file{
       path => "/etc/httpd/logs/access_log"
       type => "access"
       start_position => "beginning"
       }
      file{
       path => "/etc/httpd/logs/error_log"
       type => "error"
       start_position => "beginning"
       }
     }
output {
       if [type] == "access" {
       elasticsearch {
         hosts => ["20.0.0.31:9200"]
         index => "apache_access-%{+YYYY.MM.dd}"
         }
       }
       if [type] == "error" {
       elasticsearch {
         hosts => ["20.0.0.31:9200"]
         index => "apache_error-%{+YYYY.MM.dd}"
         }
       }
     }
cd /etc/logstash/conf.d/
logstash -f apache_log.conf
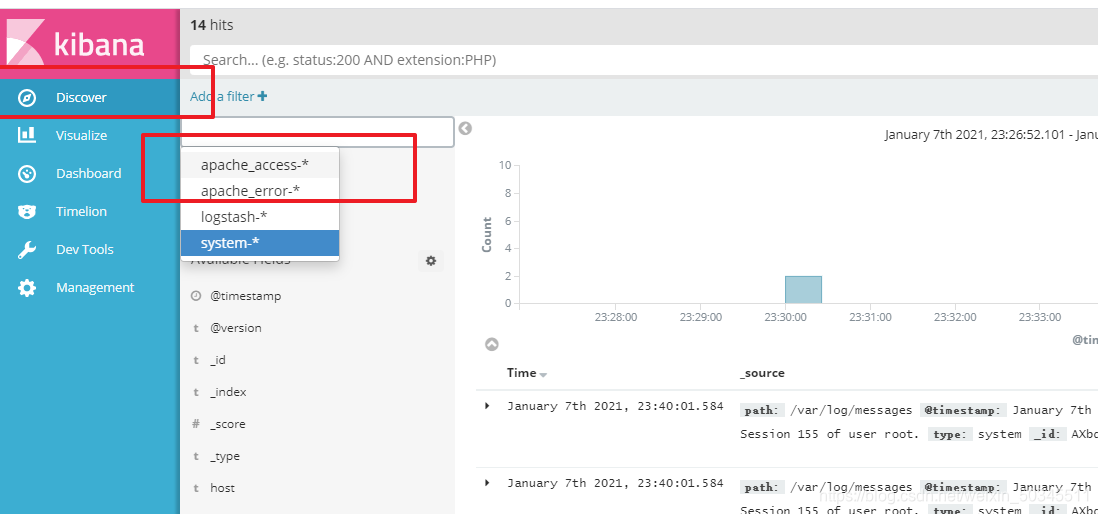
3.1 Test kibana's analysis of apache log files