Preface
Previous describes the installation configuration prometheus, we can access k8s deployed prometheus monitoring alarm system -prometheus series first article view, this will be followed by the introduction Grafana pieces of content, and the web interface guide Grafana of the physical nodes and The monitoring template of the container, and display the monitoring indicators of prometheus, and then realize the monitoring alarm through alertmanager.
Tips
This article uses the same experimental environment as the previous one. Before reading this article, you need to deploy the prometheus monitoring alarm system in k8s-the first article in the prometheus series , and do the experiment as required, so that we can continue the following contents
Machine planning:
Use the same experimental environment as the previous article:
The machine ip of the master node is 192.168.0.6, and the host name is master1
The machine ip of the node node is 192.168.0.56, and the host name is node1
Refer to the following article for master high-availability cluster installation:
k8s1.18 high-availability cluster installation-super detailed Chinese official document
Grafana installation and configuration
Download and install the image required for Grafana
Upload the heapster-grafana-amd64_v5_0_4.tar.gz image to each master node of k8s and each node node of k8s, and then manually decompress each node:
docker load -i heapster-grafana-amd64_v5_0_4.tar.gz
The Baidu network disk address where the image is located is as follows:
Link: https://pan.baidu.com/s/1TmVGKxde_cEYrbjiETboEA Extraction code: 052u
Create grafana.yaml on the master1 node of k8s
cat >grafana.yaml << EOFapiVersion: apps/v1kind: Deploymentmetadata: name: monitoring-grafana namespace: kube-systemspec: replicas: 1 selector: matchLabels: task: monitoring k8s-app: grafana template: metadata: labels: task: monitoring k8s-app: grafana spec: containers: - name: grafana image: k8s.gcr.io/heapster-grafana-amd64:v5.0.4 ports: - containerPort: 3000 protocol: TCP volumeMounts: - mountPath: /etc/ssl/certs name: ca-certificates readOnly: true - mountPath: /var name: grafana-storage env: - name: INFLUXDB_HOST value: monitoring-influxdb - name: GF_SERVER_HTTP_PORT value: "3000" # The following env variables are required to make Grafana accessible via # the kubernetes api-server proxy. On production clusters, we recommend # removing these env variables, setup auth for grafana, and expose the grafana # service using a LoadBalancer or a public IP. - name: GF_AUTH_BASIC_ENABLED value: "false" - name: GF_AUTH_ANONYMOUS_ENABLED value: "true" - name: GF_AUTH_ANONYMOUS_ORG_ROLE value: Admin - name: GF_SERVER_ROOT_URL # If you're only using the API Server proxy, set this value instead: # value: /api/v1/namespaces/kube-system/services/monitoring-grafana/proxy value: / volumes: - name: ca-certificates hostPath: path: /etc/ssl/certs - name: grafana-storage emptyDir: {}---apiVersion: v1kind: Servicemetadata: labels: # For use as a Cluster add-on (https://github.com/kubernetes/kubernetes/tree/master/cluster/addons) # If you are NOT using this as an addon, you should comment out this line. kubernetes.io/cluster-service: 'true' kubernetes.io/name: monitoring-grafana name: monitoring-grafana namespace: kube-systemspec: # In a production setup, we recommend accessing Grafana through an external Loadbalancer # or through a public IP. # type: LoadBalancer # You could also use NodePort to expose the service at a randomly-generated port # type: NodePort ports: - port: 80 targetPort: 3000 selector: k8s-app: grafana type: NodePortEOF
Update grafana via kubectl apply
kubectl apply -f grafana.yaml
Check whether grafana is successfully deployed
kubectl get pods -n kube-system
The display is as follows, indicating that the deployment was successful
monitoring-grafana-7d7f6cf5c6-vrxw9 1/1 Running 0 3h51m
View grafana's service
kubectl get svc -n kube-system
The display is as follows:
monitoring-grafana NodePort 10.111.173.47 <none> 80:31044/TCP 3h54m
You can see above that the host port exposed by grafana is 31044
We can access the web interface of grafana by visiting the master node ip of the k8s cluster: 31044
Grafan interface access to prometheus data source
1) Log in to grafana and visit in the browser
192.168.0.6:31044
The account password is admin
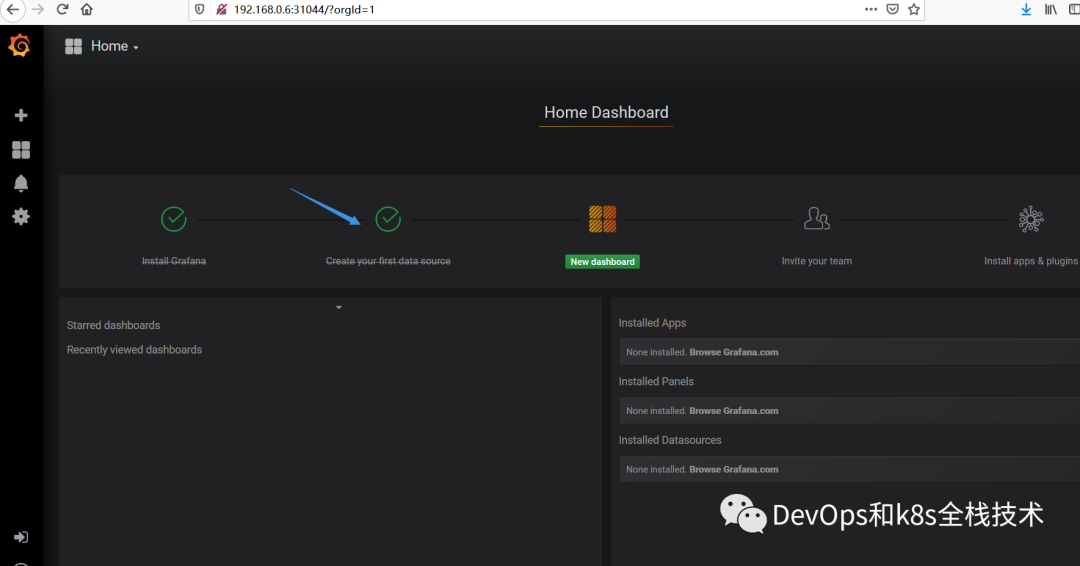
You can see the following interface:
2) Configure the grafana interface:
start configuring the grafana web interface:
select Create your first data source
Appears as follows
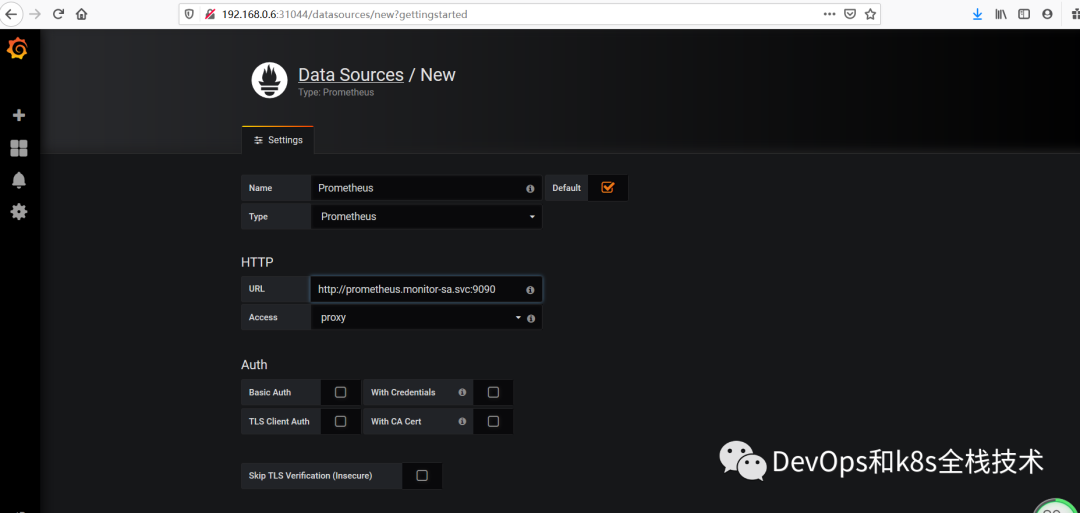
Name: Prometheus
Type: Prometheus
The URL at HTTP is written as follows:
http://prometheus.monitor-sa.svc:9090
The configured overall page is as follows:
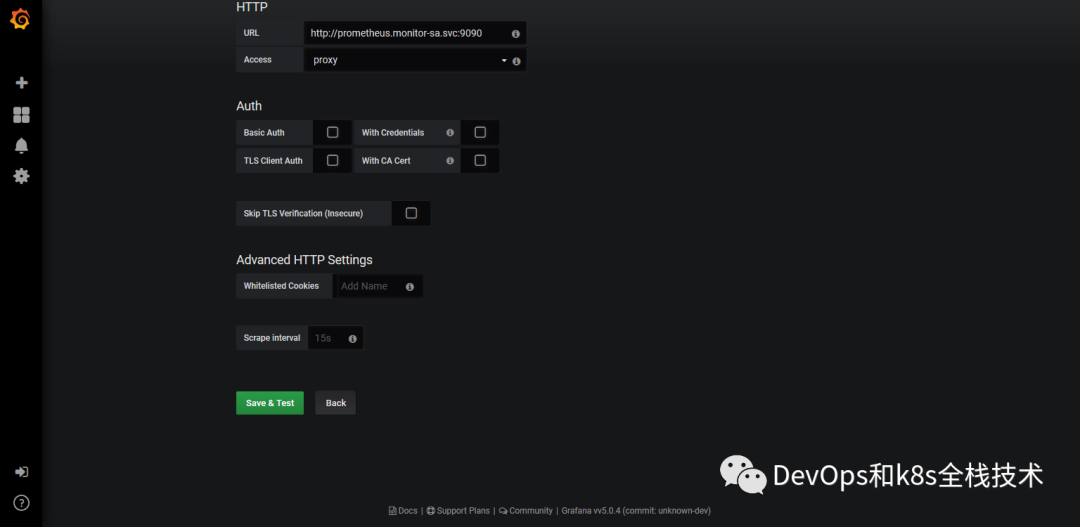
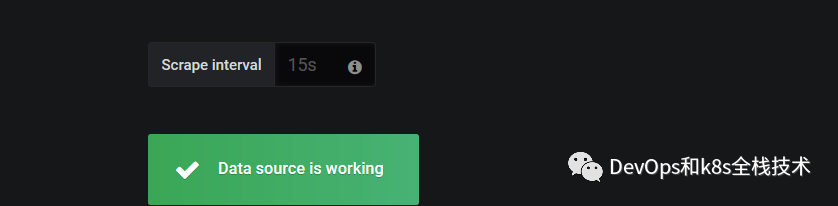
Click Save & Test in the lower left corner, and the following Data source is working appears, indicating that the prometheus data source is successfully accessed by grafana
导入监控模板,可在如下链接搜索
https://grafana.com/dashboards?dataSource=prometheus&search=kubernetes
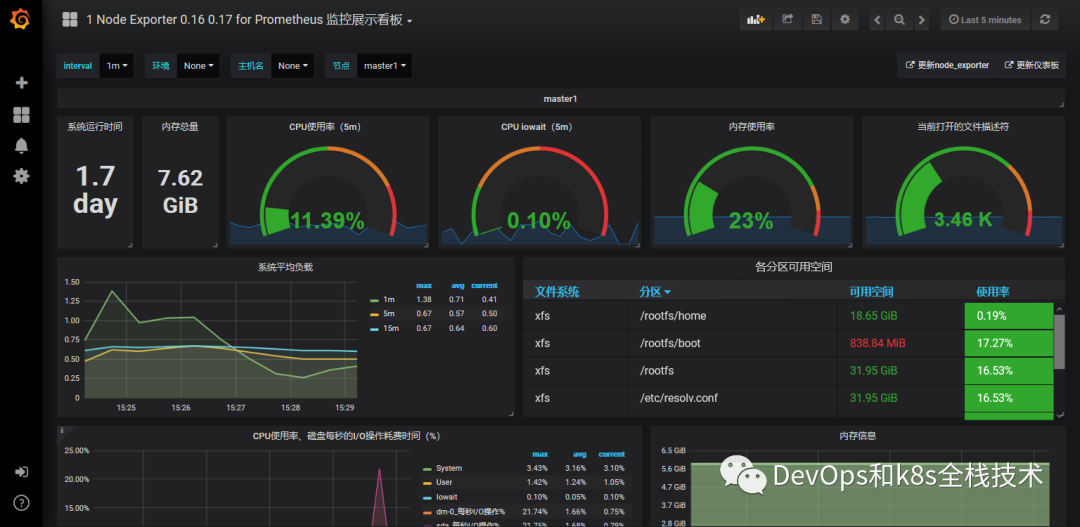
也可直接导入node_exporter.json监控模板,这个可以把node节点指标显示出来
node_exporter.json在百度网盘地址如下:
链接:https://pan.baidu.com/s/1vF1kAMRbxQkUGPlZt91MWg 提取码:kyd6
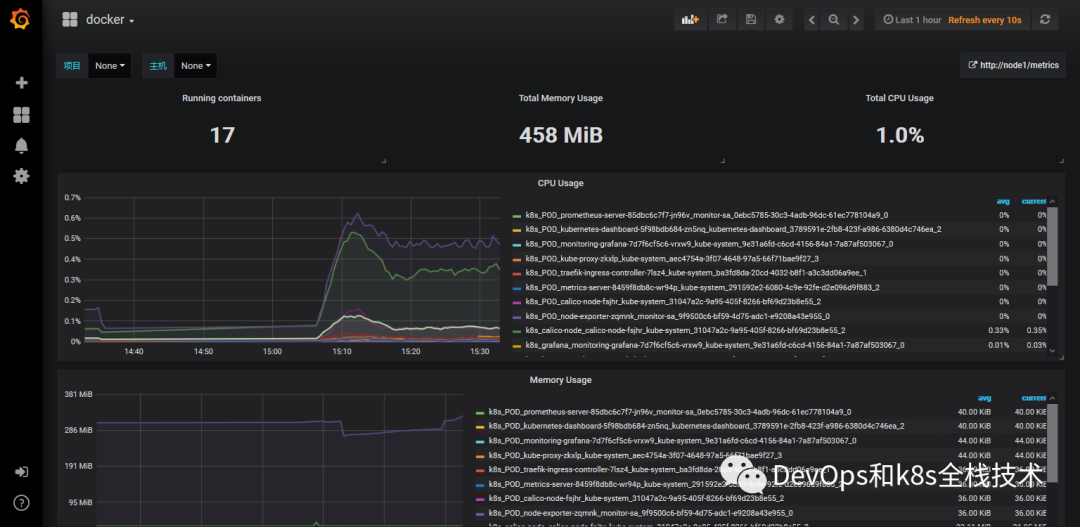
还可直接导入docker_rev1.json,可以把容器相关的数据展示出来
docker_rev1.json在百度网盘地址如下:
链接:https://pan.baidu.com/s/17o_nja5N2R-g9g5PkJ3aFA 提取码:vinv
怎么导入监控模板,按如下步骤
上面Save & Test测试没问题之后,就可以返回Grafana主页面
点击左侧+号下面的Import,出现如下界面
选择Upload json file,出现如下
选择一个本地的json文件,我们选择的是上面让大家下载的node_exporter.json这个文件,选择之后出现如下
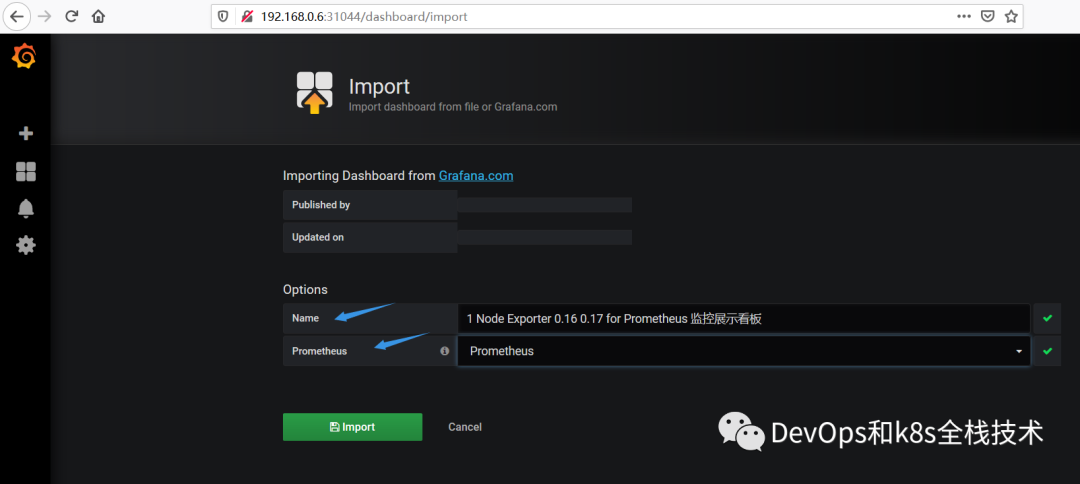
注:箭头标注的地方Name后面的名字是node_exporter.json定义的
Prometheus后面需要变成Prometheus,然后再点击Import,就可以出现如下界面:
导入docker_rev1.json监控模板,步骤和上面导入node_exporter.json步骤一样,导入之后显示如下:
Seeing this, we have successfully deployed and configured Grafana, and successfully accessed the prometheus data source, but don’t worry, this is a serial article, the next article will follow this content to introduce Alertmanager , and realize alarms through alertmanager , please Continue to pay attention to my official account, I will continue to share the latest knowledge with you.