1. Equipment composition
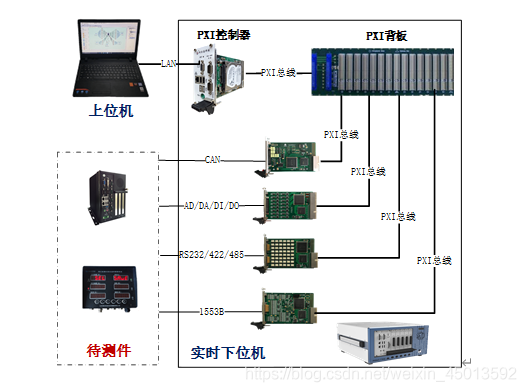
The ETest_RT system is mainly composed of a hardware part and a software part. The hardware part is composed of an upper computer and a real-time lower computer. The upper computer uses a commercial portable computer, and the lower computer uses a PXI measurement and control computer. The upper computer installs the Windows operating system, runs equipment resource management, test design, test scheduling, runs the server, data center, runs the client, and real-time action download debugger; the lower computer installs the real-time operating system, runs the loader module, the real-time process module, Uploader module; the lower computer is connected to the system under test through various PXI interface boards. The schematic diagram of the hardware structure of the ETest_RT system is shown in the figure below.
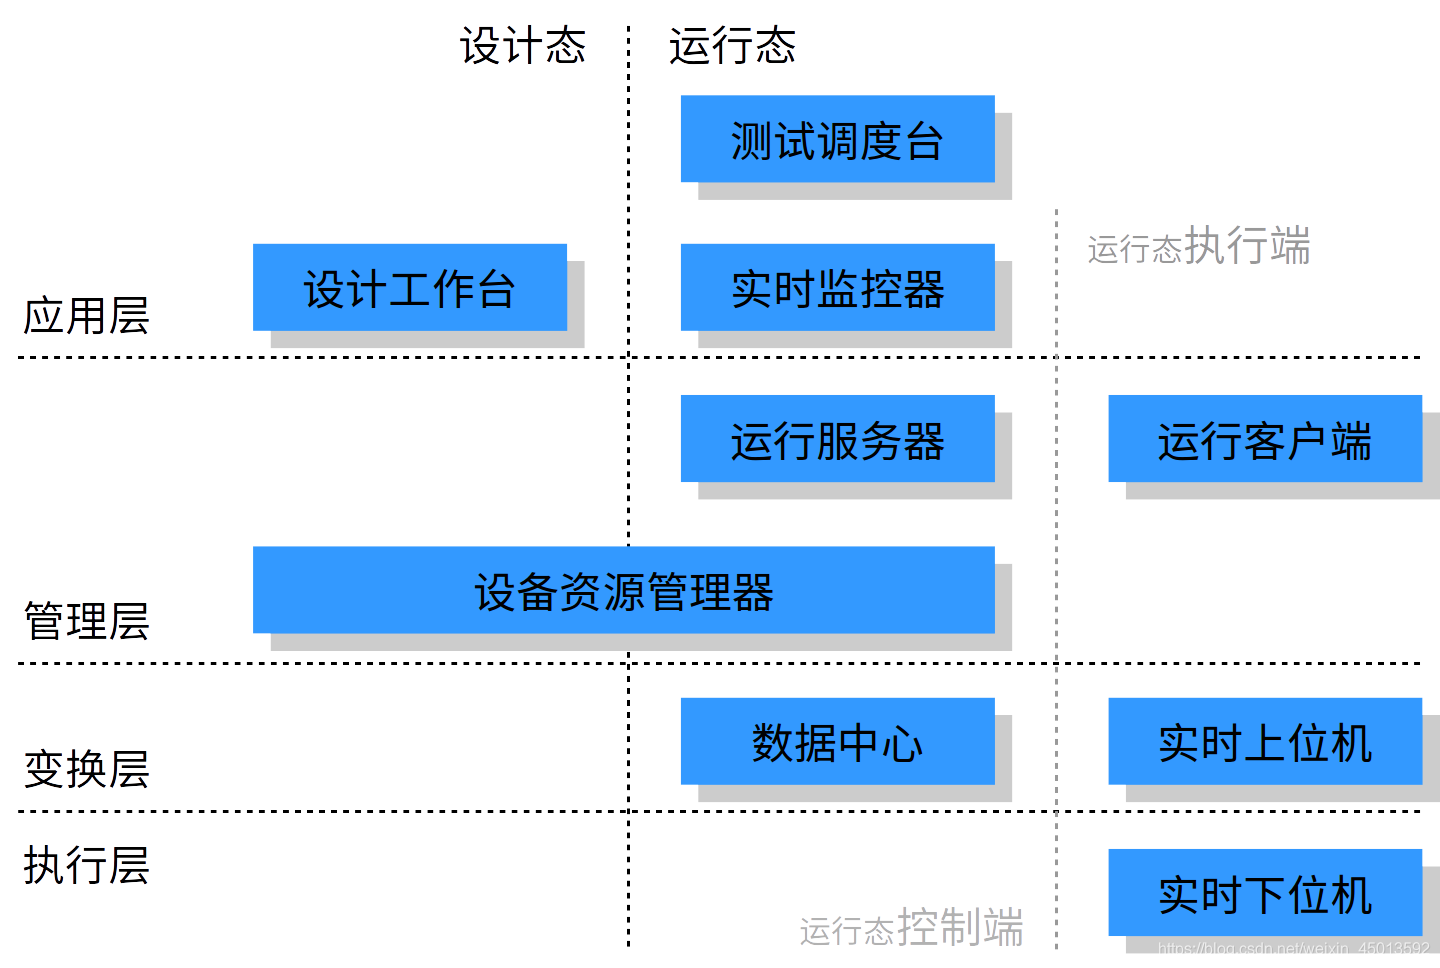
ETest_RT adopts a component-based and layered software development framework. The underlying software code is based on the GCC/CMake development environment and is developed in C++ language; the upper-level software integration framework is based on the Micosoft Visual Studio development environment and is developed in C# language, forming the form shown in Figure 3-2. Hierarchical structure.
The system is designed in a way that gradually improves the abstraction level from hardware to user, and is divided into application layer, management layer, transformation layer and execution layer.
Application layer: The user handles the test business. To the above, it shields users from the underlying implementation technology of the system, allowing users to focus on the test itself without having to pay attention to the technical details of the system. Next, it calls various data, publishes test scripts, and directs the start or stop of tests.
Management layer: The system receives instructions from users at the application layer, and schedules and coordinates test actions according to logical units. On the top, it shields the deployment details of the system for the application layer, so that the application layer does not have to change for deployment differences; on the bottom, it distributes data and instructions to various components.
Transformation layer: The system completes the mapping and transformation of logical concepts to physical entities. On the top, it shields the work details of physical devices for the management layer and provides data organized in logical units; on the bottom, it issues specific hardware operation instructions to the execution layer.
Execution layer: The system performs actual physical actions. On the top, it reports the input data and status information of the physical device; on the bottom, it operates the hardware to interact with the system under test.
Software is divided into design state and running state. When the system is working in the design state, it is not necessary to carry out a complete software and hardware deployment. It is used to plan test scenarios, design test plans, draw up test cases, write test scripts, prepare test data, and design data monitoring.
When the system is working in the running state, the relevant software and hardware must be deployed according to the design requirements of the test plan. It is used to implement test plans, run test cases, execute test actions, monitor real-time data, obtain test reports, and obtain test results. The running state can be divided into the control end and the execution end according to the position where it is deployed between the DUT and the user, and the execution end does not need to be manually watched when working.
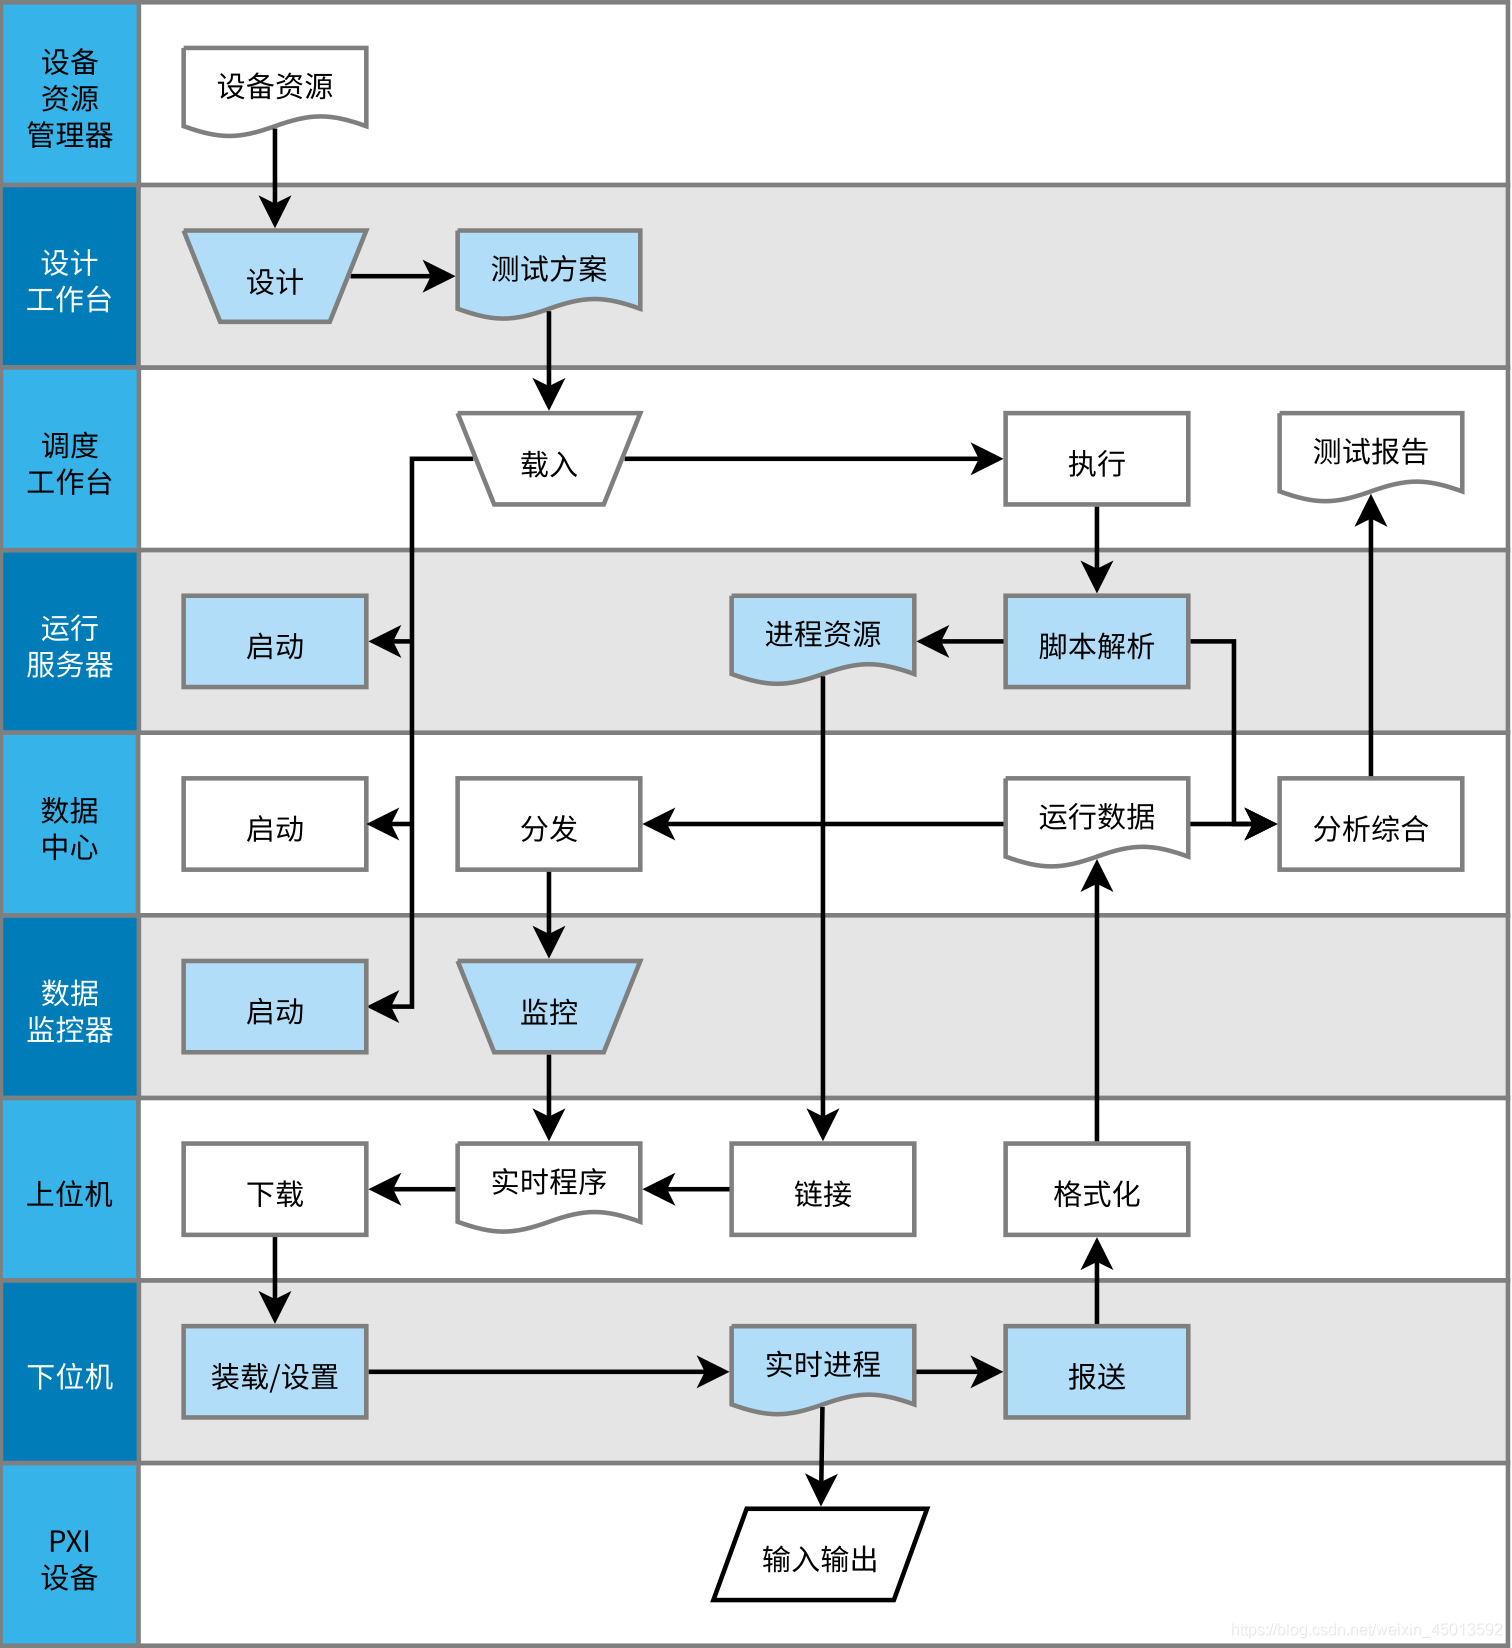
The steps for using the ETest_RT platform to test equipment embedded system software are as follows (see Figure 3-3):
First, use the equipment resource manager to plan equipment resources, use the test design software to build the system under test model, design test cases and data, Form a test plan file.
After the test schedule is loaded into the test plan, the server, data center, and data monitor are started and operated.
The running server parses the test scripts to form test process resources, which are compiled and linked by the real-time upper computer subsystem and downloaded to the real-time lower computer.
The real-time lower computer loads the real-time script and forms a real-time process through parameter setting. During the test, the real-time process interacts with the system under test through various boards in the form of PXI bus; during the
test execution process, the real-time lower computer progresses to the real-time upper position The computer part reports all kinds of data to the data center, and the data center distributes all kinds of operating data to the data monitor and the dispatching workbench.
During the test, the test data can be monitored, analyzed and evaluated through test data recording and viewing software and test monitoring software.
2. Main functions of each module
(1) Hardware part
The hardware consists of an upper computer and a real-time lower computer. The upper computer uses a commercial portable computer, and the lower computer uses a PXI measurement and control computer. The interface board is directly connected to the test lower computer through the PXI interface, forming a test environment that can meet the requirements of multiple types of interfaces. The indicators of the main hardware parts are as follows:
① PXI chassis
Compact 9-slot PXI chassis with 1 system slot, 1 trigger bus trigger slot and 7 PXI/Compact PCI peripheral slots
0°C to +50°C wide temperature operating range
41.6dBA ultra-low operation Noise
Intelligent chassis management
5.9kg lightweight aluminum/steel structure
Size: 280mm×177mm×303mm
350W industrial-grade AC power supply
Power supply, temperature and fan monitoring LED
② PXI controller
Intel® Core™ 2 Duo P8400 2.53GHz processor
Support VGA+DVI dual display
Dual channel DDR3 SODIMM 16GB
Maximum system throughput 132 MB/s
Integrated SATA hard disk 250G
Integrated I/O
Programmable watchdog Timer
③ 1553B bus board
Dual-channel multi-function, each channel is dual-redundant A and B channels
Support 1M/2M/4Mbps and user-defined baud rate
Frame interval and message interval time can be set by software
Support timestamp, resolution 1μs
Support self-test, error injection
Support interrupt and external trigger
BC mode (bus controller)
BC frame programmable
message interval programmable
non-periodic message can be dynamically inserted
data double buffer
programmable
BusA, BusB Optional
Support branch jump message
Support error injection
RT mode (remote terminal)
Single data buffer
Double data buffer
Sub-address cycle data buffer
Illegal command programmable
Support error injection
BM mode (bus monitor)
100% message logging
programmable filtering of monitoring data
receiving timestamp
④ ARINC429 bus interface board
Number of channels: flexible configuration of the number of channels, maximum 8 sending and 8 receiving
Communication rate: 100Kbps, 12.5Kbps, 50Kbps, 48Kbps, 98Kbps
Inter-word interval: 4bits, programmable
⑤ CAN bus board
2 channels
Communication rate: Support any baud rate between 1Kbps~1Mbps
Support two-way transmission, CAN sending and CAN receiving
Compatible with CAN2.0A and CAN2.0B protocols
⑥ RS232/RS485/RS422 bus interface board
Number of channels: flexibly configure the number of channels, up to 4 channels
Communication rate: up to 8Mbps
Communication protocol: RS232/422/485 (software setting)
⑦ Analog input AD
8 channels of parallel sampling
ADC resolution: 16 bits
Maximum sampling rate: 100KS/s
Program control of measuring range
Capacity storage: 4MSa/channel
⑧ Analog output DA
8 channel analog output
DAC resolution: 16 bits
16 channels TTL/COMS digital IO, input/output can be programmed
2 channels 32bit counter
⑨ Digital input/output
32-channel TTL/COMS level compatible digital I/O
Each channel is optically isolated
The highest transmission rate is 1MHz
Mass storage 4MB/channel
⑩ Host computer
CPU: dual-core i5-6200U 2.3GHz
Memory: DDR4 2133MHz, 8GB
Solid state drive: 256GB
Display screen: 14 inches, resolution 1920*1080
Independent video memory: 2GB
(2) Design workbench
The design workbench models the system to be tested and its external interfaces, performs protocol editing and analysis, creates test monitoring, establishes hardware planning, creates and manages test cases, and determines the number of interface devices to be prepared for testing. Its main functions include:
Carrying out test plan management, the operations for the test plan include: create a plan, open a plan, and save a plan.
Each test plan can contain one or more test items. The existence of multiple test items enables each test plan to complete the design of multiple test items, which facilitates the integration test of multiple configuration items into the system.
The test project has operations of creating, renaming, deleting and viewing attributes.
Graphically describe the system under test, the peripheral system and the external interface of the system under test, including the number and type of interfaces, including RS422, 1553B, CAN, AD, DA, DI, DO, CT, Freq-CT, TCP and other types; able to set interface parameters.
Create an interface protocol, and use the protocol description language to describe the protocol, including packet header, packet tail, check, etc., describe each field type and encoding method, as well as branch, loop and other structures.
In order to meet the needs of various data communication, the protocol field has a wealth of types, including: integer (unsigned and signed, 8-bit/16-bit/32-bit/custom length), floating-point type, Boolean type, conditional statement Type, branch statement type, calculated field, check field, array field.
Create test monitoring, describe the monitoring content and display form of real-time data monitoring, and set alarm conditions.
Users can add test monitoring to the test monitoring module and add data monitoring instruments on the monitoring panel, and bind the protocol fields of different types of monitoring instruments or the results of field calculations according to a certain formula, so as to monitor the pointers or values of the instruments at runtime The change of the data visually shows the change of the data during the test communication.
The test monitoring toolbar manages all test monitoring instruments, including digital meters, disc meters, graphs, enumerated types, etc. Select the appropriate monitoring instrument and drag it to the appropriate position on the monitoring panel to add the monitoring instrument to the monitoring panel. Drag the edge of the monitoring instrument with the mouse to adjust its size.
Open the "Properties" tab, you can modify the properties of the test instrument. The most important attribute is the "protocol segment" attribute, which indicates the data source of the monitoring instrument.
Through the expand button on the right side of the "Protocol Segment" property, you can open the "Binding Data Protocol" dialog box, which displays all the protocols and protocol segments in the simulation model of the current project.
The data source of the test instrument can be either a protocol field or a formula composed of several protocol fields.
Enter the protocol field or the formula composed of the protocol field in the input box at the lower part of the "Binding Data Protocol" dialog box. Double-click the desired field name to add the field name to the cursor position of the custom formula.
Create a test hardware plan, determine the interface board equipment to be used for the test, and the resources corresponding to the interface board equipment.
Create test cases and provide management methods for test cases, including grouping, deleting, renaming, etc.
The content of creating test cases, including the use of test scripts to describe the test process, including variable definitions, conditional statements, loop statements, output statements, mathematical operations, function definitions, etc.
Provides an extended interface for test scripts, which can realize data interaction and automatic data analysis to the DUT, and parse the bit stream into meaningful user data.
Provide a way of timing control, and be able to perform specified operations in accordance with a certain timing.
Provide the operating environment setting method, set the IP address and port number of the simulation model server, data center server, test execution server and client during the test operation.
Provide the function of configuring standard input and output monitoring, and determine the type configuration of standard input and output monitoring.
Provide a test script execution mode, which can run the test script selected by the user; the user can choose to terminate the script running.
Able to view output information and error information.
(3) Test and run the service software
Test operation service software includes test dispatching station, operation server and data center. They cooperate with client software to drive test data and perform automated test execution. Mainly realize the following functions:
Provide process scheduling service background running program, with the help of process scheduling agent, according to the design of the test design software, start the test execution, client, server and other processes on the test host, and coordinate through the process scheduling service The operating logic of each software.
Provide the background running program of the simulation model server, analyze the simulation model established by the test design through the simulation model server, and realize the simulation analysis service of data transmission and reception during test execution.
Provide the data center server background running program. During the execution of the test case, the data center server will centrally and uniformly process the receiving and sending receipts in the channel to ensure the distributed realization of data monitoring.
Provide the use case server background running program to analyze and process the execution process of the test cases written in the test design.
Provide standard input and output monitoring window program, which can display the debugging information during the operation of simulation model server, data center server, client process and use case server.
Analyze the variable definitions, conditional sentences, loop sentences, output sentences, mathematical operations, function definitions and other sentences in the test script, and perform corresponding operations.
Analyze the test script extension interface to realize data sending/receiving and data analysis to the system under test.
Analyze the test script and operate in accordance with the timing control requirements.
Record all input data when the test is started; record all input/output data during the test; automatically generate a summary report after the test is completed.
Immediately stop the execution of test cases according to user requirements.
Record and display the execution results of test cases.
(4) Run the client and data monitor
The running client is between the test execution server and the host computer, executes the communication agent, is responsible for data forwarding and client test process management and control, and extracts environmental data for the host computer. The data monitor displays the current test data in the form of virtual instruments or graphs. The two modules mainly implement the following functions:
Manage the real-time subsystem and establish the connection relationship between the real-time subsystem and the running control terminal.
Provide operating resources for the real-time subsystem.
After logging in to the test service software, all test monitoring interfaces designed by the test design software are displayed, and one or more test monitoring panels can be selected for test monitoring.
Run the specified test monitoring, display the specified test data in real time during the test execution, and provide data monitoring methods such as digital instruments, dashboards, enumeration items, and graphs.
It can display the test data in test execution in real time;
It can display the test data in the parsed protocol data format, or it can display the test data in binary, octal, hexadecimal.
Data filtering conditions can be set to realize the function of displaying specific data on the interface.
Data alarm conditions can be set. When a certain characteristic data appears, the software will display the data that meets the alarm conditions in a conspicuous form.
You can query data, you can query the message of a certain period of time, or you can query the data of a certain protocol field.
You can perform statistics on the specified data, and you can also view the data curve graph.
(5) Equipment resource management
The equipment resource management software module provides the test equipment and channel management functions supported by the system, and provides an interface for system equipment expansion. It mainly realizes the following functions:
Add and delete system equipment.
Modify the number of system equipment.
Add and delete channels included in the device.
Modify the number and type of channels included in the device.
Save the device information to the device resource file and use it in the test design software.
(6) Real-time upper computer of the execution end in running mode
The execution end of the running state is the key subsystem to realize real-time performance, including real-time upper computer and real-time lower computer. Its form is shown in the figure below (the dashed box is the other part of the system): the
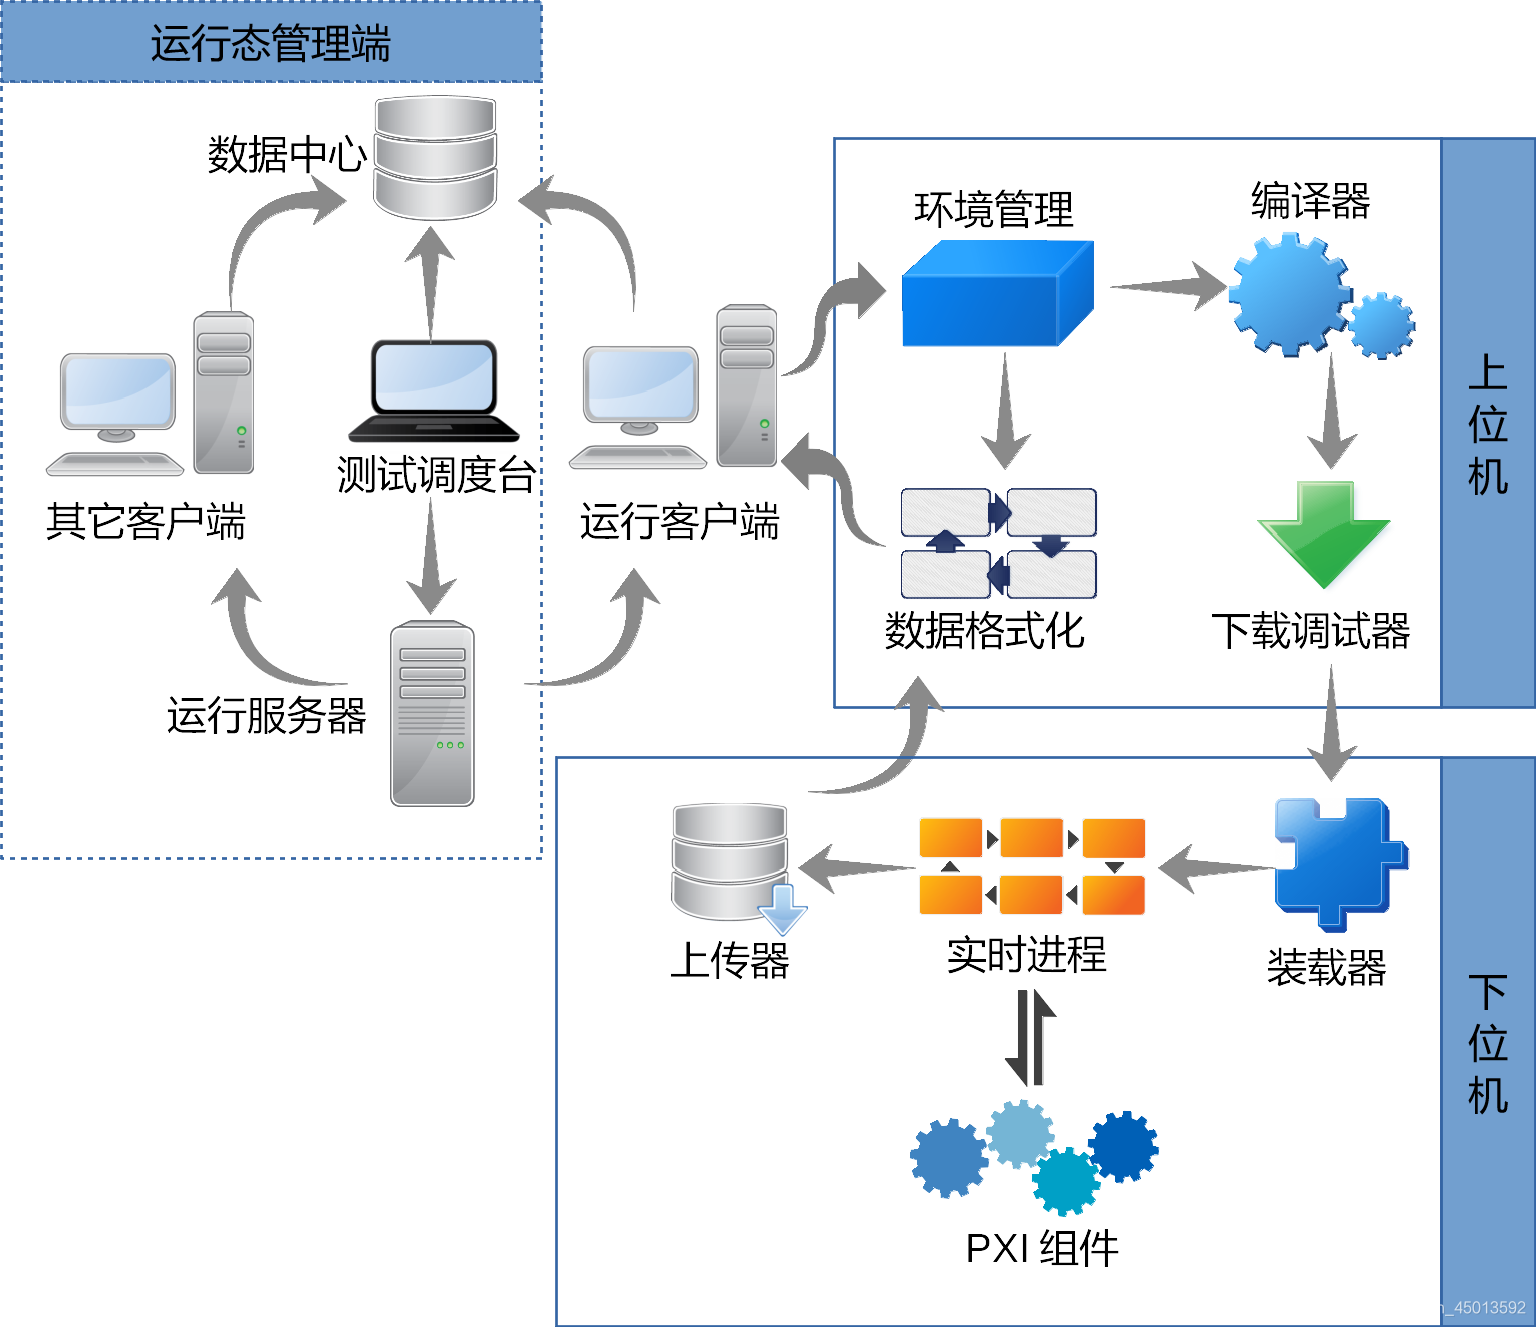
real-time host computer has modules such as environment management, compiler, download debugger, and data formatting.
The environmental management module manages all input metadata. These data are used for script analysis and data formatting. The design of environmental management is required by the principle of integration. Environmental data is currently known in the following categories: equipment planning, protocol descriptions, simulation models, and action scripts.
The compiler, the metadata provided by the comprehensive environment management, compiles and generates the binary code that can be run by the real-time operating system of the lower computer. Since the main compilation work has been completed in the design state, here is mainly linking. The main contents of the compiler work are: extract the test model as a "real-time action script language" object; global optimization; link the three parts of simulation model, protocol description language, and RASL, join the main frame to form a real-time program; when the system is placed When debugging, embed debugging information.
Download the debugger and send the compiled result of the compiler to the lower computer. When the system is in the debugging state, the real-time action script is debugged. The debugger supports the following functions: remote debugging, program loading, program hooking, manual interruption, breakpoint setting, variable observation and single-step execution.
Data formatting, formatting the data uploaded to the data center, mainly using environmental management data to restore metadata such as names and structures.
(7) Real-time lower computer of the execution end in running mode
The real-time lower computer of the execution end of the running state includes modules such as loader, real-time process and uploader.
The loader of the lower computer receives the program from the upper computer, sets the environment, loads and starts the code. It can receive instructions from the host computer to notify the program to close. When the system is in the debugging state, start the debugging stub for the upper computer debugger to connect.
The real-time process of the lower computer is generated by the loader to start the upper computer program, which specifically completes the real-time test action. The main frame of the code of the real-time process is fixed and stored in the compiler of the host computer in the form of a static library. After embedding simulation code and testing action code in the main frame, a complete program is formed. Therefore, the real-time process has universal basic communication capabilities, including the ability to receive the close command of the loader and send relevant data to the uploader. When the system is in debugging mode, the real-time process will contain the necessary debugging code.
The uploader of the lower computer receives data from the real-time process and asynchronously uploads it to the upper computer.
(8) Auxiliary tools
Tool software provides some commonly used software tools for embedded system testing, mainly including the following software modules:
Curve data generation tool: with curve data editing, coordinate selection, curve data reading, curve data storage and other functions, it can cooperate with the test execution software , Provide a test data generation method.
Test data recording and viewing tool: During test execution, it can record test execution data for viewing and analysis after the test execution, including protocol selection, data filtering, and alarm condition setting functions.
Application protocol generation tool; provides tabular editing function of application protocol, and can set the field composition, field type, field default value, etc. of the protocol.
CRC plug-in diagnostics and CRC plug-in generator: provide the design function of CRC check algorithm, can design a custom CRC algorithm, diagnose its correctness, and finally form the CRC field algorithm plug-in in the protocol description language.