clear all
clc
x1=linspace(0,10);
y1=normpdf(x,7,1);
plot(x1,y1,'k');
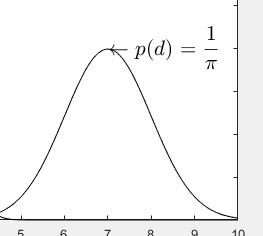
text(7,0.4,'$$\leftarrow p(d)=\frac{1}{\pi}$$','interpreter','latex','fontsize',16)
Here is the latex command displayed in matlab, where 7,0.4 represents the display position, the two $$ letters represent the meaning of the formula, leftarrow represents the arrow, \frac represents the division sign, {1}{\pi} two flowers The parentheses represent the numerator content and the denominator content respectively, latex represents latex instructions, fontsize represents font size, and 16 represents font size.