table of Contents
Download the installation package
Unzip to the specified location to configure environment variables
1.3.2 Set the number of threads
1.3.3 Add protocol and related configuration
2.2 Linux virtual machine settings
1 Windows
1.1 jmeter installation
Prerequisite: install and configure jdk8
-
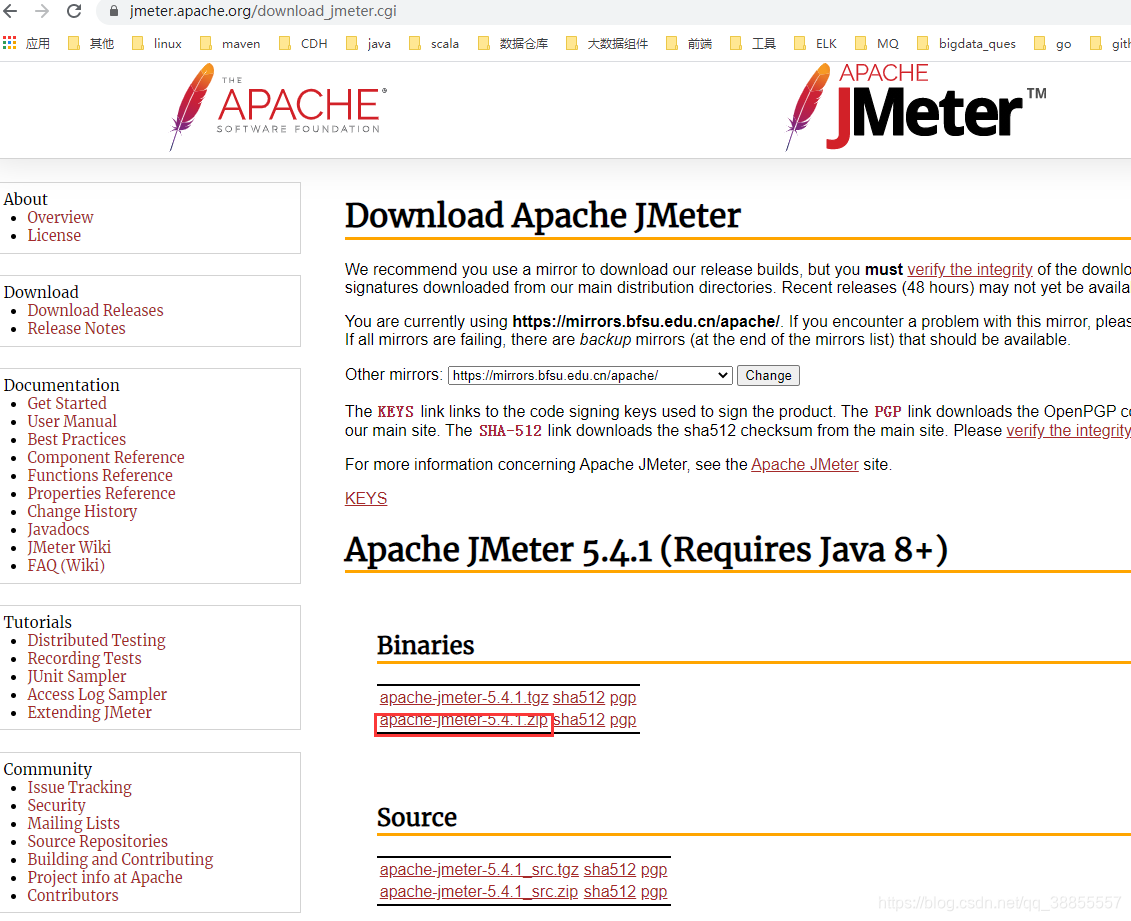
Download the installation package
Official website: https://jmeter.apache.org/download_jmeter.cgi
Unzip to the specified location to configure environment variables


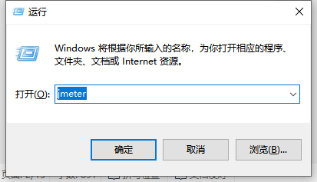
start up
Win+R
Just enter jmeter

1.2 Sinicization

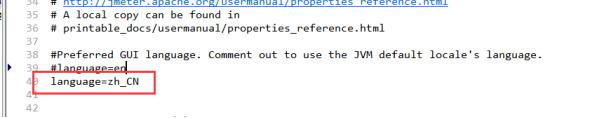
Add language=zh_CN and save and restart jmeter
1.3 Application
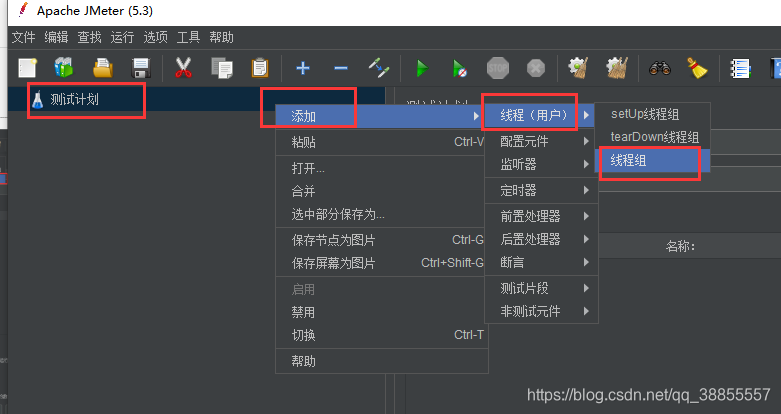
1.1.1 Create Thread Group
1.3.2 Set the number of threads

Detailed explanation of thread group parameters:
1. Number of threads: the number of virtual users. A virtual user occupies a process or thread. How many virtual users are set here is how many threads are set.
2. Ramp-Up Period (in seconds) preparation time: how long it takes for the set number of virtual users to start up. If the number of threads is 10 and the preparation time is 2, then it takes 2 seconds to start 10 threads, that is, 5 threads per second.
3. Number of cycles: the number of times each thread sends a request. If the number of threads is 10 and the number of loops is 100, then each thread sends 100 requests. The total number of requests is 10*100=1000. If "Always" is checked, all threads will keep sending requests until they choose to stop running the script.
4. Delay Thread creation until needed: Delay thread creation until needed.
5. Scheduler: Set the start time and end time of the thread group startup (when configuring the scheduler, you need to check the number of cycles as forever)
Duration (seconds): Test duration, which will cover the end time
Start delay (seconds): Test Delay the start time, it will overwrite the start time
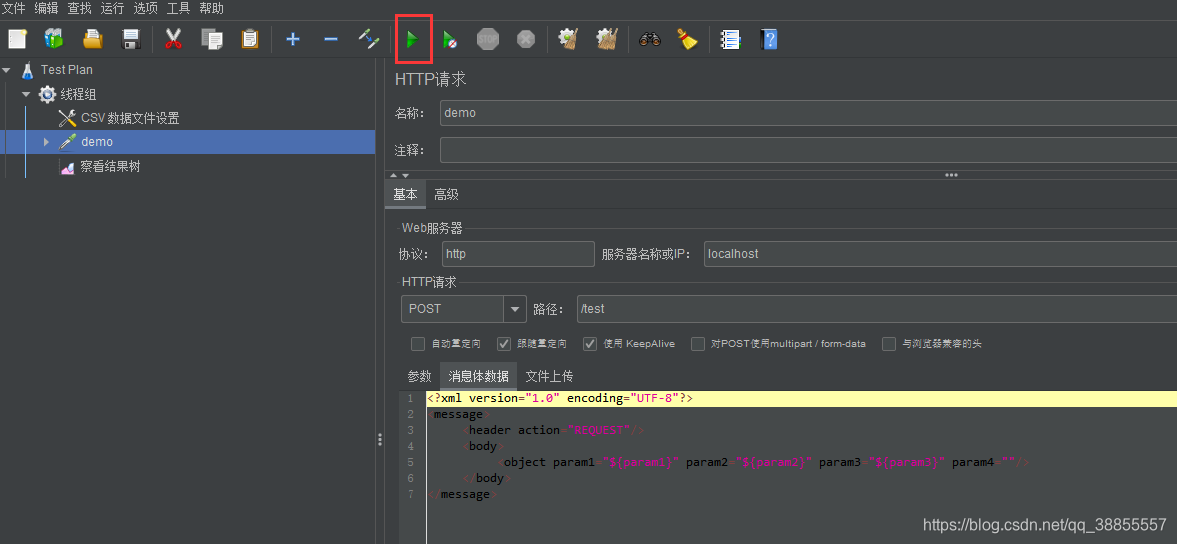
1.3.3 Add protocol and related configuration


Configure as appropriate according to their respective circumstances:


1.3.4 Add a listener

If the fields in the request message need to be imported from outside, then:


1.3.5 Start
Click the start button
1.3.6 View results
View the result tree
You can see the request message and response data for each request

Aggregate report

Detailed explanation of aggregation report parameters:
1. Label: Each element of JMeter (such as HTTP Request) has a Name attribute, and the value of the Name attribute is displayed here
2. #Samples (sample): Number of requests-indicates how many requests were issued in this test. If 10 users are simulated and each user iterates 10 times, then 100 is displayed here
3. Average (Average): Average response time-by default, it is the average response time of a single Request. When Transaction Controller is used, the average response time is displayed in the unit of Transaction
4. Median (median): the median, which is the response time of 50% of users
5. 90% Line (90% percentile): 90% user response time
6. Min (minimum value): minimum response time
7. Max: Maximum response time
8. Error% (abnormal): error rate-number of wrong requests/total number of requests
9. Throughput (throughput): Throughput-by default represents the number of requests per second (Request per Second), when the Transaction Controller is used, it can also represent the number of Transaction per Second similar to LoadRunner
10. Received KB/sec (received KB/sec): the amount of data received from the server per second;
11. Sent KB/sec (sent KB/sec): The number of requests sent from the client per second.
Generally speaking, the data we need to focus on in the performance test are: #Samples number of requests, Average average response time, Min minimum response time, Max maximum response time, Error% error rate and Throughput throughput.
Calculation formula:
tps = total number of requests processed by the server * (1- number of failures) / total time spent
tps = samples * (1-error) / runntime
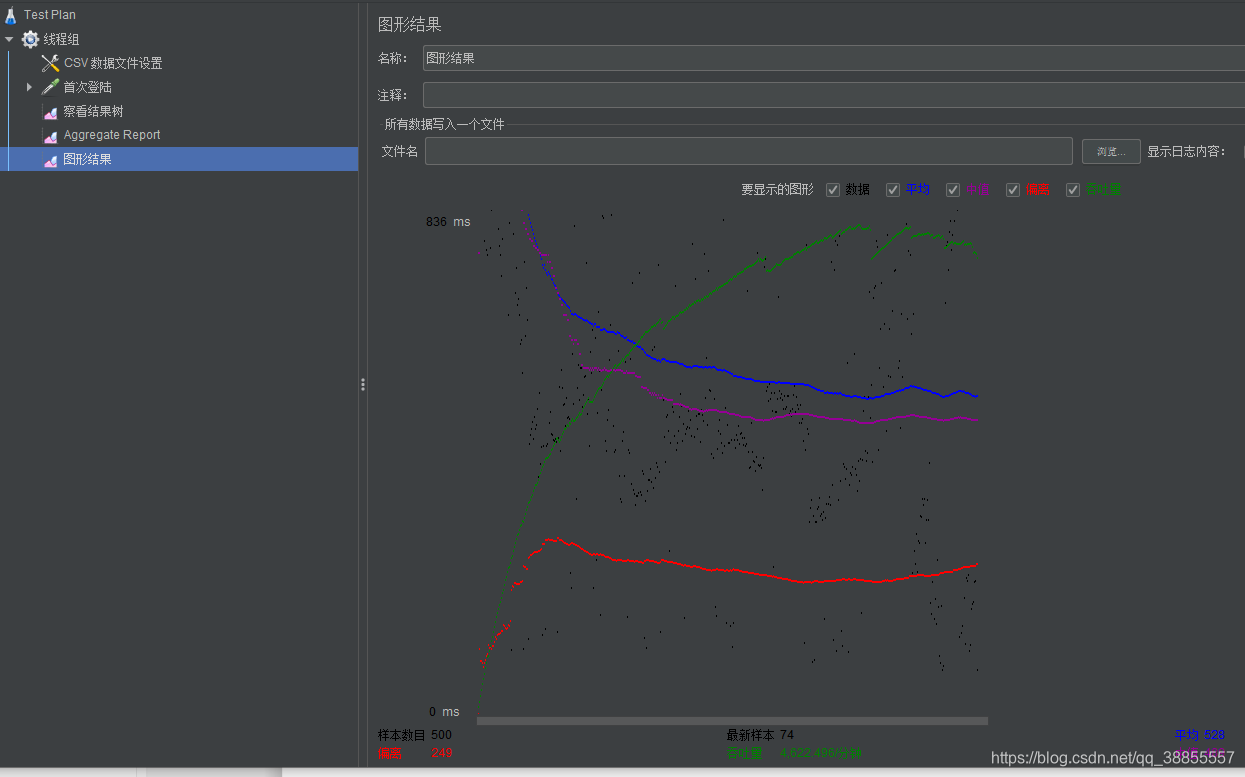
Graphical results
2 Linux
2.1 jmeter installation
Prerequisite: install and configure jdk8
- Go to jmeter official website https://jmeter.apache.org/download_jmeter.cgi and copy the link of *.tgz

- Connect to the virtual machine
cd / opt /
mkdir jmeter
cd jmeter
wget https://mirrors.bfsu.edu.cn/apache//jmeter/binaries/apache-jmeter-5.4.1.tgz
- Configure jmeter environment variables
1. Edit the profile file
vim /etc/profile
2. Add environment variables, the content is as follows
export JMETER=/opt/apache-jmeter-5.3
export CLASSPATH=$JMETER/lib/ext/ApacheJMeter_core.jar:$JMETER/lib/jorphan.jar:$JMETER/lib/logkit-2.0.jar:$CLASSPATH
export PATH=$JMETER/bin/:$PATH

3. After the addition is completed, it does not take effect immediately, you need to enter the command source /etc/profile (equivalent to executing the environment variable file once);
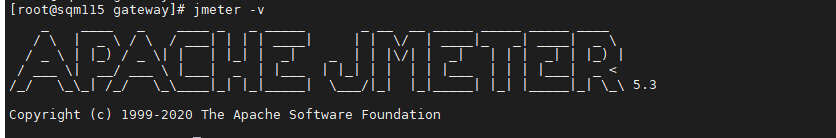
4. Check if jmeter is configured successfully
jmeter -v
2.2 Linux virtual machine settings
Linux system random port
The random port range opened by default in Linux system is 32768 ~ 65535. The client connection service monitoring port needs to use a random port connection.
Linux system random port tuning
1. Add kernel configuration parameters: /etc/sysctl.conf
net.ipv4.ip_local_port_range = 1024 65535
2. Effective kernel parameters
sysctl -p /etc/sysctl.conf
2.3 Start
Related parameters:

Command one:
jmeter -n -t login.jmx
The default log output path is the same as the jmx script path
Command 2: Specify the result file and log path
jmeter -n -t login.jmx -l result.csv -j login-log.log
The console log is as follows:

analysis:
The first piece of data: 39463 requests ran in 23 seconds, throughput is 1737.1/s, Avg is the average response time of 6ms, the minimum time is Min, the maximum time is Max, and Err is the number of failures (proportion of failures)
The result file type is jtl or csv, you can browse the result file through JMeter's aggregate report to view the final result

If there is an abnormal result, you can directly view the csv file. The csv file contains the request message, response message, related parameters and so on for each request.
3 Pressure test report
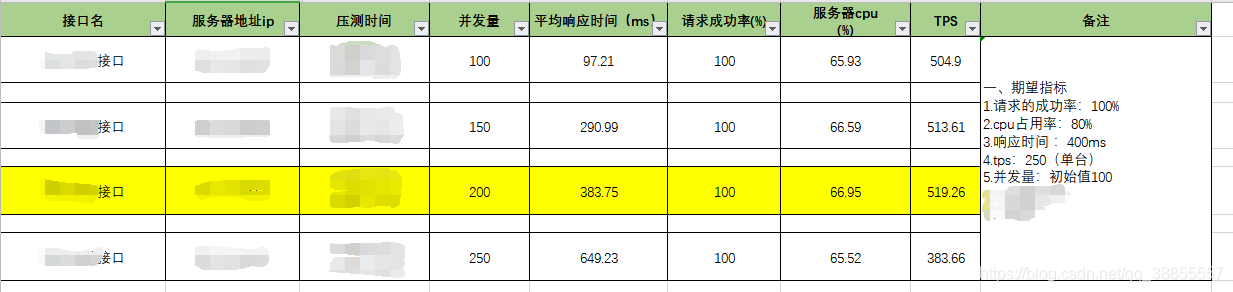
Simply record, if you have any questions, please correct me.