table of Contents
2.1 Basic Configuration slow queries
1 What is the slow queries
Slow query log, by definition, relatively slow query log, refer to mysql record all SQL statements executed more than log time threshold long_query_time parameter setting. The log can bring good help for the optimized SQL statements. By default, the slow query log is disabled , to use the slow query log function, you must first turn on slow query log function.
Query optimization process is to first find all the slow queries with SQL query statements slower statement, and then using explain plans for the implementation of these SQL statements to analyze and then optimize accordingly.
2 slow query configuration
2.1 slow query the basic configuration
- slow_query_log start stop technology slow query log
- slow_query_log_file slow query log was specified storage path and file (the default data file and put together)
- long_query_time designated record slow query log SQL execution time was the threshold value (unit: seconds, 10 seconds by default)
- log_queries_not_using_indexes whether the records are not to use the index SQL
- Local log_output log storage [TABLE] [FILE] [FILE, TABLE]
After configuring the slow query, it records that meet the conditions of SQL
include:
- check sentence
- Data modification statements
- SQL has been rolled back too
Practical operation:
By the following command to check the above configuration:
show VARIABLES like '%slow_query_log%'

show VARIABLES like '%slow_query_log_file%'

show VARIABLES like '%long_query_time%'

show VARIABLES like '%log_queries_not_using_indexes%'

show VARIABLES like 'log_output'


set global long_query_time=0;   ---默认10秒,这里为了演示方便设置为0

set GLOBAL  slow_query_log = 1; --开启慢查询日志

set global log_output='FILE,TABLE'  --项目开发中日志只能记录在日志文件中,不能记表中
After the setup is complete, you can find a list of some query slow query log file inside the data.

2.2 slow query interpretation
From the slow query log inside an excerpt slow query log data is composed as follows

Slow query format
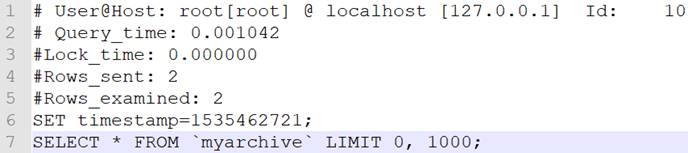
| Line number |
content |
| 1 |
User name, IP information of the user, thread ID number |
| 2 |
It takes time to execute [Unit: msec] |
| 3 |
Execution time to acquire a lock |
| 4 |
The results obtained by the number of rows |
| 5 |
The number of data lines scanned |
| 6 |
This specific time execution of SQL |
| 7 |
Specific SQL statement |
3 slow query analysis
Slow query log is very large, from the inside to find a slow query log is not very easy thing, in general, require some auxiliary tools to quickly navigate to the need to optimize the SQL statements, here are two slow query aid
3.1 Mysqldumpslow
Common slow query log analysis tool, in addition to the summary of the SQL query other identical, and the order of the results according to parameters specified in the output analysis. The tools in the bin file in the MySQL installation directory.

grammar:
mysqldumpslow -s r -t 10 slow-mysql.log
-s order (c,t,l,r,at,al,ar)
         c:总次数
         t:总时间
         l:锁的时间
         r:总数据行
         at,al,ar  :t,l,r平均数  【例如:at = 总时间/总次数】

 -t  top   指定取前面几条作为结果输出
mysqldumpslow.pl -s t -t 10 D:\DESKTOP-2EKGEE5-slow.log

3.2 pt_query_digest
Is a tool for the analysis of mysql slow queries, compared with mysqldumpshow tools, analysis tools py-query_digest more specific and better.
mysqldumpshow this tool must be logged in to the MySQL server can use, sometimes for some reason such as insufficient permissions, a query can not be recorded on the server. Such restrictions we often encounter. But py-query_digest no such problem. And py-query_digest can view an execution plan, mysqldumpshow no.
First look at the next command
perl .\pt-query-digest --explain h=127.0.0.1,u=root,p=root1234% D:\DESKTOP-2EKGEE5-slow.log

Information aggregated total query time [], [] the total lock time, [the total amount of data acquisition], [amount of data scanned], [size] inquiry
- Response: The total response time.
- time: The total time to query share in this analysis.
- calls: execution times, that this analysis a total of how many of this type of query.
- R / Call: the average response time per execution.
- Item: query object
3.2.1 Further reading:
3.2.1.1 pt-query-digest grammar and important option
pt-query-digest [OPTIONS] [FILES] [DSN]
- When --create-review-table --review parameter used when the analysis result is output to the table, if there is no table is created automatically.
- When --create-history-table --history parameter used when the analysis result is output to the table, if there is no table is created automatically.
- --filter of slow queries entered by the specified string is analyzed and then filtered to match
- --limit limit the number or percentage of the output, the default value is 20, i.e. the slowest output statement 20, if it is 50% of the proportion of the total response time press descending order, outputs the sum of 50% position is turned off.
- --host mysql server address
- --user mysql user name
- --password mysql user password
- --history save the analysis results to the table, analyze the results in more detail, the next time you use --history, if the same statement exists, and query different time intervals and history as the table, the data will be recorded in the table can change history to compare certain types of queries by querying the same CHECKSUM.
- --review will analyze save the results to the table, this analysis is only carried out a record of the query parameterization, a type of query is relatively simple. When the next time you use --review, if there is the same statement analysis, it will not record the data in the table.
- --output analysis result output type, the value may be Report (standard analysis), slowlog (log Mysql SLOW), JSON , JSON-anon, Report general use, easier to read.
- --since from what time to start the analysis, the value of the string, may be a "yyyy-mm-dd [hh: mm: ss]" designated time point format may be a simple time values: s ( sec), h (hour), m (minutes), d (days), it is represented as 12h from 12 hours before the start statistics.
- --until deadline, with -since slow query can be analyzed over a period of time.
3.2.1.2 Analysis of pt-query-digest output
3.2.1.2.1 Part 1: General statistical results
- Overall: Total number of queries
- Time range: query execution time
- unique: The number of unique queries, after that is to be parameterized query, a total number of different queries have
- total: Total min: The minimum max: maximum avg: Average
- 95%: all of the values in ascending order, located the 95% of the number, this number is generally the most valuable
- median: median, all of the values in ascending order, the number of positions in the middle
# 该工具执行日志分析的用户时间,系统时间,物理内存占用大小,虚拟内存占用大小
# 340ms user time, 140ms system time, 23.99M rss, 203.11M vsz
# 工具执行时间
# Current date: Fri Nov 25 02:37:18 2016
# 运行分析工具的主机名
# Hostname: localhost.localdomain
# 被分析的文件名
# Files: slow.log
# 语句总数量,唯一的语句数量,QPS,并发数
# Overall: 2 total, 2 unique, 0.01 QPS, 0.01x concurrency
# 日志记录的时间范围
# Time range: 2016-11-22 06:06:18 to 06:11:40
# 属性    总计  最小 最大 平均 95% 标准 中等
# Attribute   total  min  max  avg  95% stddev median
# ============  ======= ======= ======= ======= ======= ======= =======
# 语句执行时间
# Exec time    3s 640ms  2s  1s  2s 999ms  1s
# 锁占用时间
# Lock time   1ms  0  1ms 723us  1ms  1ms 723us
# 发送到客户端的行数
# Rows sent    5  1  4 2.50  4 2.12 2.50
# select语句扫描行数
# Rows examine  186.17k  0 186.17k 93.09k 186.17k 131.64k 93.09k
# 查询的字符数
# Query size   455  15  440 227.50  440 300.52 227.50
3.2.1.2.2 The second part: the query packet statistics
- Rank: All statements ranking, query time by default in descending order, specified by --order-by
- Query ID: ID statement, (text characters and remove extra spaces, calculated hash value)
- Response: The total response time
- time: The total time to query share in this analysis
- calls: execution times, that this analysis a total of how many of this type of query
- The average response time per execution: R / Call
- The ratio of the response time of Variance-to-mean: V / M
- Item: query object
# Profile
# Rank Query ID   Response time Calls R/Call V/M Item
# ==== ================== ============= ===== ====== ===== ===============
# 1 0xF9A57DD5A41825CA 2.0529 76.2%  1 2.0529 0.00 SELECT
# 2 0x4194D8F83F4F9365 0.6401 23.8%  1 0.6401 0.00 SELECT wx_member_base
3.2.1.2.3 Part III: detailed statistics for each query
Detailed statistics by the following query, the top of the table lists the number of executions, maximum, minimum, average, and so the 95% statistical purposes.
- ID: ID number of the query, the Query ID, and corresponding FIG.
- Databases: database name
- Users: the number of times each user performs (accounting)
- Query_time distribution: query time distribution, the proportion of the length of interval reflects, in the present embodiment between the query twice the number of 1s-10s than 10s.
- Tables: tables involved in the query
- Explain: SQL statement
# Query 1: 0 QPS, 0x concurrency, ID 0xF9A57DD5A41825CA at byte 802
# This item is included in the report because it matches --limit.
# Scores: V/M = 0.00
# Time range: all events occurred at 2016-11-22 06:11:40
# Attribute pct total  min  max  avg  95% stddev median
# ============ === ======= ======= ======= ======= ======= ======= =======
# Count   50  1
# Exec time  76  2s  2s  2s  2s  2s  0  2s
# Lock time  0  0  0  0  0  0  0  0
# Rows sent  20  1  1  1  1  1  0  1
# Rows examine 0  0  0  0  0  0  0  0
# Query size  3  15  15  15  15  15  0  15
# String:
# Databases test
# Hosts  192.168.8.1
# Users  mysql
# Query_time distribution
# 1us
# 10us
# 100us
# 1ms
# 10ms
# 100ms
# 1s ################################################################
# 10s+
# EXPLAIN /*!50100 PARTITIONS*/
select sleep(2)\G
