Build Lepus on the server-an open source database monitoring system
Due to the company's business needs, I wanted to build a database monitoring platform. I looked for an open source monitoring platform on git, so I found Lepus, an open source system, and recorded the building process for future learning.
One, install docker
First, explain the environment: the server belongs to Kunpeng, and the Linux system has been installed in advance. My system version is

1. Update the yum program (optional)
yum update -y
-y: It means that you need to make sure that all the updated options are yes, otherwise it will be a bit more troublesome
2. Uninstall the old version of docker
View the old version of docker installed, if there is an old version, remove and uninstall
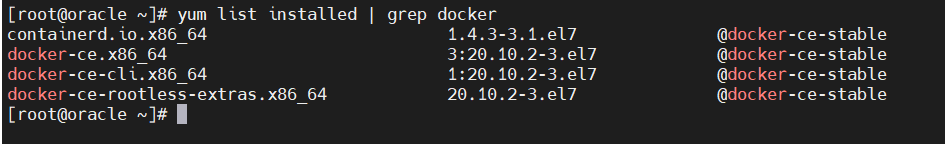
I won’t delete it once I installed it here, but I need to delete it by my own Baidu search. ( yum remove + the name of the application to be uninstalled )
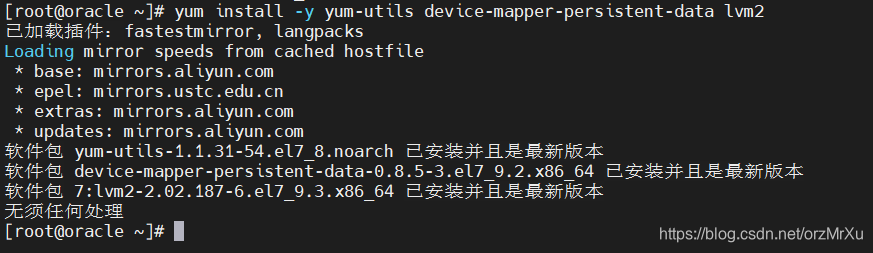
3. Install the required dependencies
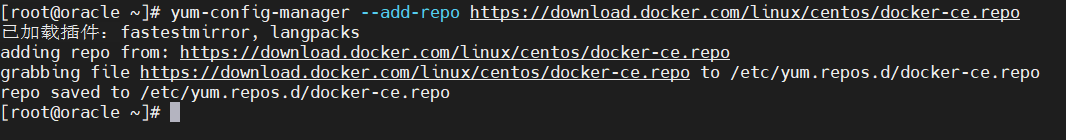
4. Add docker's yum source
5. Install docker community edition
yum install docker-ce
6. Start the service and add to start
systemctl start docker
systemctl enable docker
7. Verify that docker is installed successfully
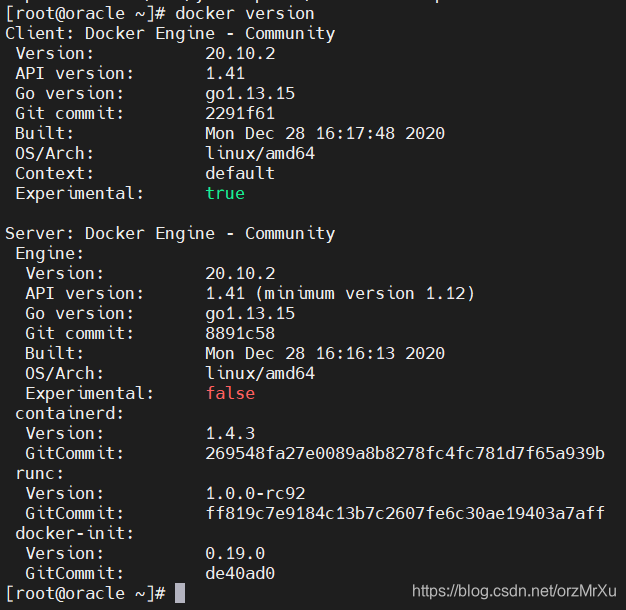
The version information appears to prove that the installation was successful.
Two, deploy lepus
1. Pull Lepus mirror
Enter docker pull lhrbest/lhrlepus:3.8 and wait for the download to complete;
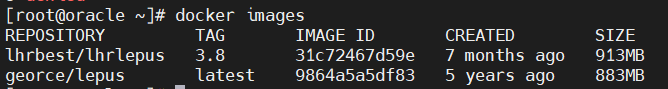
I have two versions of lepus above, the above is the beta version of Lepus3.8, the bottom is the version of Lepus3.7, just choose one to pull
2. Start the container
Create a container: mkdir -p /opt/mysql
docker run -d --restart always --name=lhrlepus -p 10000:80 -p 10100:3307 -v /opt/mysql:/var/lib/mysql -v /usr/share/zoneinfo/Asia/Shanghai:/etc/localtime -t -e PHP_TZ=“Asia/Shanghai” \lhrbest/lhrlepus:3.8
10000 is the port number for you to access the management interface in the address bar, just choose to change it yourself
3. View the process

You can see that the process has started
4. Enter docker bash
docker exec -it lhrbest bash
5. Configure environment variables
echo $TERM
export TERM=dumb
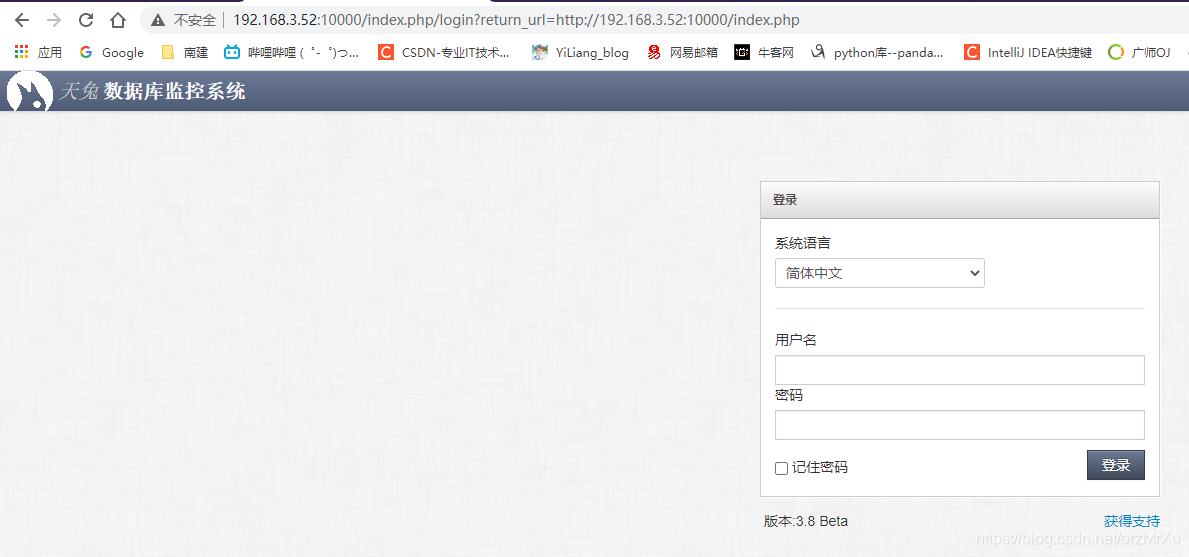
6. After configuration, access through the address bar
Server IP+":"+"32800"
For example, if I am 192.168.3.52:10000, I can enter the management interface. Enter the account password to log in. The default account is admin and the password is Lepusadmin.
Three, monitoring database (mysql example)
1. Create a user
To monitor the MySQL database, there is no need to install any agent on the monitored side, just create a user with the corresponding permissions.
After entering the root user, create a user
//Only allow specified ip connection
create user'new username'@'localhost' identified by'password';
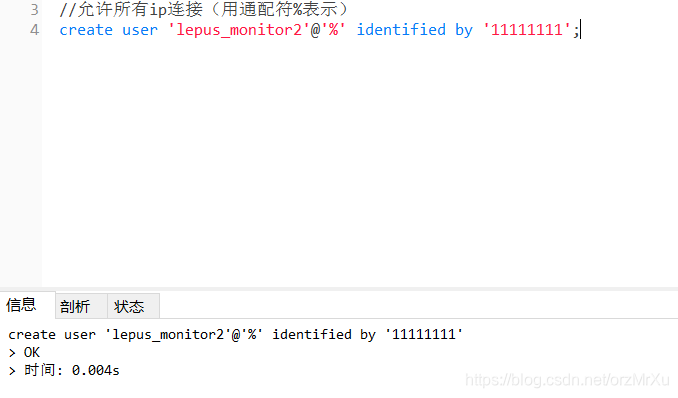
//Allow all ip connections (indicated by wildcard %)
create user'new username'@'%' identified by ' password';
2. Empowerment
grant select,process,super on . to ‘lepus_monitor’@‘10.0.0.%’ identified by ‘[email protected]’ ;
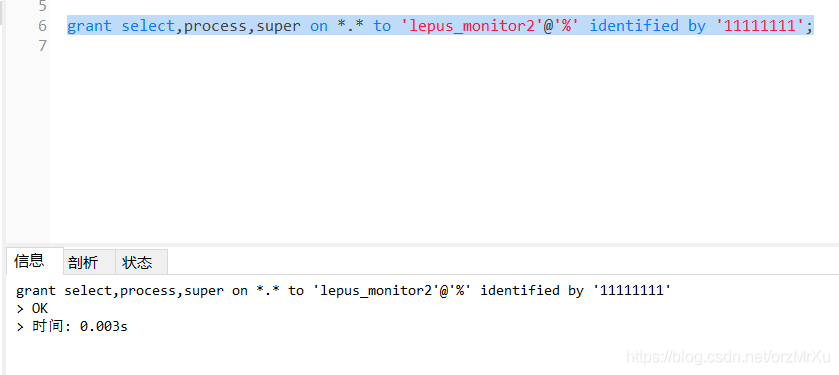
Just refresh it after the empowerment,
flush privileges;
Permission description: An account needs to be established on the monitored terminal. This account needs corresponding permissions. If the permissions are not enough to collect data, there will be problems. Without this permission, it cannot be used on the Lepus system!
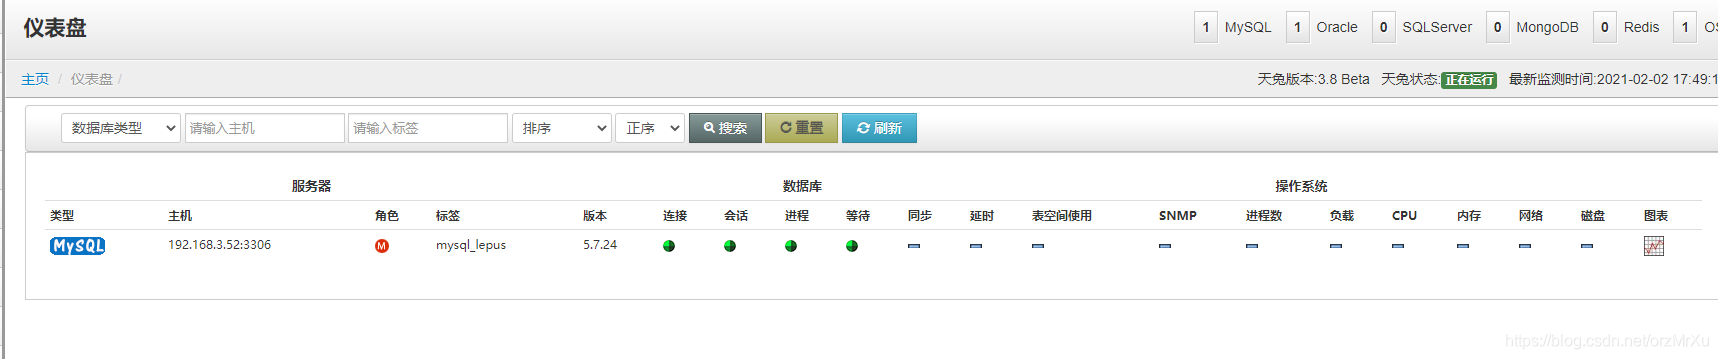
3. Configure Mysql
Usagi into the management interface, configuration Center -> Add , fill in turn host, user name, password, the label can be
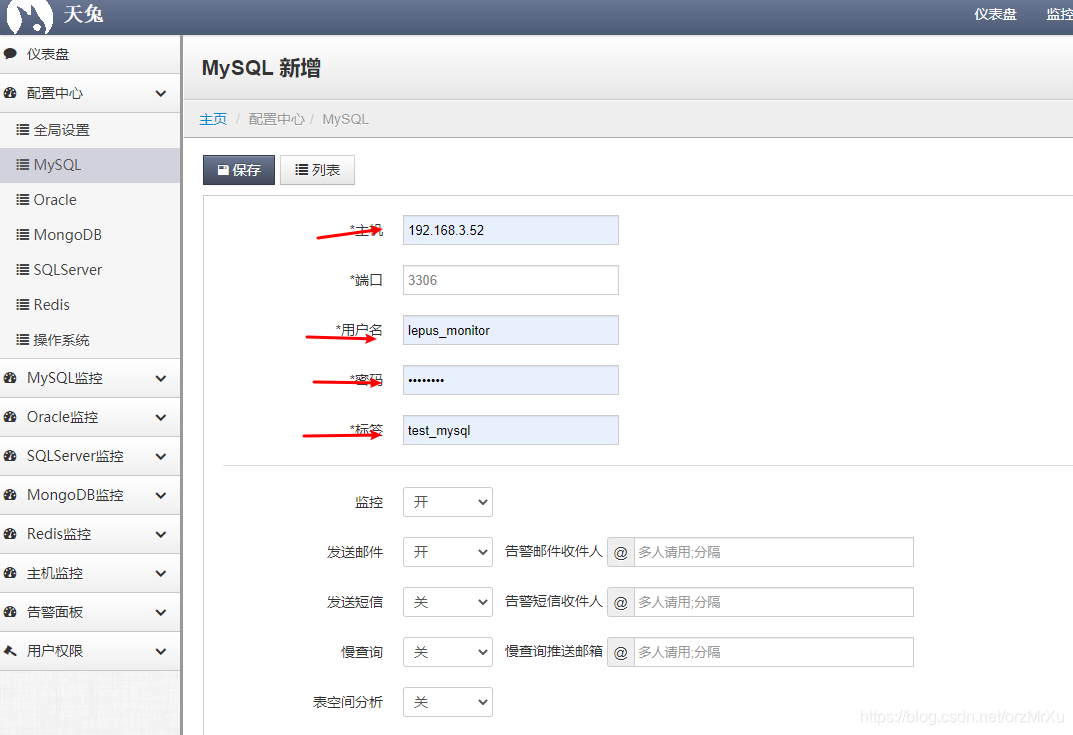
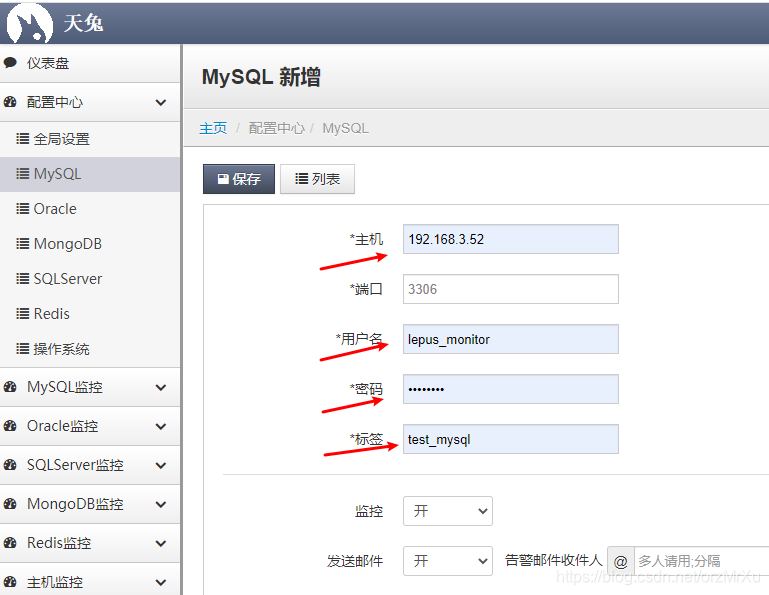
The dashboard can monitor your Mysql