Abstract : Based on the Android system with high penetration rate, this article integrates data query and energy spectrum reading to meet the needs of related data processing and data visualization, and develops a convenient and fast characteristic X-ray spectrum recognition system . Researchers can use this system to perform various tasks such as energy spectrum reading and data query without the need for additional tools or networks.
Keywords : characteristic X-ray spectrum; Android; data visualization; mobile APP
0 Preface
With the widespread use of smart phones, various mobile apps have developed rapidly to meet people's various needs, and have a tendency to gradually replace the status of computer software, which has become an important emerging way for users to obtain information. At present, in the mobile phone market, Android's share has exceeded 70%, but in the field of characteristic X-ray spectrum recognition, people are still at the stage of using computer software, and there is no precedent for using Android. For this reason, this paper designs a characteristic X-ray spectrum recognition system based on Android, which can easily and quickly determine the unknown spectrum and provide a new method for X-ray research.
1 Design platform
1.1 Android system
Android is a Linux-based operating system, often used in mobile devices such as smart phones. The Android system is not only free but also open source, and has been welcomed by a large number of device manufacturers [1]. As of 2019, Google Play, the publishing platform for Android applications, has more than 3 million apps for download and use[2]. The Android system adopts a layered architecture, divided into four layers, from the bottom to the top are the Linux kernel layer, the system runtime layer, the application framework layer and the application layer. The architecture is progressive, providing convenience for many mobile developers.
1.2 Android development environment and tools
Android APP development tools include Android Studio, Eclipse and IntelliJ IDEA. These three development tools are free and open. Android Studio is a development environment launched by Google. It has the advantages of faster speed, integrated Gradle build tools, a more complete plug-in system, and a more beautiful UI [3], so this topic chooses Android Studio as the development environment. Android Studio can create a variety of emulators to help debug the code and check the running effect, but the emulator is not only slow, but also has many things that cannot be simulated, so this topic uses real machine testing, and the selected real machine parameters are as follows : Device name: HUAWEI nova2 Plus; EMUL version: 8.0.0; Android version: 8.0.0; screen: 1920x1080.
2 System design and implementation
This system mainly includes two major functions, namely the data query of X-ray data manual and the drawing of characteristic X-ray spectrum. The system interface adopts a linear layout, so that the controls are arranged neatly and the interface is beautiful. The main interface design is shown in Figure 1.
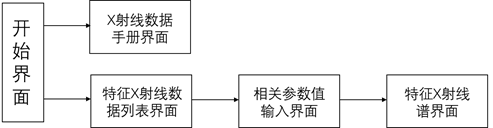 2.1 Start interface
The start interface of APP is a pop-up dialog box (Dialog), the dialog box has two options, namely X-ray data manual and characteristic X-ray spectrum, select the option, click OK, you can enter the corresponding function interface— —X-ray data manual or characteristic X-ray data list.
2.2 X-ray data manual
The upper part of the interface is the text input area, and the lower part is the text output area. Enter the atomic number, you can query the energy emitted when the electron transitions in different orbits of the corresponding atom [6].
2.3 Characteristic X-ray data list
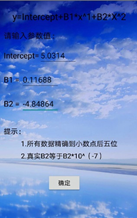
When data is imported into the system, the addList() function will be called and the interface will be refreshed. Click the list item to trigger an event to jump to the interface for inputting parameter values. The upper part of the interface reminds the user of the relationship between the number of channels and the energy scale, and the lower part is a text input box for inputting parameter values Intercept, B1, and B2. After inputting the parameter value, the system will automatically generate a characteristic X-ray spectrum.
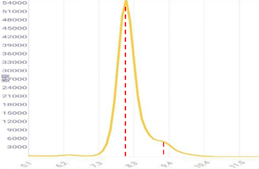
2.4 Characteristic X-ray spectrum
In the process of analyzing and displaying data, data visualization is a very important means [4]. Therefore, the interface is designed to identify characteristic X-rays. Since there are few open source solutions for Android system chart components [5], this paper uses a third-party hellochart open source project drawing. The ordinate of the drawn line graph is the number (number) of X-rays, and the abscissa is energy (energy) of X-rays. Some of the core codes are as follows:
for (i = 0; i < energy.length; i++) {


            mAxisXValues.add(new AxisValue(i).setLabel(String.valueOf(energy[i])));
        }
        for (i = 0; i <allNumber.length; i++) {


            mPointValues.add(new PointValue(i,allNumber[i]));
        }
3 Test results and analysis
3.1 Test results
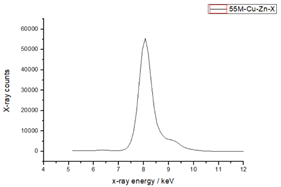
Import the X-ray emission data and parameters obtained from the interaction between 55 MeV Cu9+ ion and Zn target into the system, and the parameter values are Intercept: 5.03143, B1: 0.11688, B2: -4.8484x10 (-7) [ 7], the drawing is shown in Figure 2. Comparing with the drawing result of Origin software in Figure 3, it can be concluded that the drawing effect of this system is exactly the same as that of Origin.
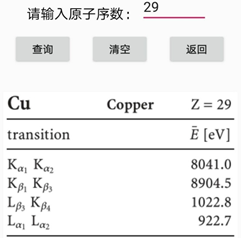
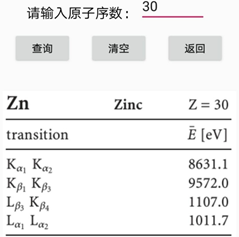
Switch the system to the X-ray data manual interface, and enter the atomic numbers 29 and 30 of Cu and Zn respectively. The interface is shown in Figure 4 and Figure 5. The display results are the same as the official X-ray data manual [6].
3.2 Test analysis
According to the results obtained by the system, it can be seen that the former peak is the Kα characteristic X-ray spectrum of Cu9+ ion (bombardment ion), and the latter peak is the Kα characteristic X-ray spectrum of Zn atom (target material), which was used with Guo Yipan and others. The research results obtained by origin are consistent [7].
4 Conclusion
The feature X-ray spectrum recognition system based on Android in this thesis can draw feature X-ray spectrum and display X-ray data manual. It is not only easy to operate and beautiful interface, but also the accuracy of data processing and data visualization is sufficient to identify feature X-ray spectrum, which can be applied Space X-ray research.
References
[1] Adam M. Dutko. An introduction to the new google mobile Linux framework, android.Linux Journal, 2008.
[2] Hou Bocheng . Design and implementation of an Android-based virtual simulation experiment teaching resource management system [D]. Inner Mongolia University, 2019.
[3] Xu
Hangnan. Research on Android-based acoustic signal testing and analysis technology [D]. Hangzhou Dianzi University, 2017. [4] Chen Wei, Shen Zeqian, Tao Yubo. Data visualization[M]. Beijing: Electronics Industry Publishing House, 2013. 12: 39.
[5] Gao Yi, Wang Xin, Ding Yong, Tu Xiaoqin. Research on the key technology of custom chart components based on Android[J].Software,2019,40(09):40-44.
[6]Zschornack, Gbnter. Handbook of X-Ray Data || [M]. Springer Berlin Heidelberg, 2006.
[7]Guo Yipan. Experimental study of characteristic and non-characteristic X-rays in the interaction between highly charged ions and solids [D]. University of Chinese Academy of Sciences (Institute of Modern Physics, Chinese Academy of Sciences), 2017.