The source code of the project has been uploaded to https://gitee.com/yangleliu/learning.git, and you can obtain it for free. Wechat
search [AI code division] Follow the handsome me, reply [Receive dry goods] and receive a copy of the latest interview materials for 2021
【Foreword】
After the development task, the moment the code was submitted, the mood was free...the speed was eighty steps...

I thought it was going to be a game, a visit to GAI, or a warm bed.
However, how full of dreams and the backbone of reality.
There is always a test lady who teaches you to brake emergency, turn around to do (change) people (bug): AI master, you can't do this! (People eating melons sit in rows, smiling and tilting their mouths)
I looked down at my eight-pack abs: it's not up to you to decide if it works!
Miss Sister is not a vegetarian either, roll up her sleeves and open her ten generations of Lenovo: You do, you keep reporting errors, poison milk teammate!
Me: (⊙o⊙)... So what you said is that this is not good, I thought...
Miss sister looked puzzled: Why? I really thought I was a great god!
I coughed up my embarrassment and never gave up: I think you passed the wrong parameters. After all, the master has no problems when debugging locally.
Miss sister has been on the battlefield and has never failed: No! can! can! It's you, it's you, it's you! I can never be wrong.
At that moment, I seemed to see my girlfriend in her menstrual period flash in front of me, and my heart was broken.

The two of us argued for a long time, and it was not surprising that it was me who surrendered.
after all--
The traditional beauty (bad) virtue (dregs) of the Chinese nation is: good men do not fight with women!
So I can only go to the server to check the log, but the log content is as exhausting as a mountain, as many as a cow's hair, a full 3.5 g, but I have no choice but to use a bunch of Linux commands to cut the files into small files. Fortunately, at the end The request was finally found, and the reason was found after investigation.

Through this incident, I learned from the pain: if there is a platform that can collect our logs in real time and present them in a visual interface, then it would be great! This way we no longer have to look for data in that pile of heavy log files.
【Cheats Show】
In fact, this kind of magical platform has already existed, and that is ELK, which is a combination of the three great beasts Elasticsearch (search engine), Logstash (log collection), and Kibana (visual web interface):
Let’s look at the architecture diagram:
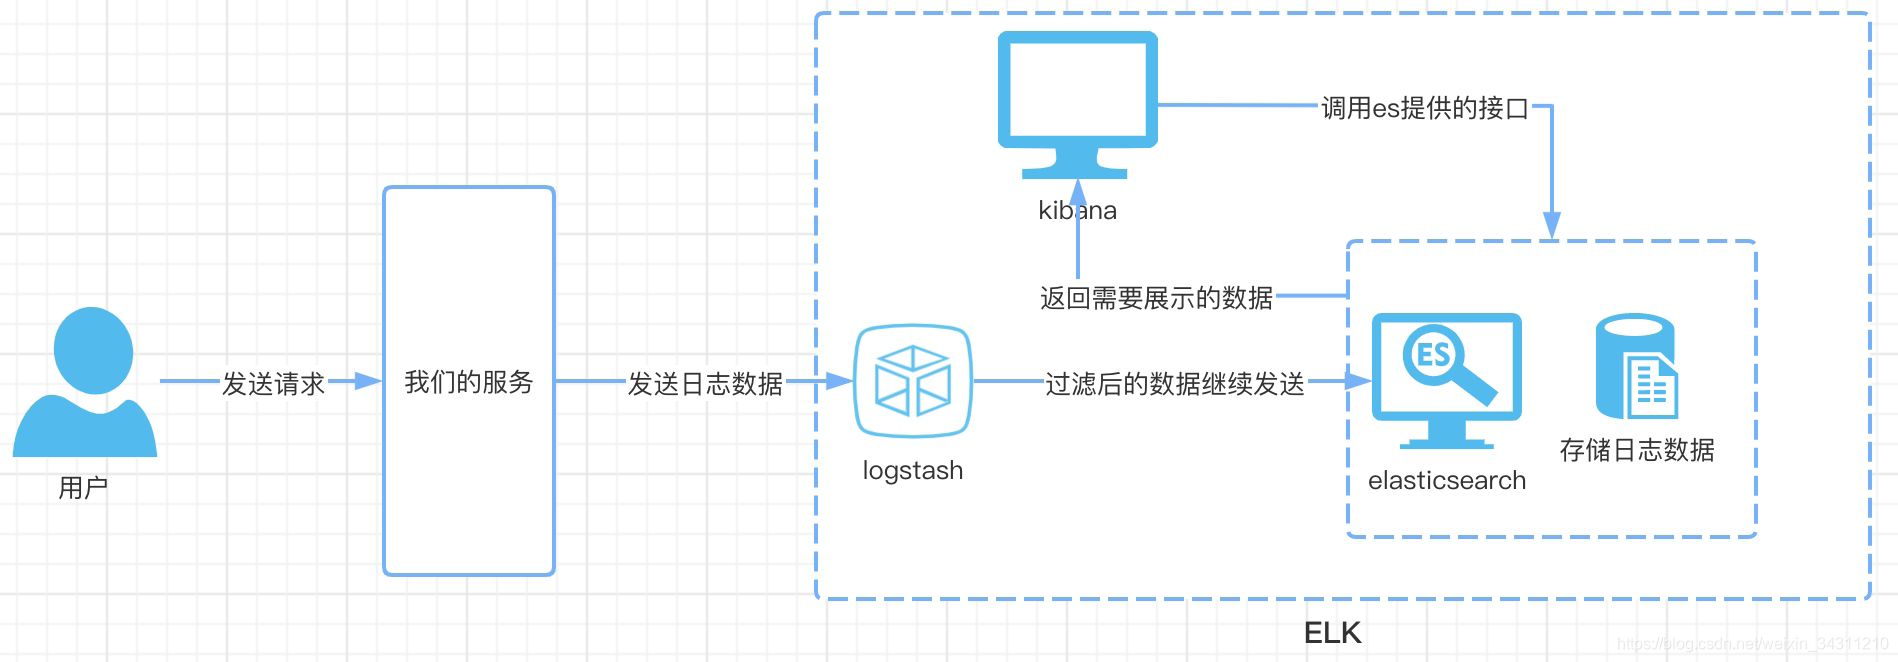
Compared with the architecture diagram, let’s take a look at the working process of these three beasts
- The user sends a request to our server
- The server sends the data that needs to be logged to logstash through network requests
- After logstash filters and cleans the data, it is then sent to Elasticsearch
- Elasticsearch is responsible for creating indexes and storing data
- Users can view logs in real time by visiting kibana's web page
Okay, all the cheats are told, now I need to lead you to actual combat
【Necessary Mind】
Before fighting, we need soldiers to have the following skills, otherwise they will only be abused after being on the battlefield.
- Understand the three components of elk
- Have practiced docker
- There is a docker environment locally
- IDEA tools
- Configure a relatively high weapon (computer), otherwise it will crash
[Prepare food and grass] Prepare a Springboot project
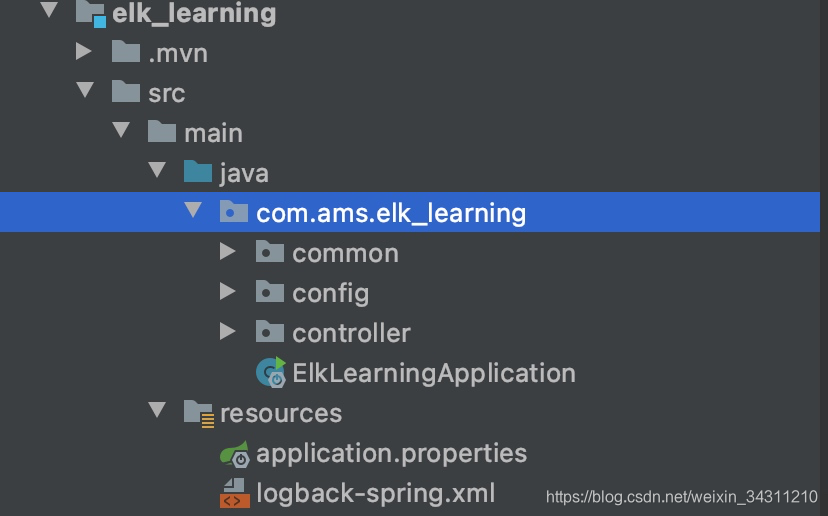
First create a springboot project, the project structure is as follows
Introduce the necessary dependencies of the project
  <dependency>
            <groupId>org.springframework.boot</groupId>
            <artifactId>spring-boot-starter</artifactId>
        </dependency>
        <dependency>
            <groupId>com.alibaba</groupId>
            <artifactId>fastjson</artifactId>
            <version>1.2.35</version>
        </dependency>
        <dependency>
            <groupId>cn.hutool</groupId>
            <artifactId>hutool-all</artifactId>
            <version>5.4.0</version>
        </dependency>
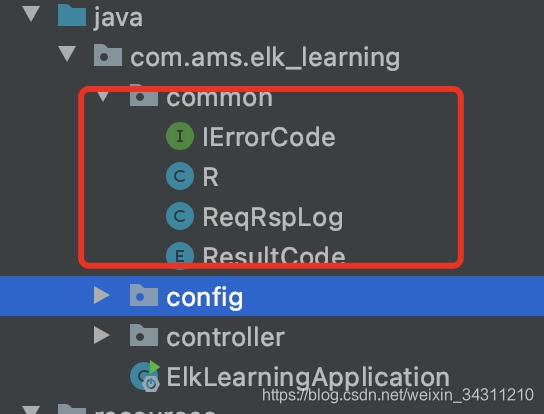
Create some basic components
Create aspects to achieve low coupling logging
Core code
    // 使用环绕通知
  @Around("controllerLog()")
  public Object doAround(ProceedingJoinPoint joinPoint) throws Throwable {
    long startTime = System.currentTimeMillis();
    // 获取当前请求对象
    ServletRequestAttributes attributes =
        (ServletRequestAttributes) RequestContextHolder.getRequestAttributes();
    HttpServletRequest request = attributes.getRequest();
    // 记录请求信息
    ReqRspLog webLog = new ReqRspLog();
    Object result = joinPoint.proceed();
    Signature signature = joinPoint.getSignature();
    MethodSignature methodSignature = (MethodSignature) signature;
    Method method = methodSignature.getMethod();
    // 通过反射,获取入参和出参,封装成json,落日志
    long endTime = System.currentTimeMillis();
    String urlStr = request.getRequestURL().toString();
    webLog.setBasePath(StrUtil.removeSuffix(urlStr, URLUtil.url(urlStr).getPath()));
    webLog.setIp(request.getRemoteUser());
    webLog.setMethod(request.getMethod());
    webLog.setParameter(getParameter(method, joinPoint.getArgs()));
    webLog.setResult(result);
    webLog.setSpendTime((int) (endTime - startTime));
    webLog.setStartTime(startTime);
    webLog.setUri(request.getRequestURI());
    webLog.setUrl(request.getRequestURL().toString());
    logger.info("{}", JSONUtil.parse(webLog));
    return result;
  }
Create test interface
@RestController
@RequestMapping("/api")
public class ApiController {
    @GetMapping
    public R<String> addLog(@RequestParam(value = "param1",required = false) String param1){
        return R.success("你好,这段话将被日志记录");
    }
}
We now request an interface, and we will find that such a log is printed on the console
{"method":"GET","uri":"/api","url":"http://localhost:8080/api","result":{"code":200,"data":"你好,这段话将被日志记录","message":"操作成功"},"basePath":"http://localhost:8080","parameter":{"param1":"测试ELK"},"startTime":1611529379353,"spendTime":9}
Using the aspect, the log recording and printing to the console have been completed, and now we need to send the log to es through logstash according to the architecture diagram, and then integrate logstash to realize the log transfer function
【Recruitment】Integrate Logstash
Add logstash dependency
 <!--集成logstash-->
        <dependency>
            <groupId>net.logstash.logback</groupId>
            <artifactId>logstash-logback-encoder</artifactId>
            <version>5.3</version>
        </dependency>
        <dependency>
            <groupId>org.projectlombok</groupId>
            <artifactId>lombok</artifactId>
            <optional>true</optional>
        </dependency>
Edit the configuration file logback-spring.xml
<?xml version="1.0" encoding="UTF-8"?>
<!DOCTYPE configuration>
<configuration>
    <include resource="org/springframework/boot/logging/logback/defaults.xml"/>
    <include resource="org/springframework/boot/logging/logback/console-appender.xml"/>
    <!--应用名称-->
    <property name="APP_NAME" value="mall-admin"/>
    <!--日志文件保存路径-->
    <property name="LOG_FILE_PATH" value="${LOG_FILE:-${LOG_PATH:-${LOG_TEMP:-${java.io.tmpdir:-/tmp}}}/logs}"/>
    <contextName>${APP_NAME}</contextName>
    <!--每天记录日志到文件appender-->
    <appender name="FILE" class="ch.qos.logback.core.rolling.RollingFileAppender">
        <rollingPolicy class="ch.qos.logback.core.rolling.TimeBasedRollingPolicy">
            <fileNamePattern>${LOG_FILE_PATH}/${APP_NAME}-%d{yyyy-MM-dd}.log</fileNamePattern>
            <maxHistory>30</maxHistory>
        </rollingPolicy>
        <encoder>
            <pattern>${FILE_LOG_PATTERN}</pattern>
        </encoder>
    </appender>
    <!--输出到logstash的appender-->
    <appender name="LOGSTASH" class="net.logstash.logback.appender.LogstashTcpSocketAppender">
        <!--可以访问的logstash日志收集端口-->
        <destination>127.0.0.1:4560</destination>
        <encoder charset="UTF-8" class="net.logstash.logback.encoder.LogstashEncoder"/>
    </appender>
    <root level="info">
        <appender-ref ref="CONSOLE"/>
        <appender-ref ref="FILE"/>
        <appender-ref ref="LOGSTASH"/>
    </root>
</configuration>
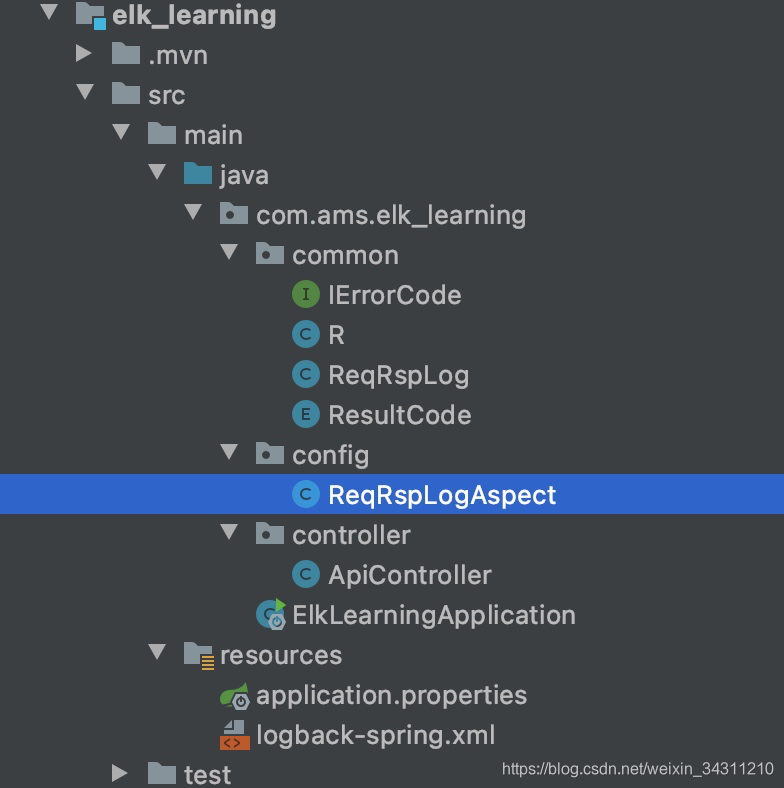
After editing, the project structure looks like this:
Although the logstash function has been integrated in the project, logstash still does not know where to send the logs, because we do not have a city yet.
If it doesn't, let's build it!
[Build a city] Build ELK environment
Here I use dokcer-compose to build ELK, one word: fast!
First we agree on a root directory: /user/aimashi/docker
execute the following commands as required
mkdir -p /Users/yangle/docker
cd /Users/yangle/docker
mkdir elk_stanrd
cd elk_stanrd
mkdir logstash
cd logstash
vim logstash.conf
Copy the following file content to logstash.conf
input {
  tcp {
    mode => "server"
    host => "0.0.0.0"
    port => 4560
    codec => json_lines
  }
}

output {
  elasticsearch {
    hosts => "es:9200"
    index => "logstash-service-%{+YYYY.MM.dd}"
  }
}
Continue to execute the following command
cd ../
vim docker-compose.yml
Also copy the following content into the configuration file
version: '3'
services:
  elasticsearch:
    image: elasticsearch:6.4.0
    container_name: elasticsearch
    environment:
      - "cluster.name=elasticsearch" #设置集群名称为elasticsearch
      - "discovery.type=single-node" #以单一节点模式启动
      - "ES_JAVA_OPTS=-Xms512m -Xmx512m" #设置使用jvm内存大小
    volumes:
      - /Users/yangle/docker/elk_stanrd/elasticsearch/plugins:/usr/share/elasticsearch/plugins #插件文件挂载
      - /Users/yangle/docker/elk_stanrd/elasticsearch/data:/usr/share/elasticsearch/data #数据文件挂载
    ports:
      - 9200:9200
      - 9300:9300
  kibana:
    image: kibana:6.4.0
    container_name: kibana
    links:
      - elasticsearch:es #可以用es这个域名访问elasticsearch服务
    depends_on:
      - elasticsearch #kibana在elasticsearch启动之后再启动
    environment:
      - "elasticsearch.hosts=http://es:9200" #设置访问elasticsearch的地址
    ports:
      - 5601:5601
  logstash:
    image: logstash:6.4.0
    container_name: logstash
    volumes:
      - ~/Users/yangle/docker/elk_stanrd/logstash/logstash.conf:/usr/share/logstash/pipeline/logstash.conf #挂载logstash的配置文件
    depends_on:
      - elasticsearch #kibana在elasticsearch启动之后再启动
    links:
      - elasticsearch:es #可以用es这个域名访问elasticsearch服务
    ports:
      - 4560:4560
So far, the preparations for setting up the elk environment have been completed.
Now you need to start elk, execute the following command in the /Users/yangle/docker/elk_stanrd directory
docker-compose up -d
The following prompt appears after execution, which means the initial creation is successful

Next, we execute docker ps to see if the container is started

If it is the same as the figure, it means that the container starts normally, but you still have to wait about one minute before you can access the visualization platform.
Access address http://localhost:5601/
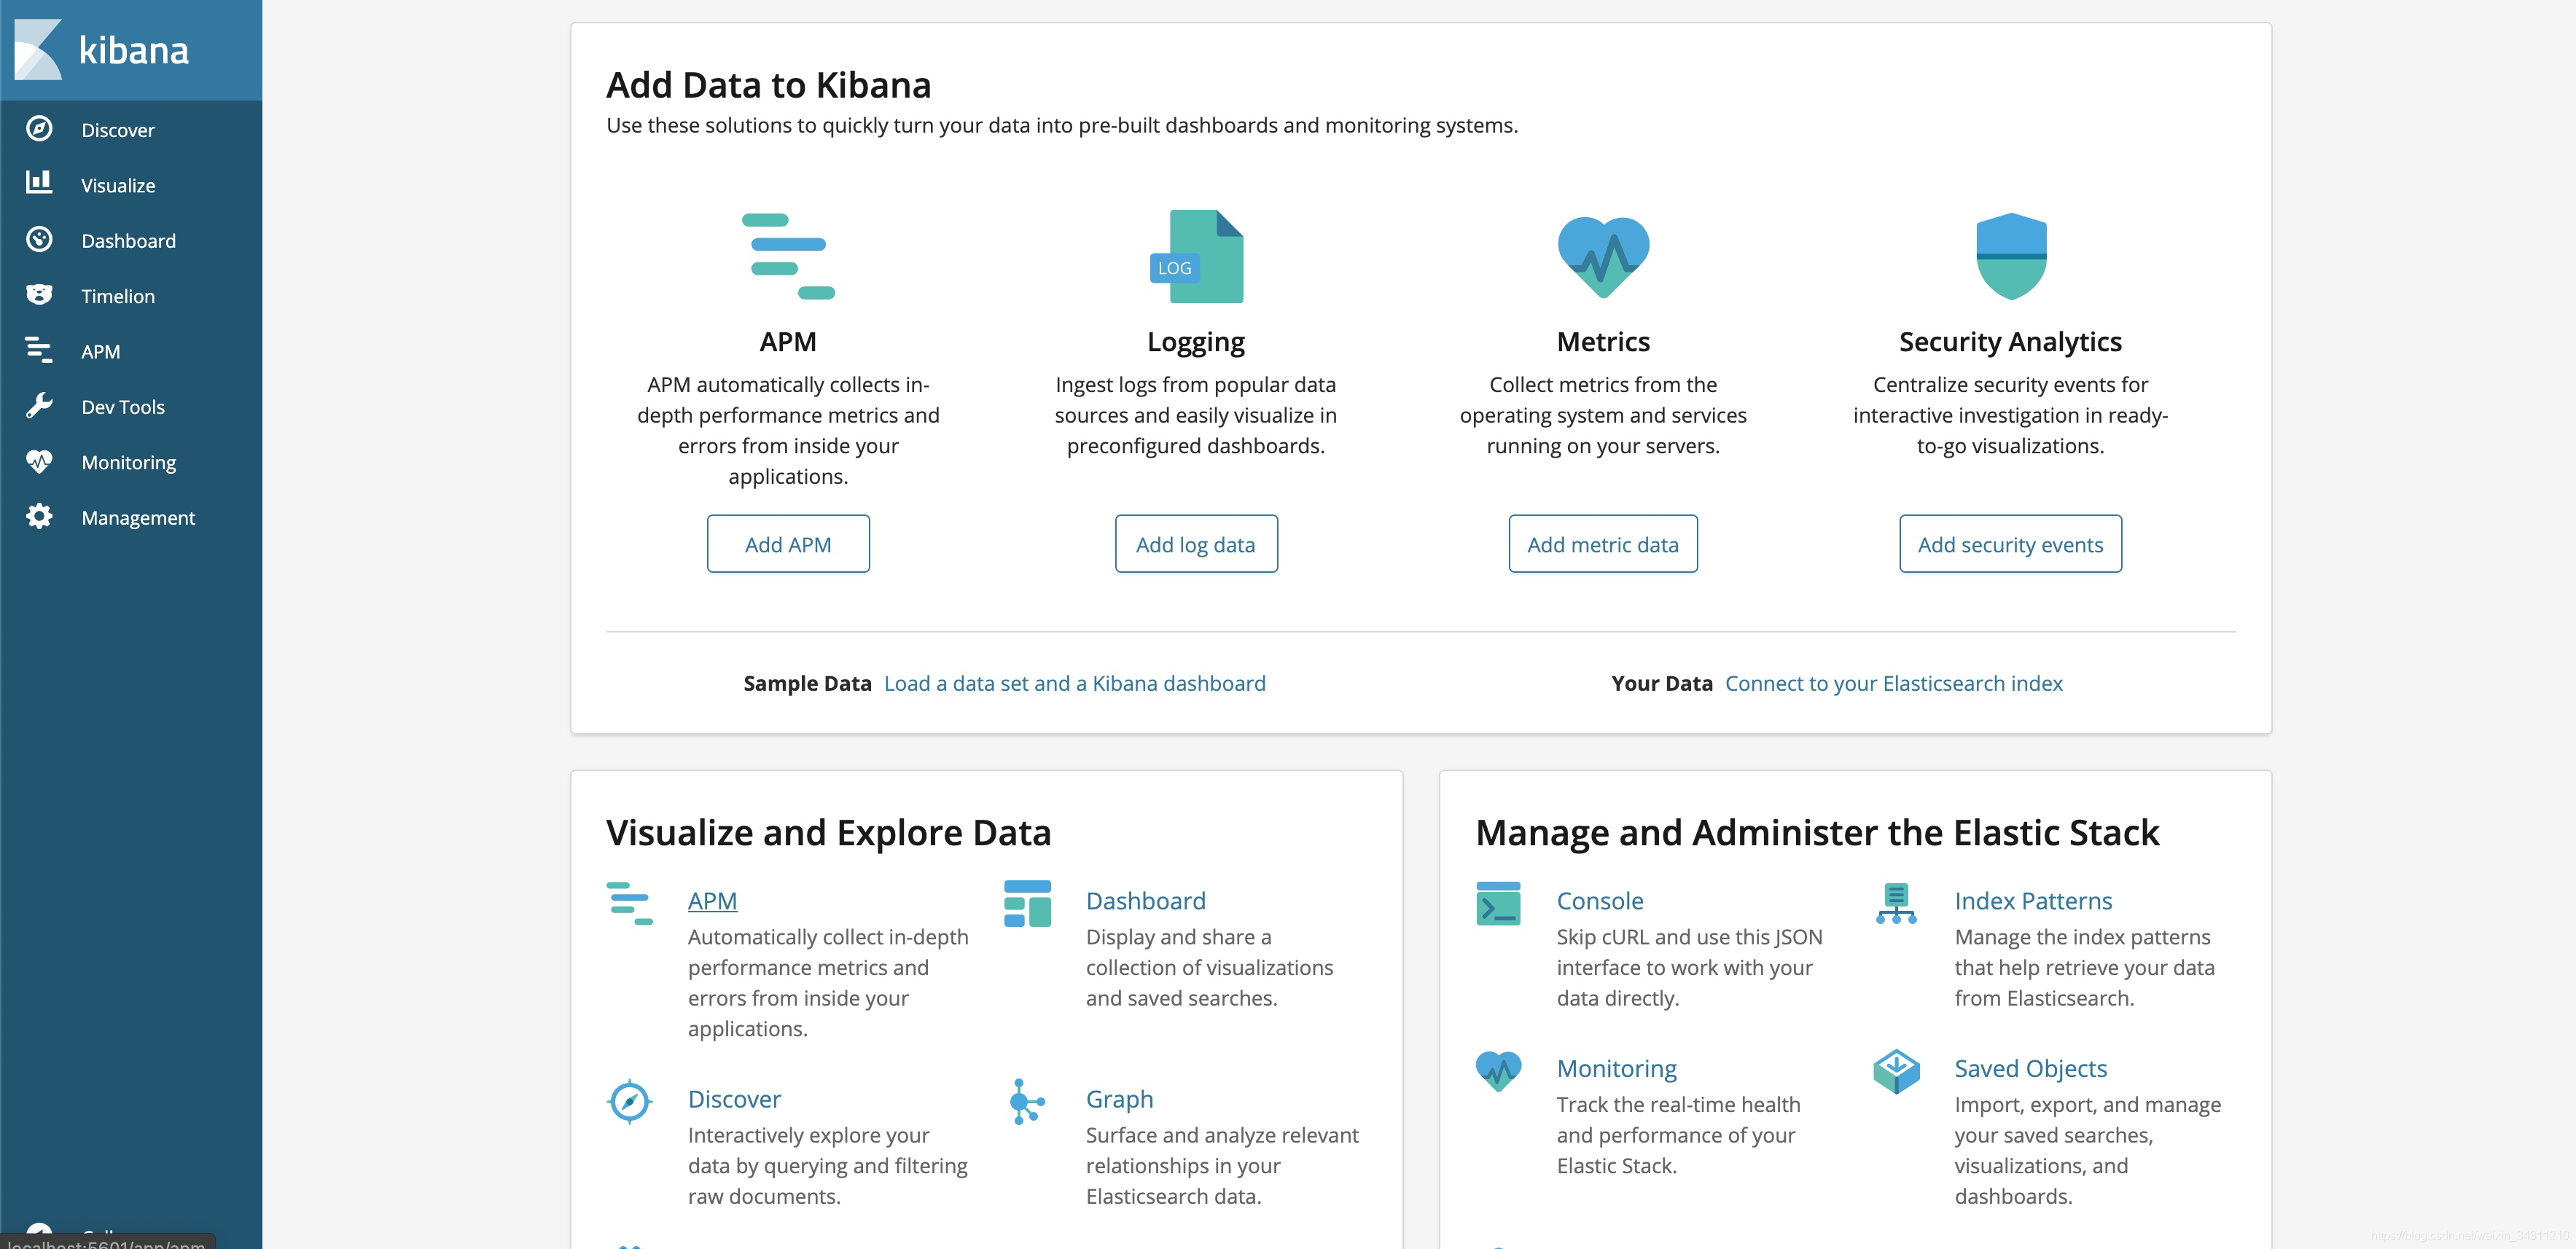
If this page appears, it means that the elk has been built, and now we need to stuff some data into it
[Initiate an offense] Send request
After the elk environment is built, some data needs to be generated. how should I do it?
Just call http://localhost:8080/api?param1= to test the ELK interface, call it a few more times, and some test data will be generated.
In addition, some configuration needs to be done to allow es to collect these logs so that users can see:
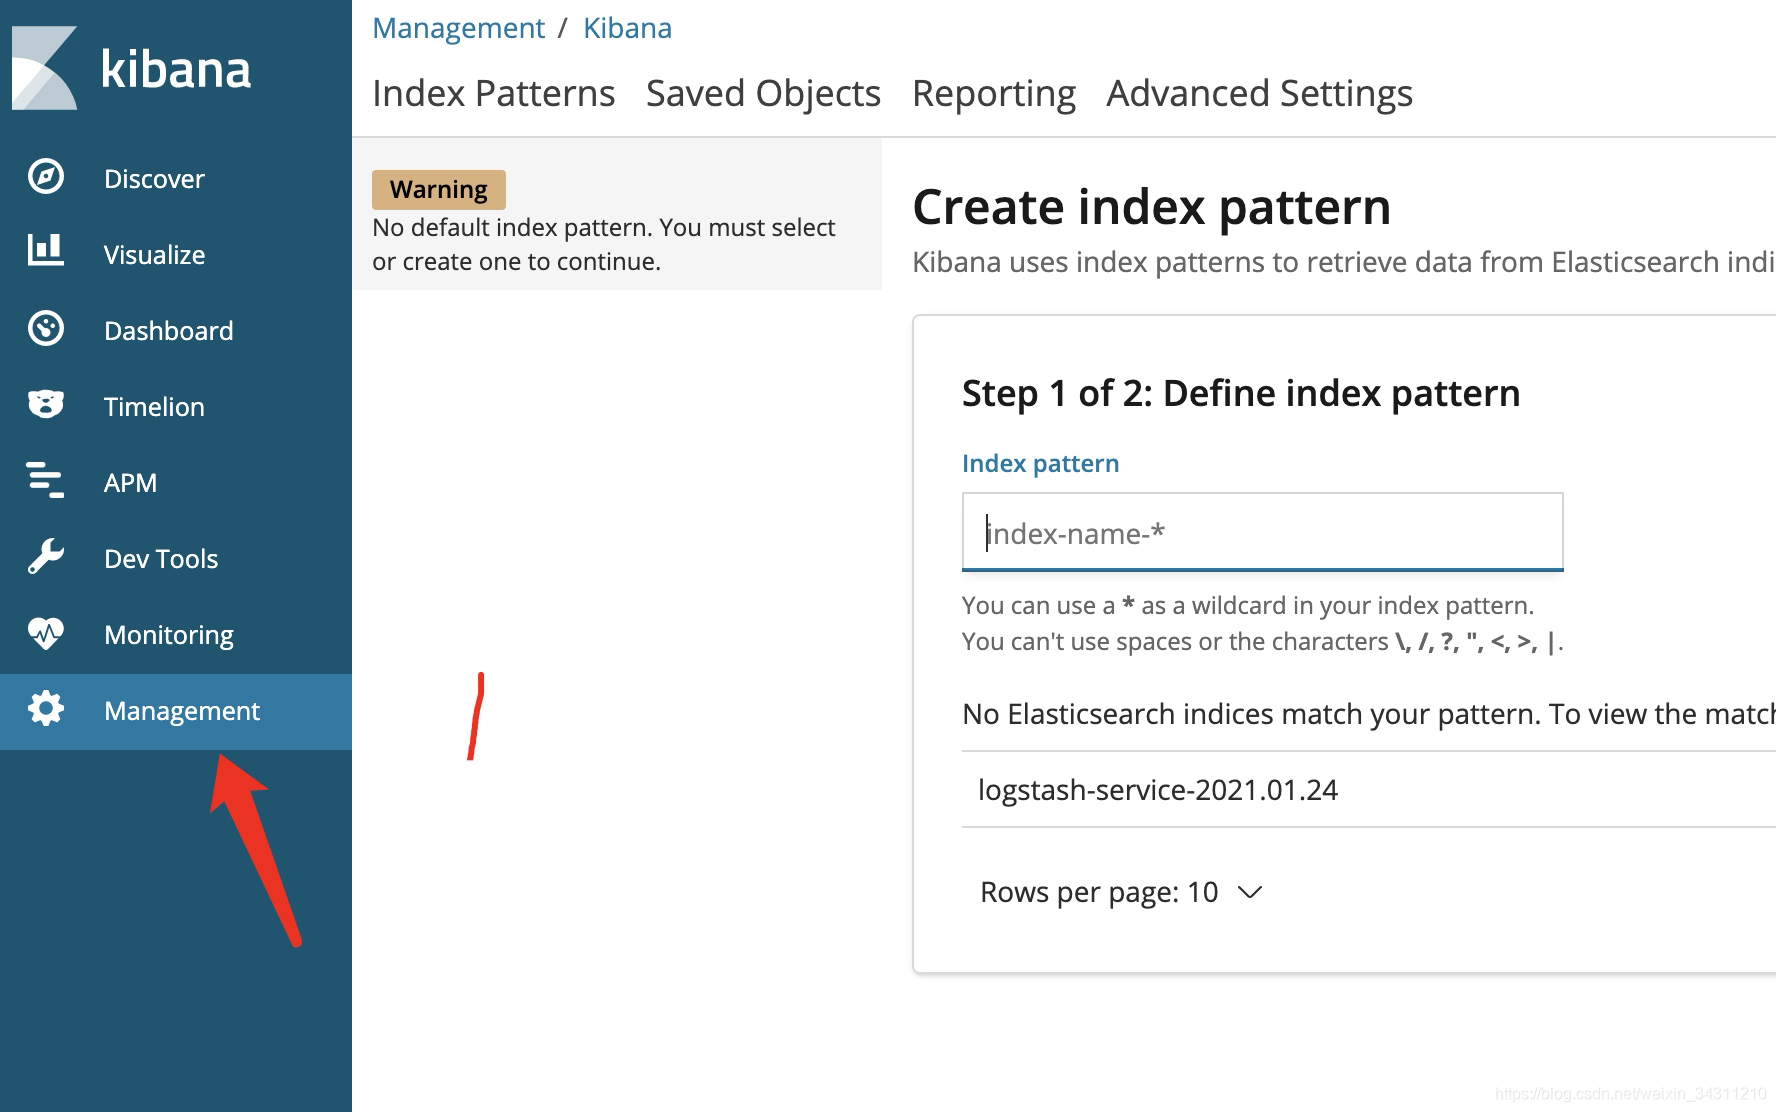
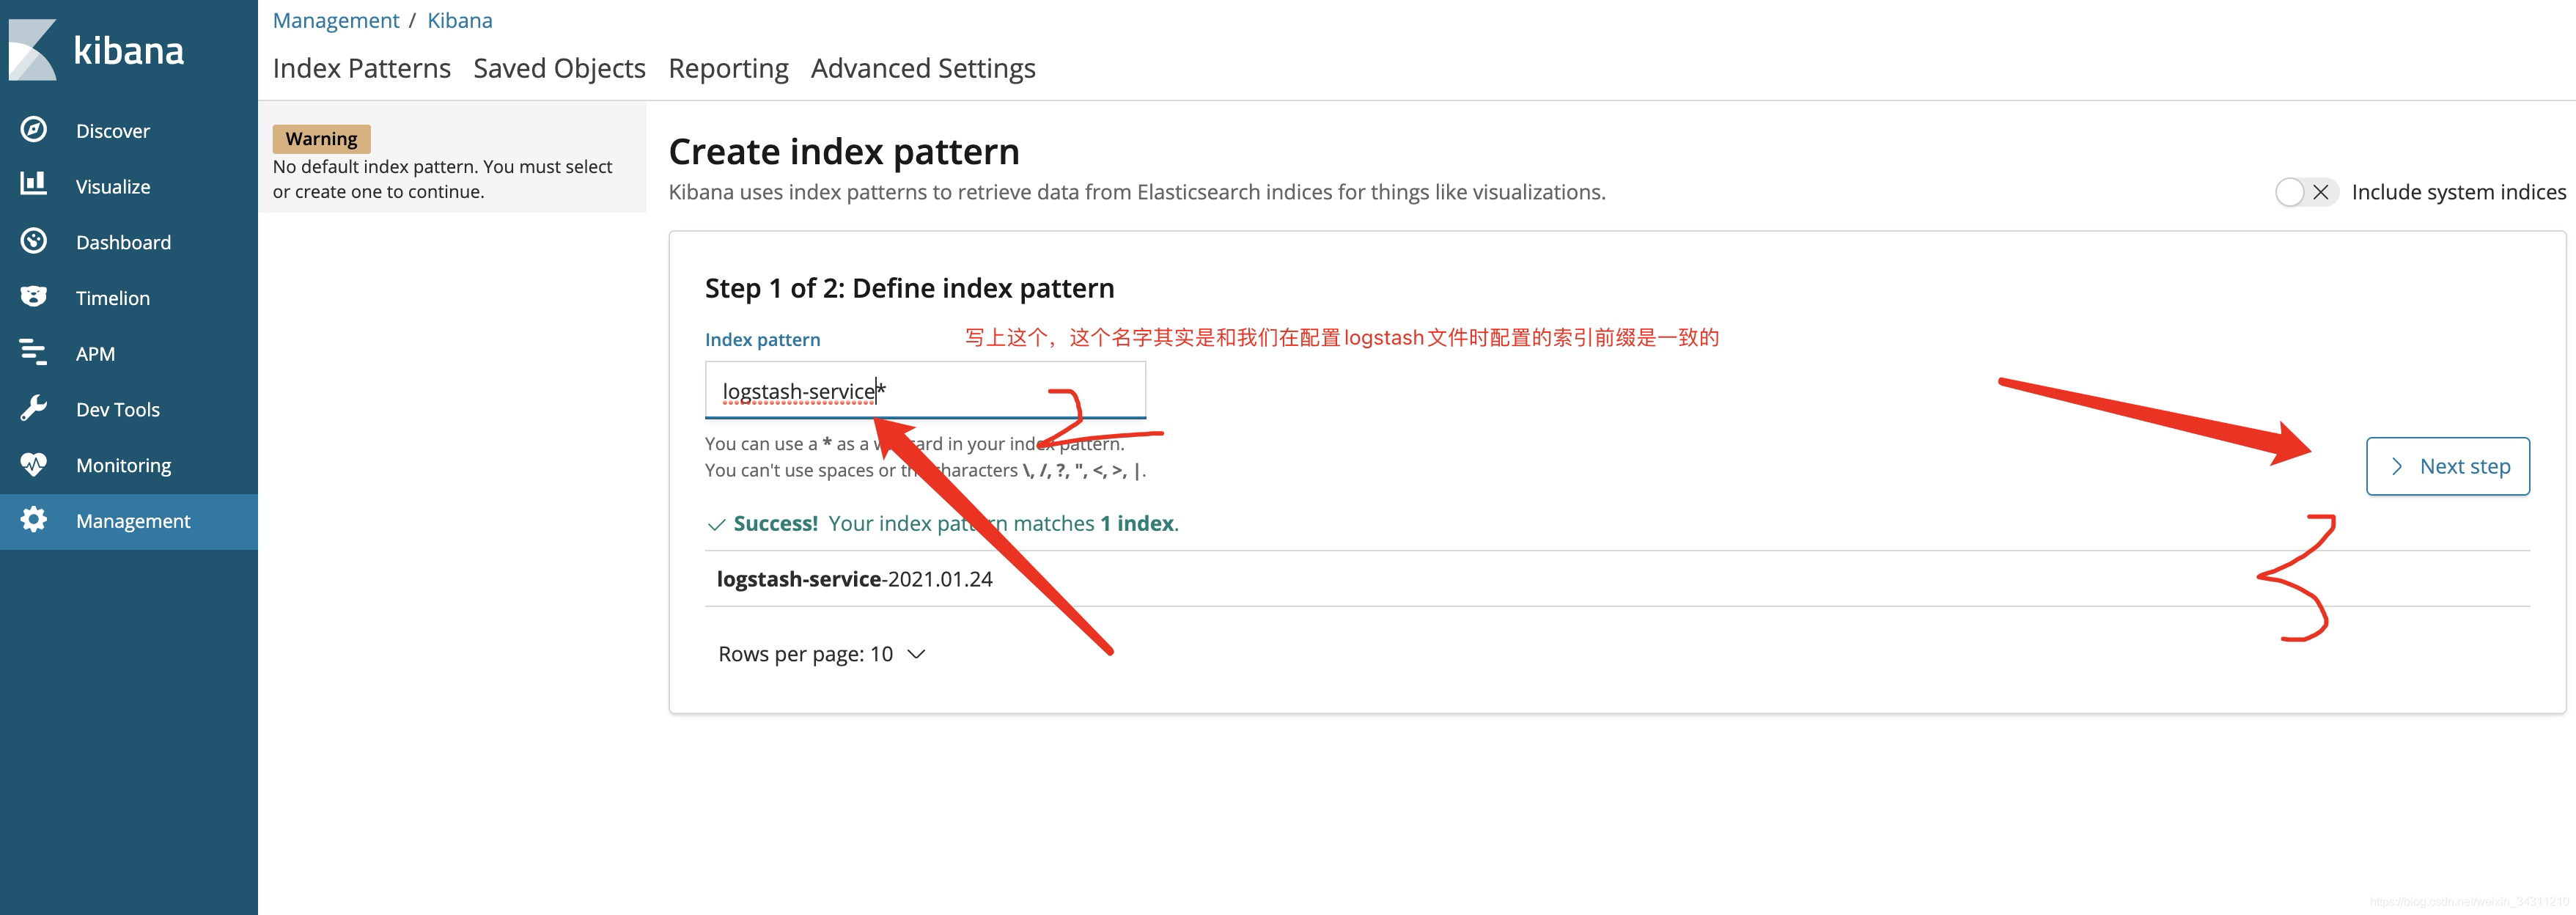
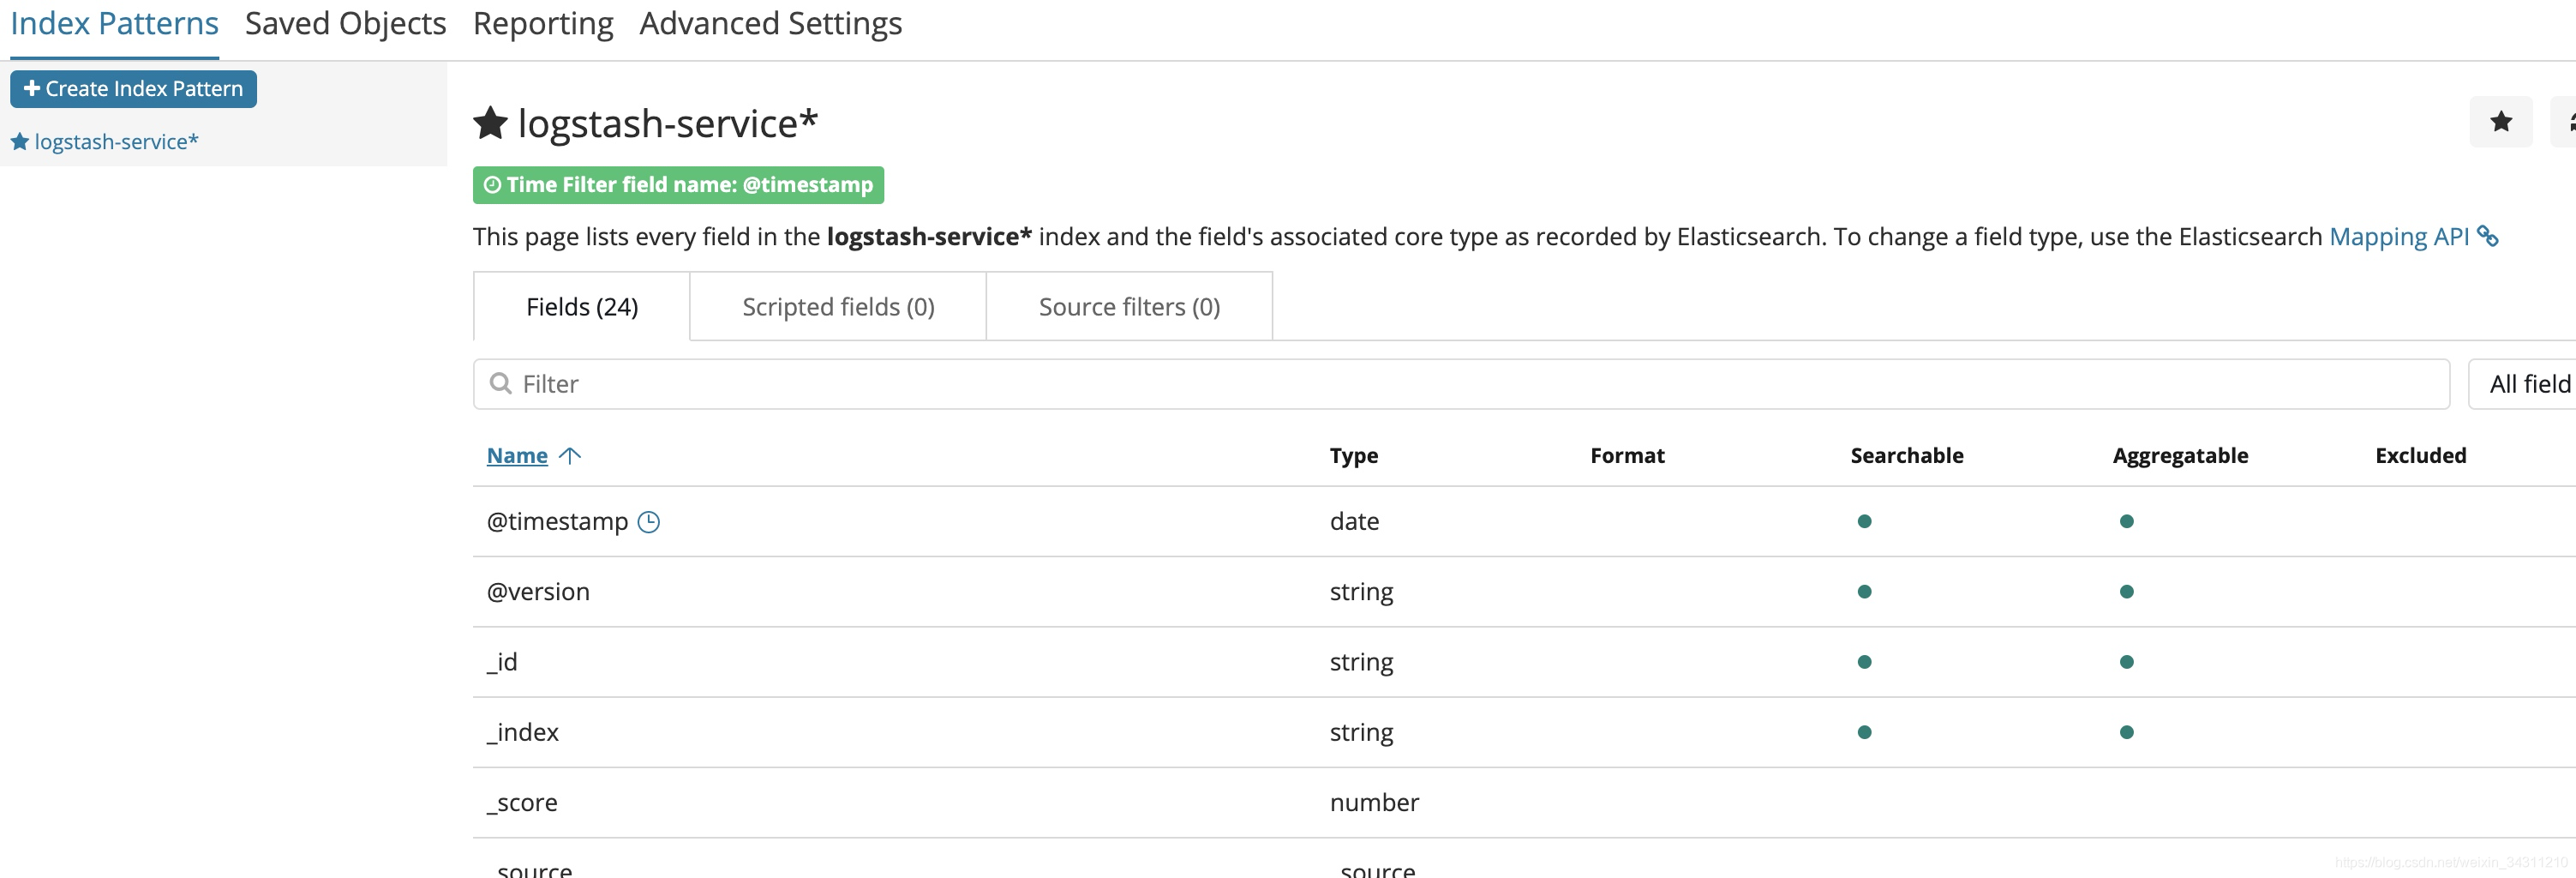
Select field, create index
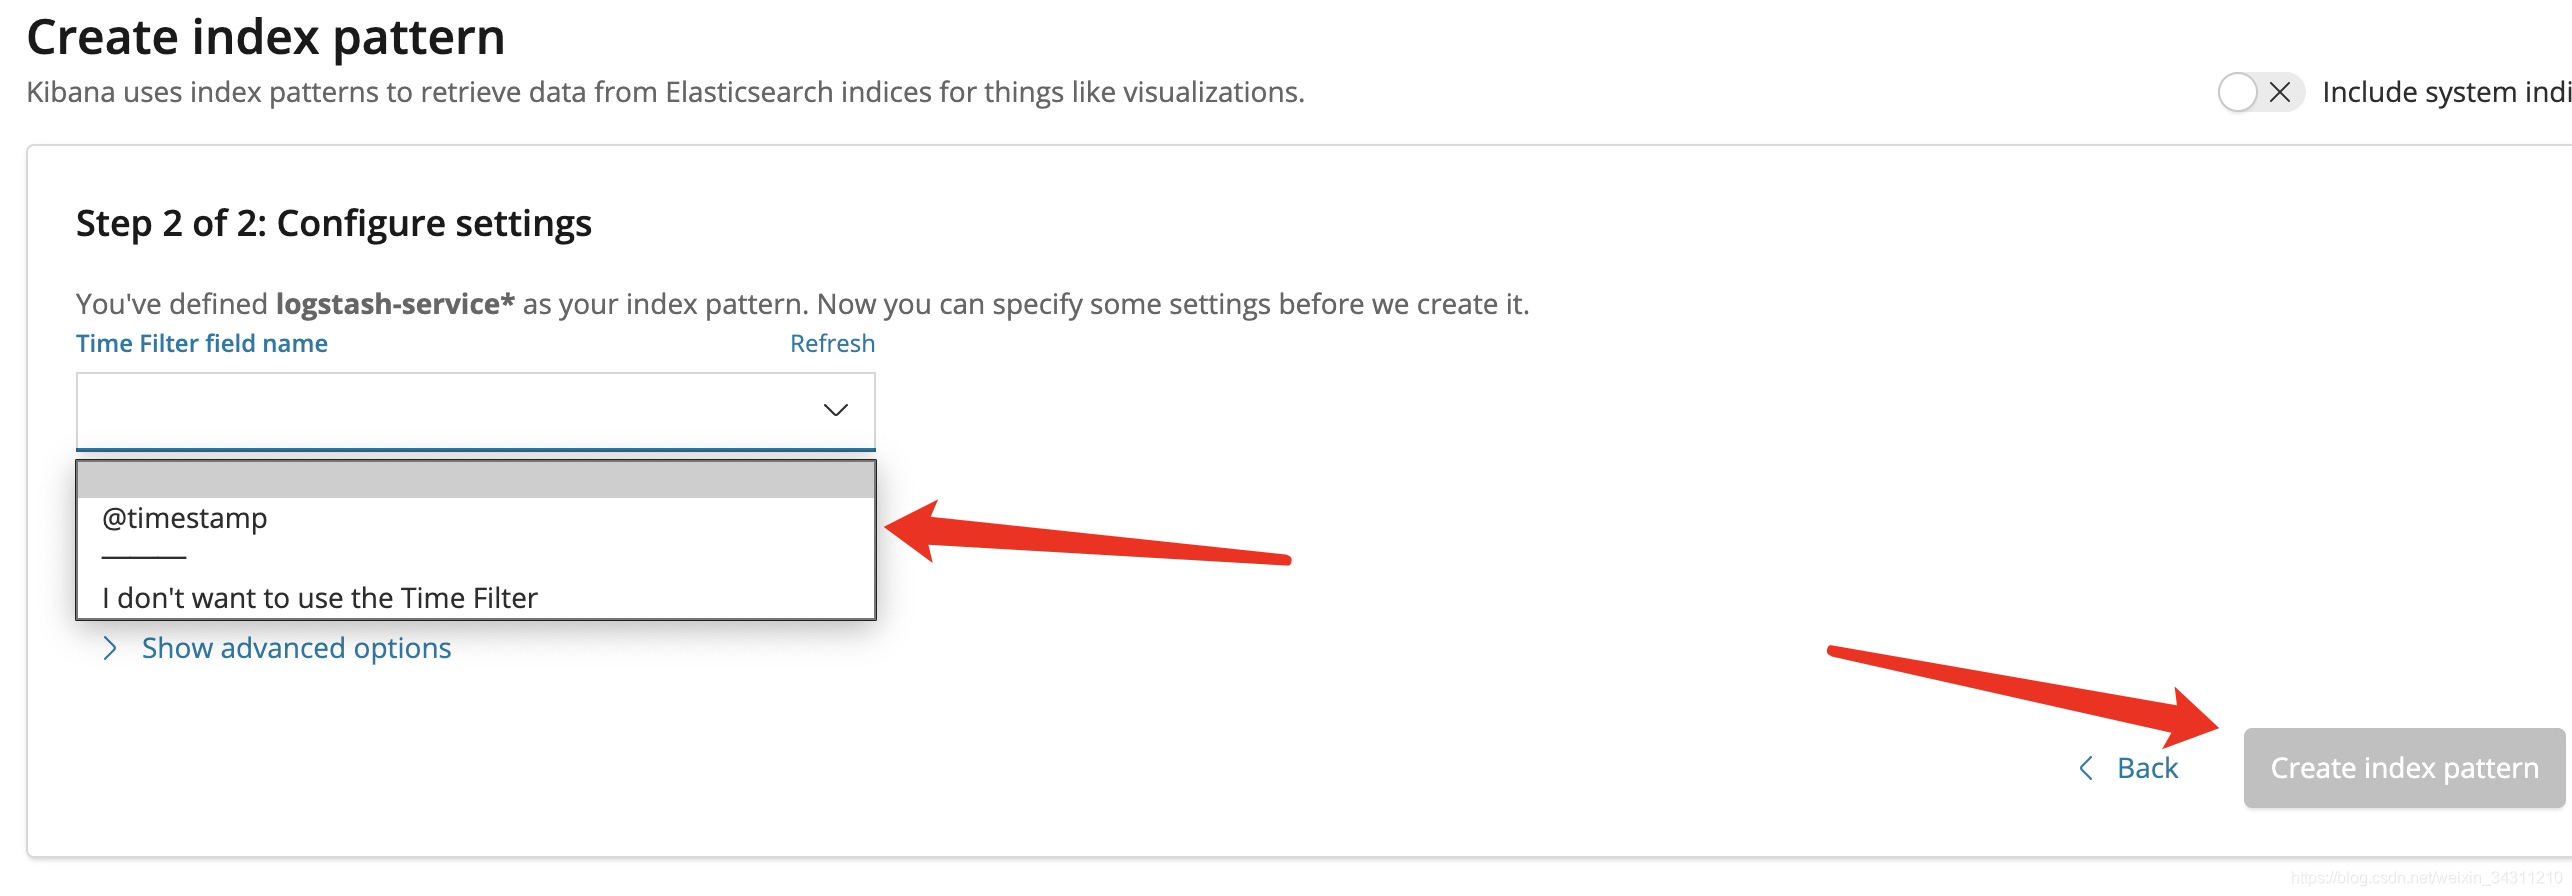
The interface after the index is successfully created
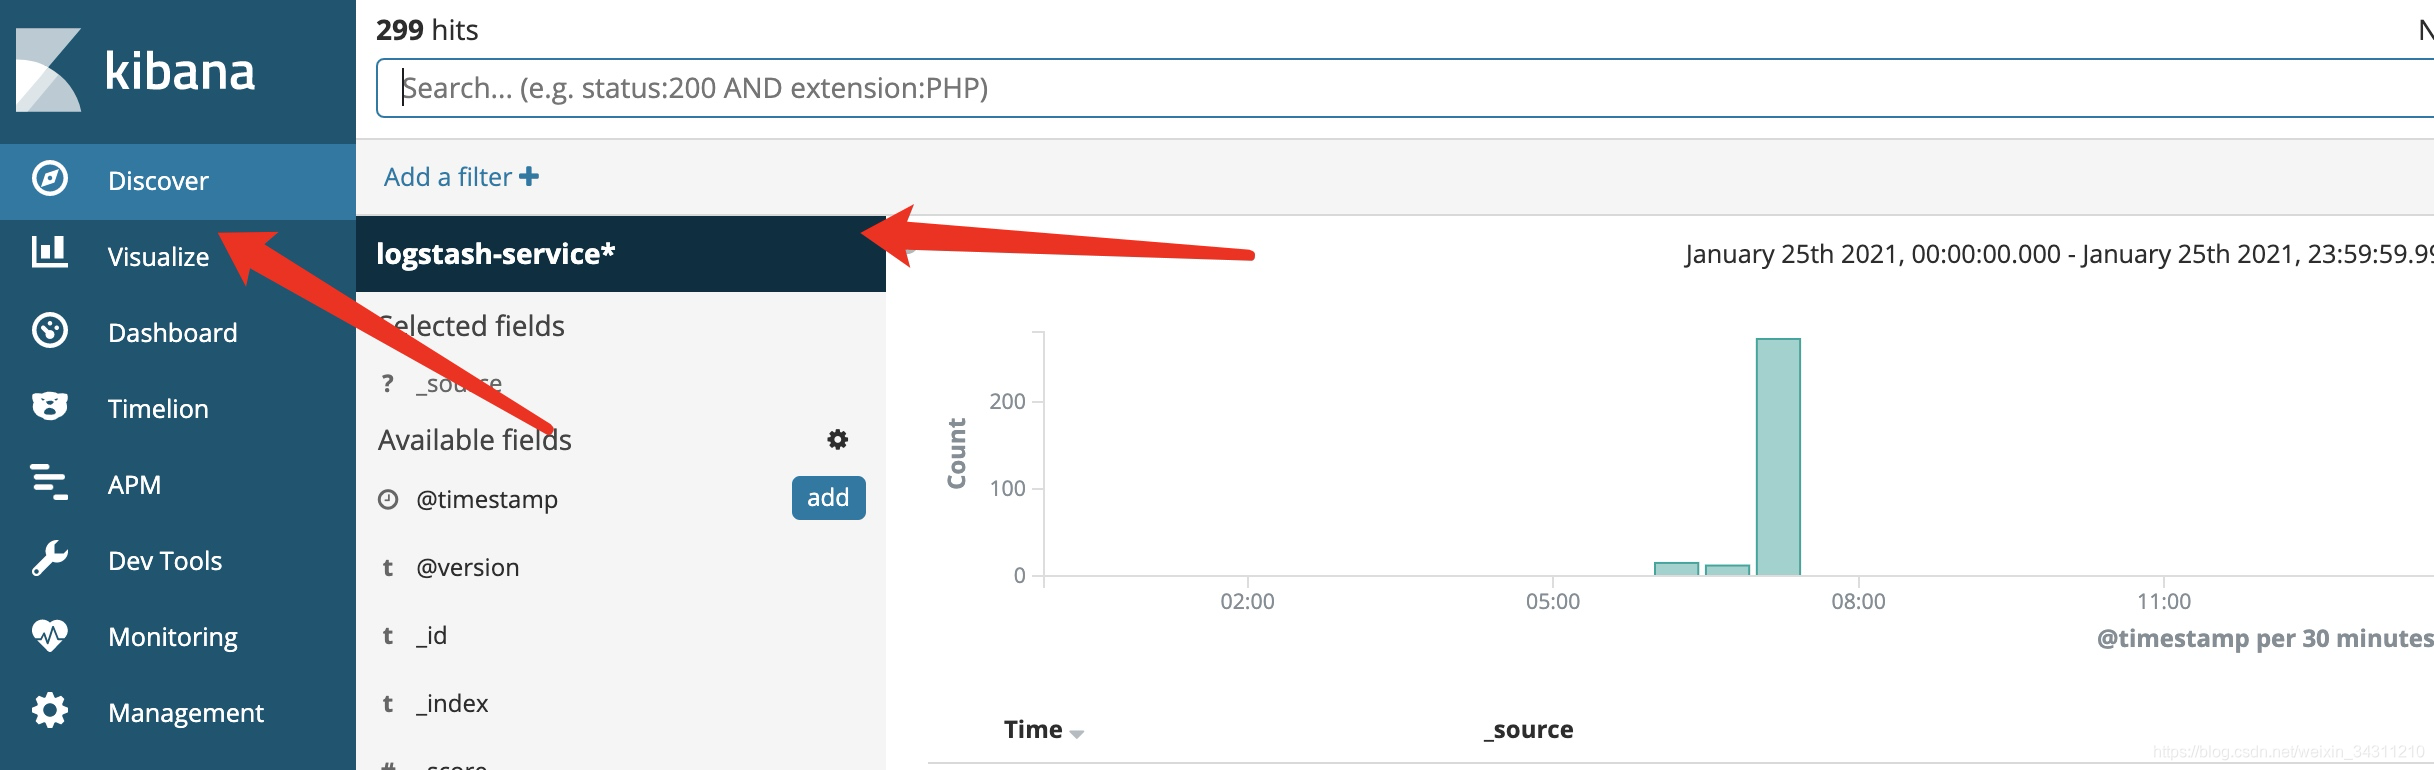
After selecting logstash-servicez, the interface is like this:
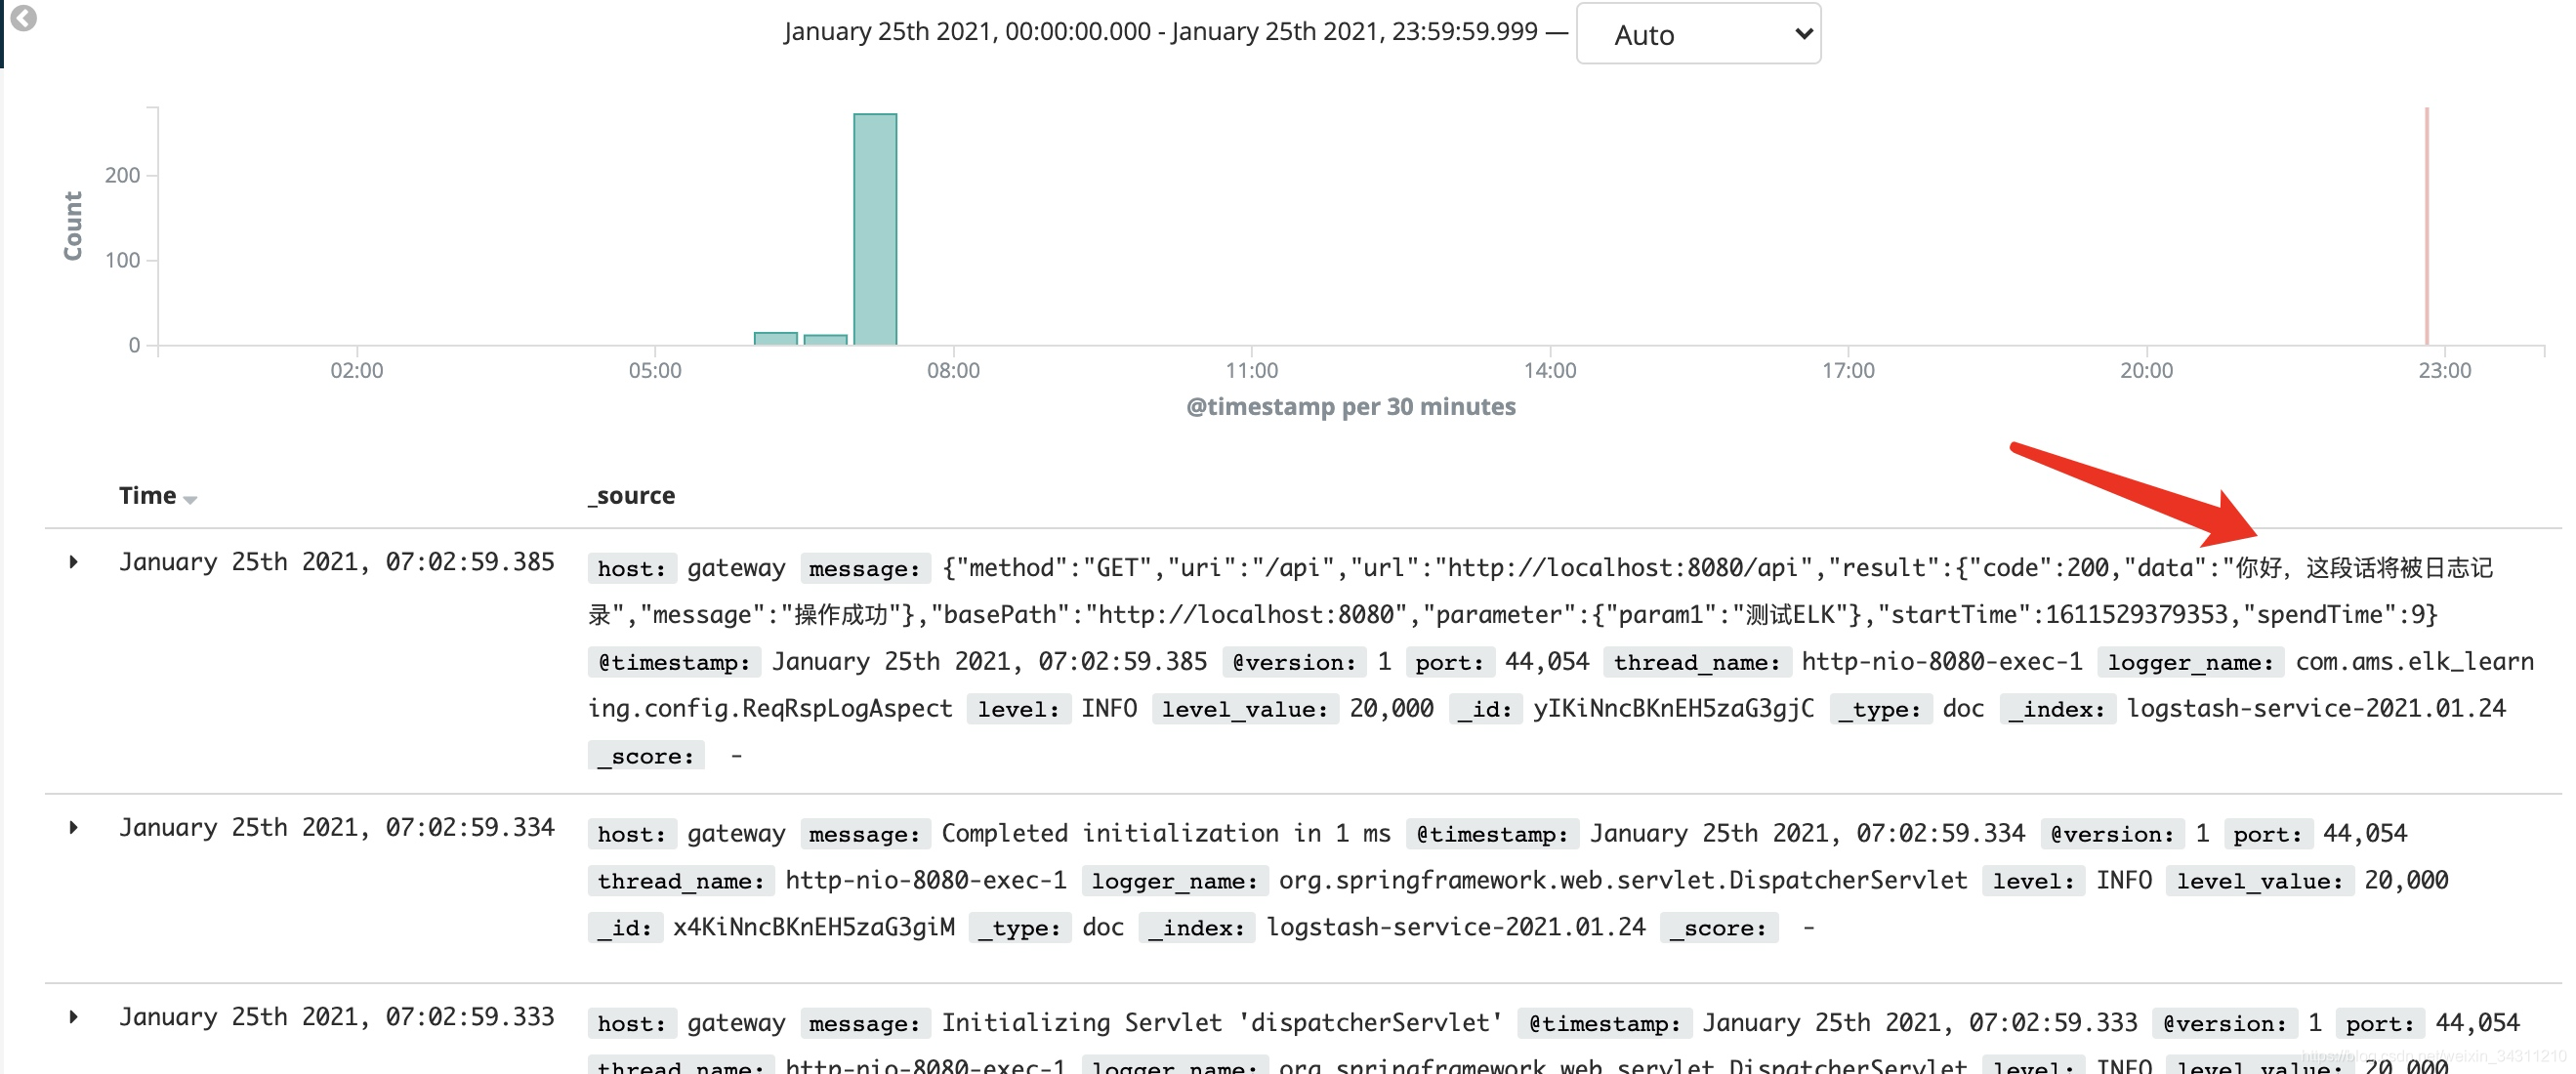
You can see that the logs in the system have been collected, try searching for "Hello"
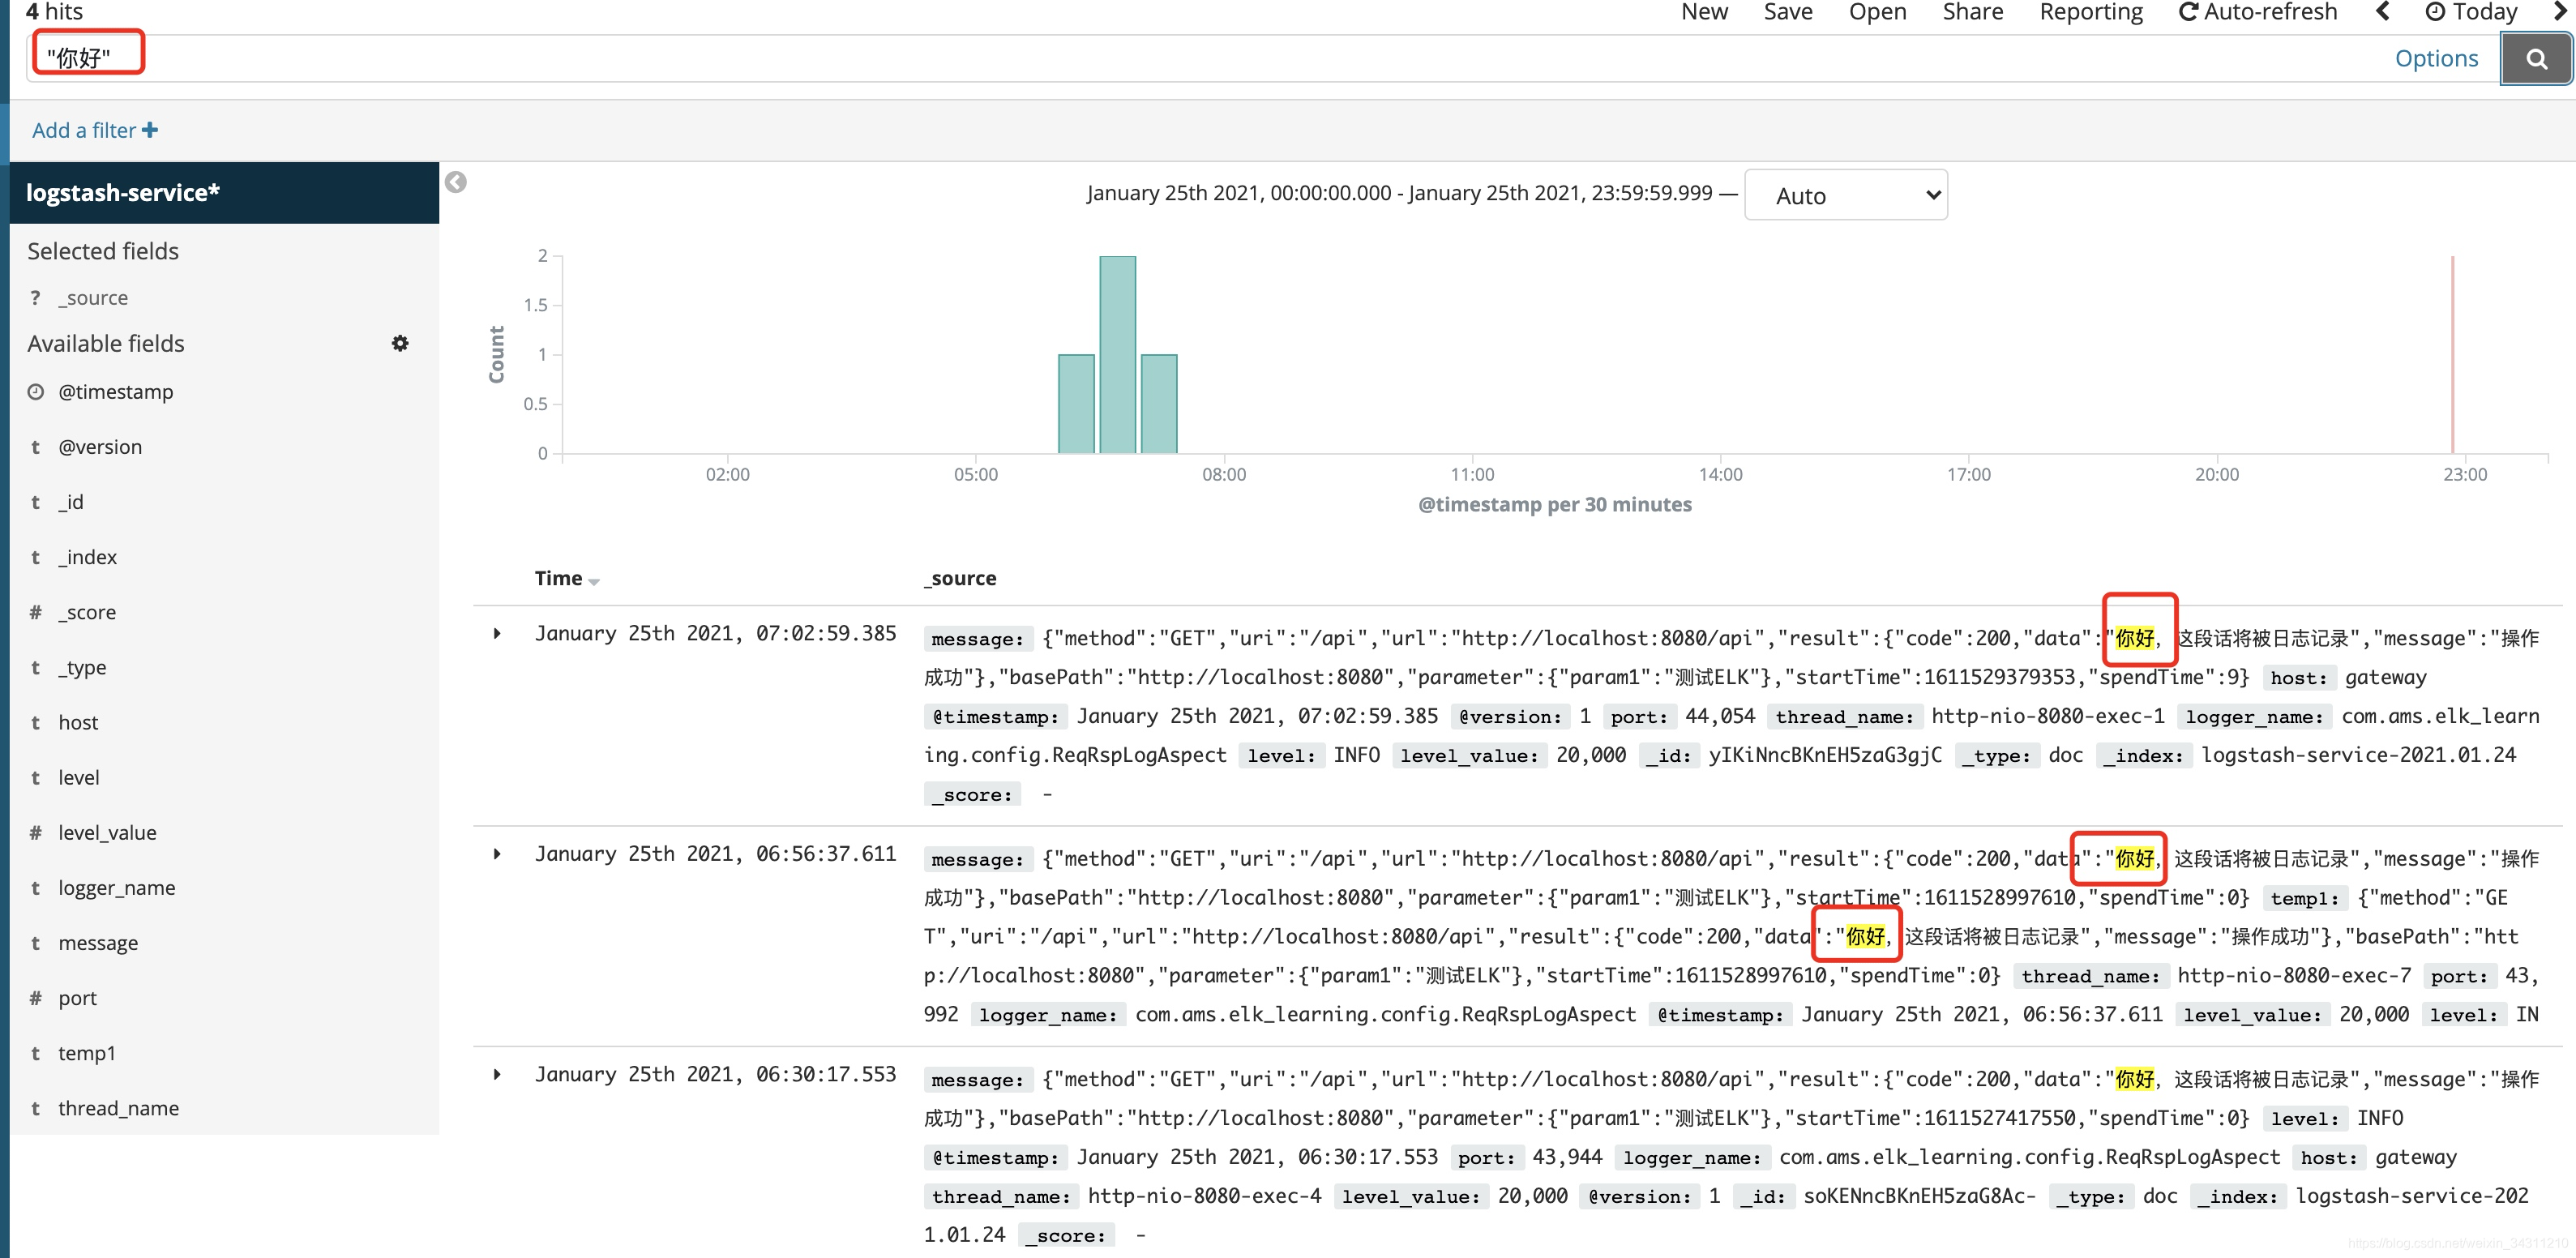
All logs containing "Hello" are filtered out. Of course, there can be many search conditions. For example, there is a time filter search in the upper right corner. I will not demonstrate them one by one. If you are interested, you can study it yourself.
Repository: https://gitee.com/yangleliu/learning.git
Five good young people who are helpful and unselfish-I have uploaded all the above codes to the git repository, you can get it yourself, remember to start
[Summary after the war]
Every new technology appears to solve a certain type of problem.
Just like the emergence of elk, it is to reduce the time that the code siege lions who are losing hair gradually find data from the massive log, and save more energy on business processing.
With elk, we only need to easily enter keywords in the input box, hit enter, and the required data will be presented to us.
The waiting time for the test lady is shorter, the mood is better, and there are naturally fewer contradictions.
Thinking about it this way, if there is a platform to show the reasons for the 100,000 emotional outbursts of his girlfriend in real time, what a beautiful tomorrow the world will be!
Lie ~
If you are interested, you can give me a thumbs up. I will be more motivated to bring you better practical articles. I will optimize this logging system later and introduce a more mature architecture filebeat+kafka+logstash +Elasticsearch+kibana, stay tuned!