At the end of the year, everyone was miserably abused by reports. Dozens of reports had to change data. At this critical moment, Excel would be as slow as a snail. In fact, this should be a very common demand and problem for Excel users!
Friends who are familiar with us all know that we can use Excel fusion analysis to realize self-service data access and self-service analysis in Excel, which can solve the problems of Excel while retaining the advantages of Excel. The following wheat summary lists a few more common problem scenarios to illustrate how to solve it!
scene one
Author business people
Problem Description:
1. There are dozens of Excel report templates. If you want to reuse these templates, you need to periodically fetch the numbers and replace the detailed data.
2. Need technical staff to help regularly fetch and update detailed data. In particular, periodic and repetitive data acquisition must also be generated separately, data preparation is completely dependent on IT, and the response is not timely enough.
solution:
The above problems can be solved by operating on the Excel interface through Excel fusion analysis and combining the characteristics of template data separation with self-service access .
In the product, IT only needs to help business users to make data catalogs and make wide tables. Business users can automatically fetch data through data sets and perspective analysis for processing. After processing, drag the result fields directly into Excel and refresh. , The data comes out. For periodic and repetitive access requirements, we can solve them through parameter filtering and permission settings.
The customer repurchase analysis template as shown in the figure below includes five sheet pages including repurchase growth analysis and repurchase conversion analysis. The first four sheets are analysis templates, and their data comes from the sheet page of the data sheet.
In the data table, the blue column data is the original customer data, and the yellow data is the analysis data derived from the evolution of the blue original data. We only need to replace the original data in the blue part, and the data in the yellow part is automatically calculated.
The other analysis template data comes from the yellow part of the data, so the original data changes, the template data can be changed, so as to achieve template reuse.
| Pre-emption number
Business personnel can self-service data access through perspective analysis, which can be generated by checking it, which is very simple.
| Drag and replace
Drag and drop the perspective analysis field in the Excel fusion analysis to replace the original data in the blue part, then the entire template data can be changed, and the Excel template can be reused.
In addition, for some report templates that periodically need to replace data, such as weekly reports, monthly reports, annual reports, etc., we can also set dynamic date parameters , so that the latest time data can be obtained by default when the report is opened. And through scheduled tasks to send to relevant personnel on a regular basis, truly improve work efficiency and reduce repetitive workload.
Scene two
Author Data Analyst
Problem Description:
Users use the pivot table for exploratory analysis in Excel, and the ultimate goal is to view the exploratory results. However, because the amount of data is relatively large, such as hundreds of thousands, the exploration of the pivot table is very slow.
solution:
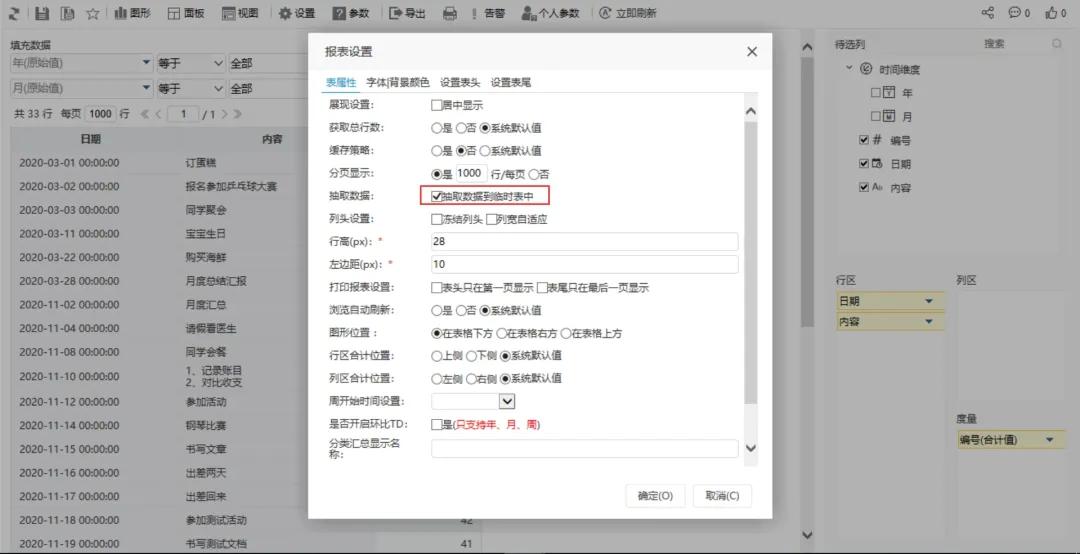
First of all, we can use the function of [load 100 rows by default] to perform pivot table exploration and analysis based on 100 rows of sampled data, which solves the problem of slow pivot table exploration and analysis.
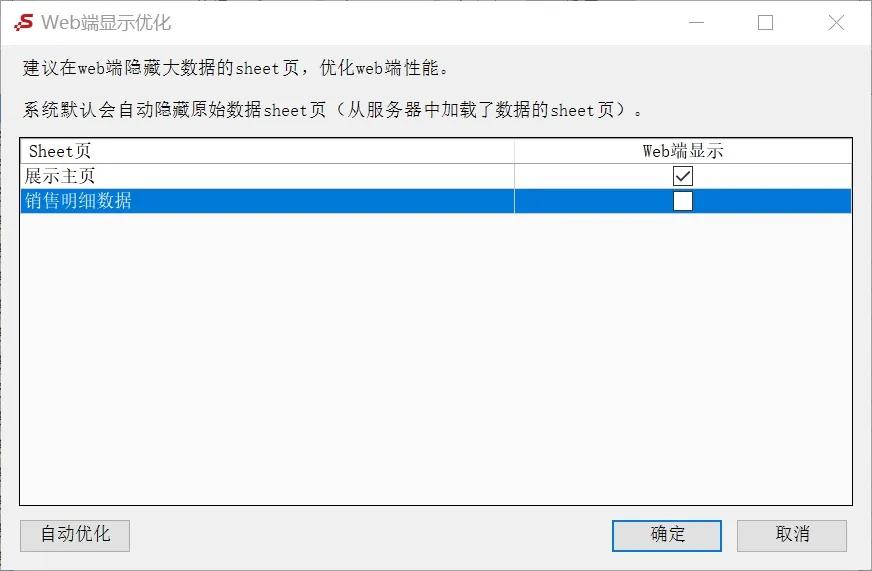
Then, we publish the exploration results and load them with the full amount of data when they are finally displayed on the Web side, so that the final view of the exploration results is the full amount of data.
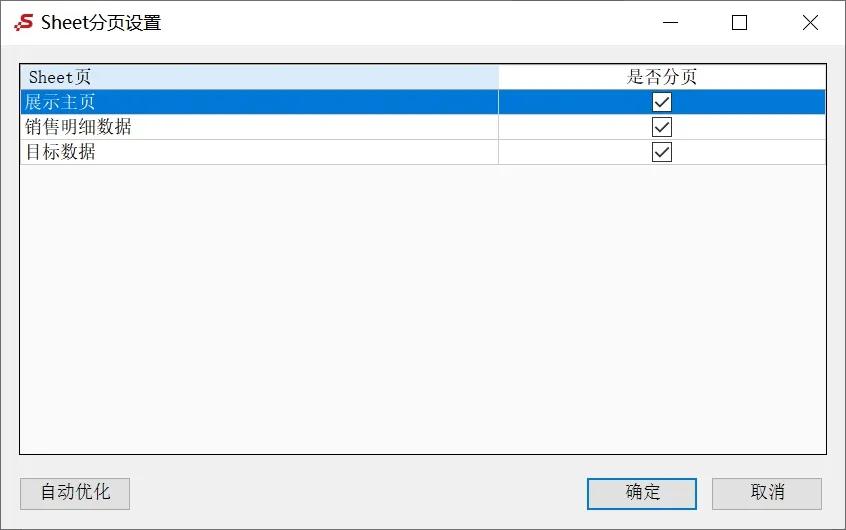
We can also continue to optimize performance through Sheet page pagination settings and Web-side display optimization settings .
In addition, Excel has the following typical performance problems:
The problem "When the amount of detailed data is too large, it may exceed tens of millions and cannot be loaded into Excel for analysis" can be solved by perspective analysis summary + sampling to the MPP cache library .
The problem "The calculation formula in the Excel sheet is complicated, and Excel opens slowly, which may take tens of minutes" can be solved by opening it on the Web and exporting a static file without formula .
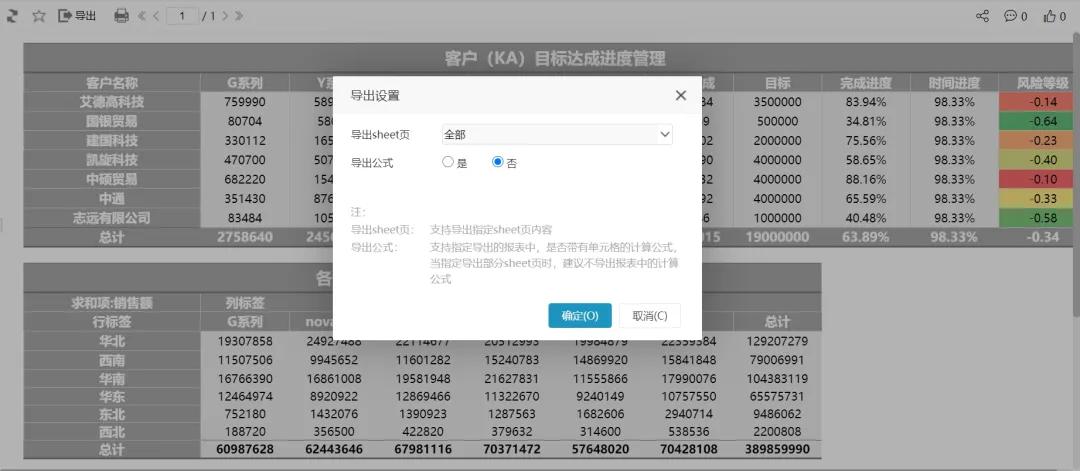
Scene three
Proposer Business Manager
Problem Description:
Reports made by Excel are not convenient for sharing and for grading permissions. The prepared report hopes that it can be easily shared with different people for viewing, and the data permissions can be controlled. Examples of permission requirements:
1. Admin administrator users can view all areas, detailed data sheet pages, discount column data.
2. Users under the North China and East China user groups can only see the data in this area. For example, users under the North China user group can only see the data in North China.
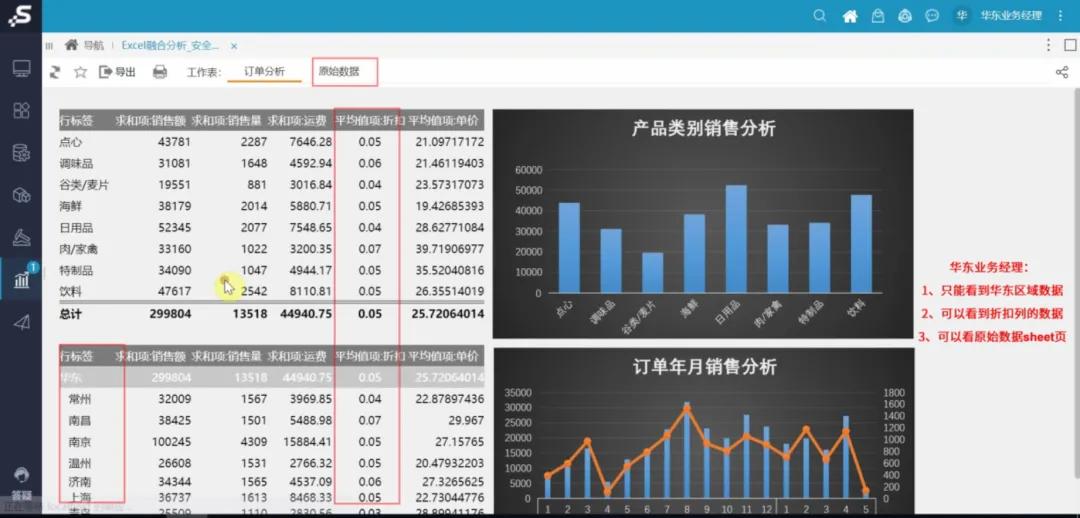
3. The business manager of each area can see the data of the detailed sheet page, and can see the data of all the columns in the report.
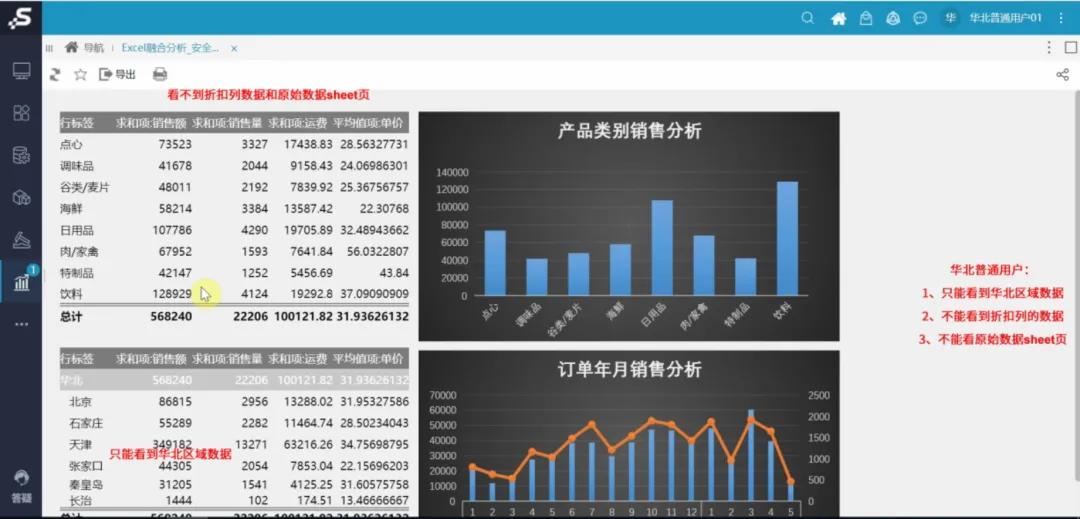
4. Ordinary business personnel in each area are not allowed to see the data in the detailed sheet page, and cannot see the data in the "discount" column in the report.
The administrator user opens the report to view:
North China business manager opens the report:
The East China business manager opens the report:
Ordinary users in North China open the report:
solution:
1. Realize different data viewed by different users under different user groups through data row permissions.
2. Realize the permission configuration of the detailed sheet page and the "discount" column in the report through the permission setting in the report.
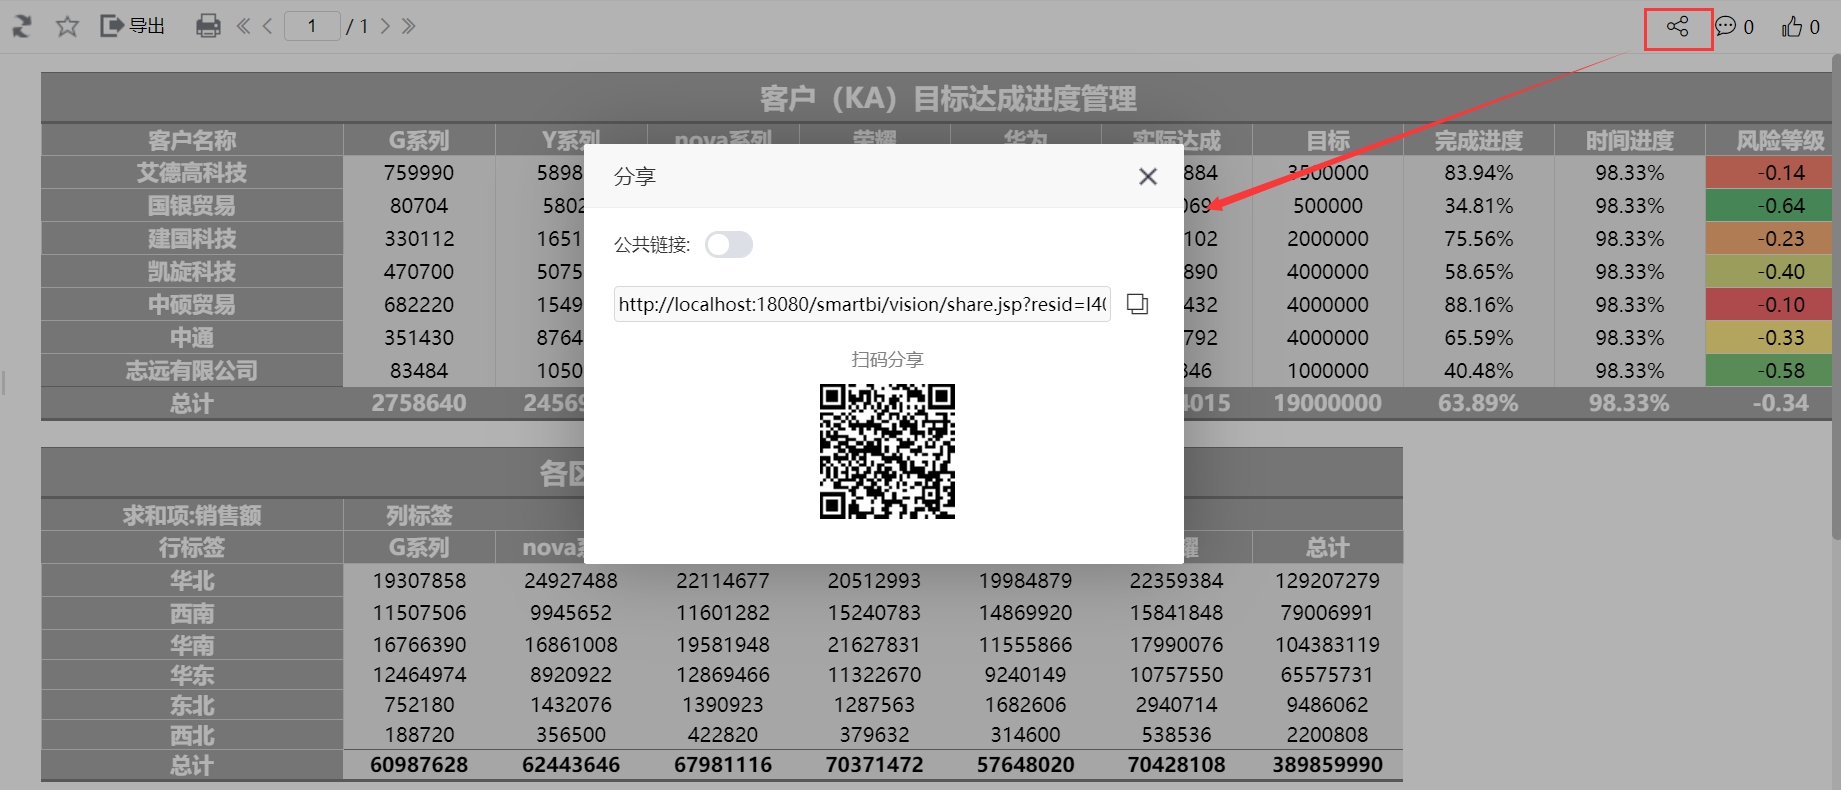
3. By publishing to the web for sharing, we can also share the published report through a web link.