The following uses the k-nearest neighbor algorithm (KNN) and the support vector machine (SVM) algorithm for handwritten digit recognition.

Data set:
Baidu network disk extraction code: j13s
CSDN resources
Project training goals
- Learn to call the data set, use Python related programs to read data from the data set
- Learn to train classifiers based on data sets and implement algorithms in Python
- Learn to use the learned knowledge to complete the classification procedure of the actual data set
- Learn to observe and analyze the meaning, function and impact of relevant parameters in the algorithm
- Learn to compare different algorithms and learn to analyze the advantages and disadvantages of each algorithm
Enter the text, if you are Xiaobai and don’t know how to install modules, you can look at me
Import module
- First we have to import the required libraries
from sklearn.model_selection import GridSearchCV
from sklearn import svm
from sklearn.model_selection import train_test_split
from sklearn.preprocessing import StandardScaler
from sklearn.neighbors import KNeighborsClassifier
import operator
import pandas as pd
import numpy as np
import os
import pprint
import matplotlib.pyplot as plt
from matplotlib.pylab import style
- At the same time set matplotlib drawing Chinese display garbled problem
%matplotlib inline
#解决中文显示问题
plt.rcParams['font.family'] = ['sans-serif']
plt.rcParams['font.sans-serif'] = ['SimHei']
plt.rcParams['axes.unicode_minus'] = False
- Switch to data path
path = r"C:\Users\Administrator\homework\机器学习\digits"
os.chdir(path)
Read data
Training set
# 获取数据文件
fileList = os.listdir(r'trainingDigits')
# 定义数据标签列表
y_train = []
# 添加数据标签
for filename in fileList:
    y_train.append(int(filename.split('_')[0]))
# 定义矩阵数据格式
x_train = np.zeros((len(y_train),32*32))

# 获取矩阵数据
index = 0
for filename in fileList:
    with open(r'trainingDigits\%s'%filename, 'rb') as f:
        # 定义一个空矩阵
        vect = np.zeros((1,1024))
        # 循环32行
        for i in range(32):
            # 读取每一行数据
            line = f.readline()
            # 遍历每行数据索引  line[j] 即为数据
            for j in range(32):
                vect[0,32*i+j] = int(line[j])
        x_train[index,:] = vect
        index+=1
Observe the structure of the data
x_train.shape
(1934, 1024)
Data distribution
df = pd.DataFrame(y_train,columns=["数字"])
a = df["数字"].value_counts().sort_values()
Distribution

Test set
fileList2 = os.listdir(r'testDigits')
# 定义数据标签列表
y_test = []# 获取数据标签
for filename2 in fileList2:
    y_test.append(int(filename2.split('_')[0]))
# 定义矩阵数据格式
x_test = np.zeros((len(y_test),1024))
# 获取矩阵数据
index = 0
for filename2 in fileList2:
    with open(r'testDigits\%s'%filename2, 'rb') as f:
        # 定义一个空矩阵
        vect = np.zeros((1,1024))
        # 循环32行
        for i in range(32):
            # 读取每一行数据
            line = f.readline()
            # 遍历每行数据索引  line[j] 即为数据
            for j in range(32):
                vect[0,32*i+j] = int(line[j])
        x_test[index,:] = vect
        index+=1
Data distribution
df = pd.DataFrame(y_test,columns=["数字"])
c = df["数字"].value_counts().sort_index()

- By distributing the data, we know that the data is distributed smoothly in the test set and training set
Model construction
KNN
error = 0
total = len(y_train)
def KNN(n_neighbors):
    knn = KNeighborsClassifier(n_neighbors=n_neighbors)#超参数N
    #利用训练数据拟合模型
    knn.fit(x_train,y_train)
    # 预测数据
    y_predict = knn.predict(x_test)
#    print(1 - sum(y_predict ==y_test)/len(y_predict))
    print("超参数n="+str(n_neighbors)+"时,模型的错误率:"+str(1 - knn.score(x_test,y_test)))
    return 1-knn.score(x_test,y_test)
correct=[]
for i in range(1,11):
    correct.append(KNN(i))
超参数n=1时,模型的错误率:0.01374207188160681
超参数n=2时,模型的错误率:0.023255813953488413
超参数n=3时,模型的错误率:0.012684989429175508
超参数n=4时,模型的错误率:0.016913319238900604
超参数n=5时,模型的错误率:0.019027484143763207
超参数n=6时,模型的错误率:0.022198731501057112
超参数n=7时,模型的错误率:0.023255813953488413
超参数n=8时,模型的错误率:0.024312896405919715
超参数n=9时,模型的错误率:0.026427061310782207
超参数n=10时,模型的错误率:0.024312896405919715
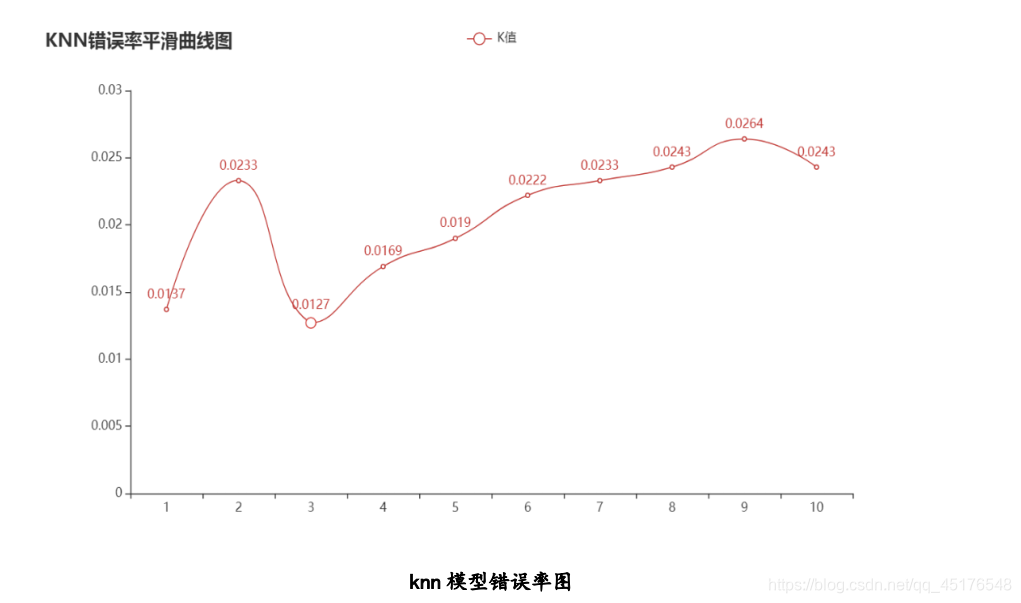
Draw error rate graphs under different k values
Use cross-validation grid search to select the optimal model
estimator = KNeighborsClassifier()
param_dict = {

    "n_neighbors": [1,2,3,4,5,6,7,8,9,10]}
estimator = GridSearchCV(estimator, param_grid=param_dict, cv=3)
estimator.fit(x_train,y_train)
y_predict = estimator.predict(x_test)
#print("比对预测结果和真实值:\n", y_predict == y_test)
score = estimator.score(x_test, y_test)
print("直接计算准确率:\n", score)
直接计算准确率:
 0.9873150105708245
Use f1-score to evaluate the model
from sklearn.metrics import classification_report
target_names = [str(i) for i in range(0,10)]
print(classification_report(y_test, y_predict, target_names=target_names))
              precision    recall  f1-score   support

           0       1.00      1.00      1.00        87
           1       0.96      0.99      0.97        97
           2       1.00      1.00      1.00        92
           3       0.98      0.99      0.98        85
           4       1.00      1.00      1.00       114
           5       0.99      0.98      0.99       108
           6       0.98      1.00      0.99        87
           7       0.98      1.00      0.99        96
           8       1.00      0.95      0.97        91
           9       0.99      0.97      0.98        89

    accuracy                           0.99       946
   macro avg       0.99      0.99      0.99       946
weighted avg       0.99      0.99      0.99       946
Model summary
- According to the error rate graph of the knn model, when the value of k is increased, the error rate will decrease first, because there are more samples around to learn from, and the classification effect will be better. But when the K value is larger, the error rate will gradually increase. In this model, the model has the lowest error rate when k=3.
SVM
Next, use support vector machine pair for model training
from sklearn import svm

# 创建SVC/Support Vector Classification/支持向量机分类器模型
svc_model = svm.SVC(gamma="auto", C=10)
# 将数据拟合到SVC模型中,此处用到了标签值y_train,是有监督学习
svc_model.fit(x_train, y_train)
score = svc_model.score(x_test,y_test)
y_predict = svc_model.predict(x_test)
print("直接计算准确率:\n",score)
直接计算准确率:
 0.9862579281183932
from sklearn.metrics import classification_report
target_names = [str(i) for i in range(0,10)]
print(classification_report(y_test, y_predict, target_names=target_names))
              precision    recall  f1-score   support

           0       1.00      1.00      1.00        87
           1       0.98      0.99      0.98        97
           2       0.99      0.99      0.99        92
           3       0.99      0.94      0.96        85
           4       0.98      1.00      0.99       114
           5       0.98      1.00      0.99       108
           6       0.99      0.99      0.99        87
           7       0.99      0.99      0.99        96
           8       1.00      0.98      0.99        91
           9       0.97      0.98      0.97        89

    accuracy                           0.99       946
   macro avg       0.99      0.99      0.99       946
weighted avg       0.99      0.99      0.99       946
def SVM(C):
    # 创建SVC/Support Vector Classification/支持向量机分类器模型
    svc_model = svm.SVC( C=C)
    # 将数据拟合到SVC模型中,此处用到了标签值y_train,是有监督学习
    svc_model.fit(x_train, y_train)
    score = svc_model.score(x_test,y_test)
    y_predict = svc_model.predict(x_test)
    print("超参数C="+str(C)+"时,模型的正确率:"+str(score))
    return score
L2 = []
c = np.logspace(-5,5,11)
for i in c:
    L2.append(SVM(i))
超参数C=1e-05时,模型的正确率:0.09408033826638477
超参数C=0.0001时,模型的正确率:0.09408033826638477
超参数C=0.001时,模型的正确率:0.09408033826638477
超参数C=0.01时,模型的正确率:0.09513742071881606
超参数C=0.1时,模型的正确率:0.952431289640592
超参数C=1.0时,模型的正确率:0.985200845665962
超参数C=10.0时,模型的正确率:0.9904862579281184
超参数C=100.0时,模型的正确率:0.9904862579281184
超参数C=1000.0时,模型的正确率:0.9904862579281184
超参数C=10000.0时,模型的正确率:0.9904862579281184
超参数C=100000.0时,模型的正确率:0.9904862579281184
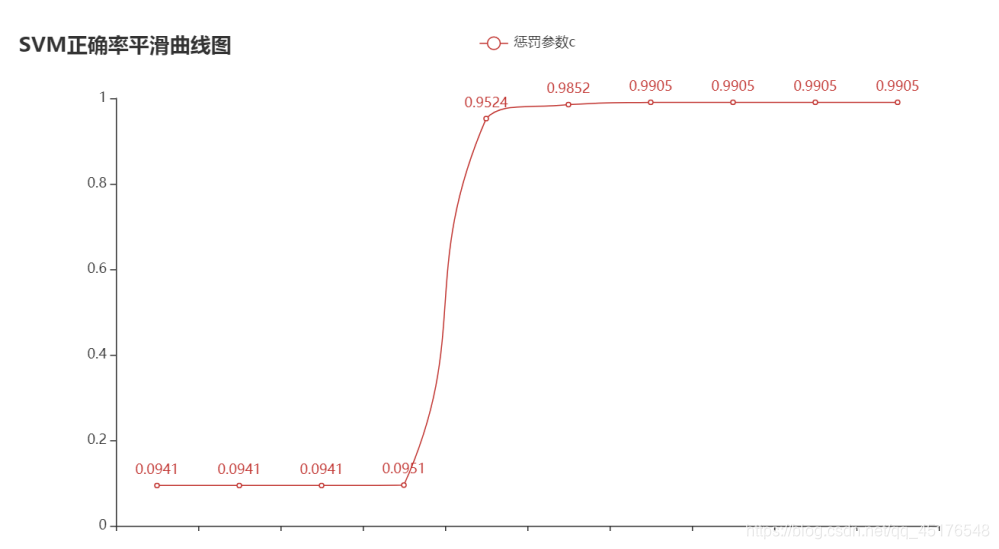
Draw graphics
Model summary
Support vector machine , there are a large number of kernel functions can be used, which can be very flexible to solve various nonlinear classification regression problems. When the sample size is not massive data, the classification accuracy is high and the generalization ability is strong.
This is the end, if it helps you, welcome to like and follow, your likes are very important to me