Founded in 2003, AnyChart is a global leader in the field of interactive data visualization. Our solutions have helped thousands of customers increase revenue, reduce operating costs, and better serve customers. Correct data visualization helps transform operational data into actionable information. Business users trust and rely on AnyChart's solutions very much. Industry leaders such as Oracle, 3M, Lockheed Martin and other companies are using our products. Our software can help organizations to gain a deeper understanding of their business, improve decision-making and improve corporate performance.
Huidu’s 17th Anniversary Celebration, with various discounts and gifts!
AnyChart|Trial Download
AnyChart is a chart control based on JavaScript (HTML5). Use AnyChart control to create cross-browser and cross-platform interactive charts and gauges. AnyChart charts are currently used by many well-known large companies and can be used in dashboards, reports, data analysis, statistics, finance and other fields.
AnyChar HTML5 charts are highly customizable and highly compatible. With pure JavaScript API, AnyChart chart built-in client data real-time update, multi-level drill down area and specific parameter update. The powerful theme engine enables you to have a unique presentation experience through a series of charts, while PDF and image output can produce book-quality printed documents.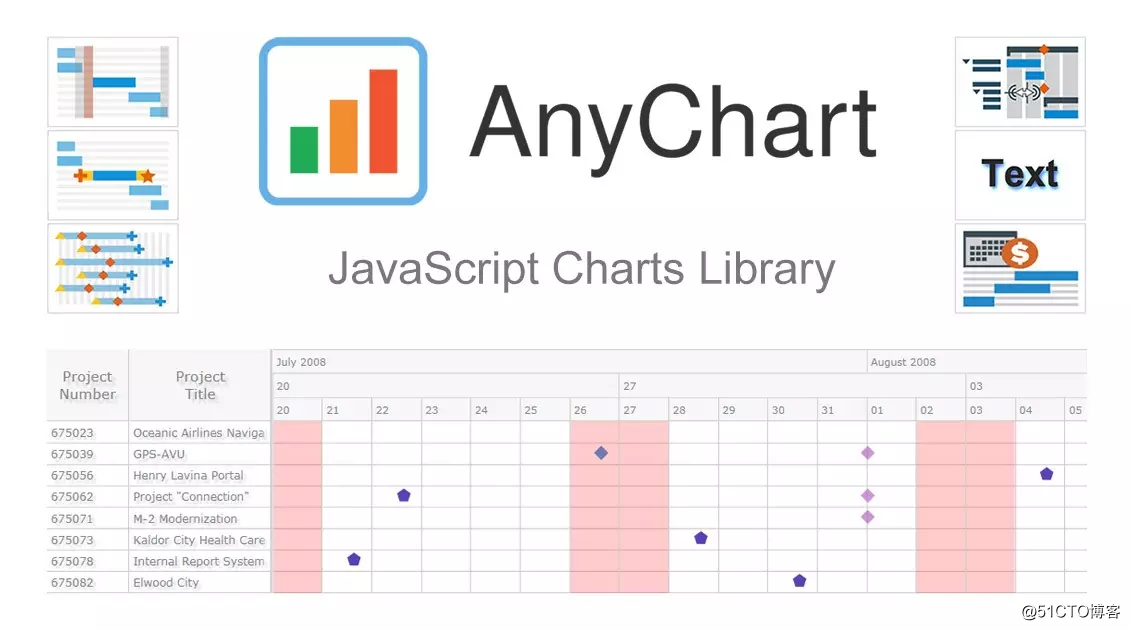
AnyGantt|Trial download
AnyGantt is a JavaScript-based advanced data visualization solution that enables everyone to use the power of animation and ultimate interactivity. It is completely cross-browser and cross-platform, and can be used for ASP.NET, ASP, PHP, JSP, ColdFusion, Ruby on Rails or simple HTML pages.
AnyGantt is an ideal tool for constructing a complex and rich Gantt chart, simple to learn and easy to use.
The AnyGantt solution allows you to choose to use a server or desktop platform to create your application. The right visualization can help you turn your data into the right decision!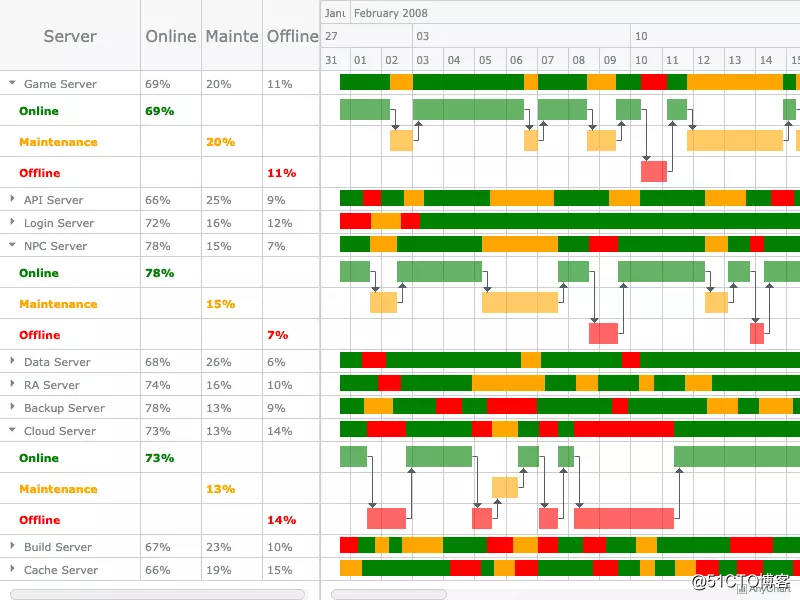
AnyMap|Trial download
AnyMap’s interactive map is a unique feature of the AnyChart component that allows you to visualize geographically related data.
AnyMap is an extension of AnyChart Flash Charts, but it can be independently authorized and used.
We can use the same swf file to render maps and charts-it allows you to freely combine maps and charts on an interactive dashboard (dashboard) and deploy them easily.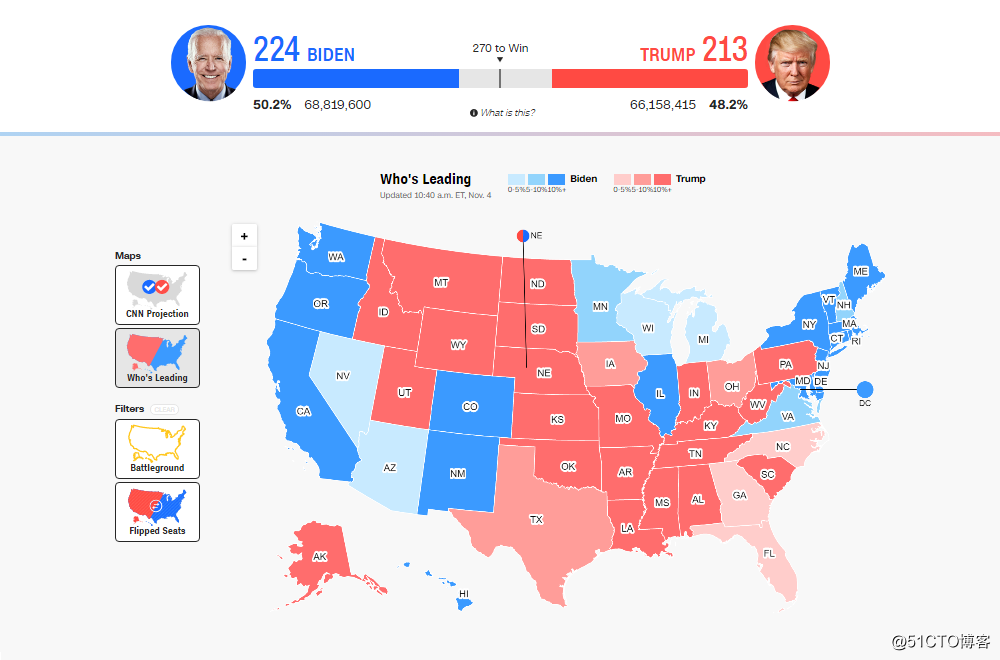
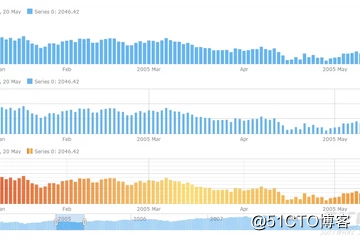
AnyStock|Trial Download
AnyStock is an XML/JSON-based Flash financial charting solution that can convert real-time data into detailed charts with interactive functions, so that your data can be visually displayed on the Web page. AnyStock can be used to display information based on data and time, and is an ideal tool for customer reporting and performance-based reporting applications. It has advanced interactivity, rich zoom, scroll and navigation options.