Although Pycharm's graphical interface is easy to use, in some scenarios, it cannot be used. And Python itself has provided us with a debugging artifact-pdb, you may not know it yet, in order to explain this artifact, I wrote this article to help you understand it easily.
1. Prepare documents
Before debugging, prepare these two files (for demonstration) and place them in the same level directory.
utils.py
def sum(mylist):
    result = 0
    for item in mylist:
        result += item
    return result
pdb_demo.py
import utils

def myfunc(mylist):
    result = utils.sum(mylist)
    print(result)


if __name__ == '__main__':
    print("----start----")
    myfunc([1,2,3,4])
    print("----end-----")
2. Enter debug mode
There are two main methods
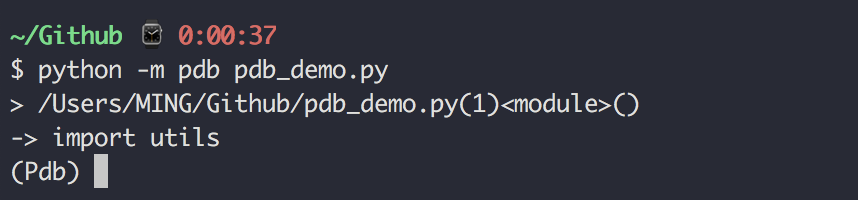
As a script call, the method is very simple, just like the normal execution of a python script, but with more-m pdb
ptyhon -m pdb pdb_demo.pyUse this method to enter the debugging mode, and single-step debugging will start on the first line of the script.
There is no problem with single-file scripts. If it is a large-scale project, there are many files in the project. Using this method can only greatly reduce our efficiency.
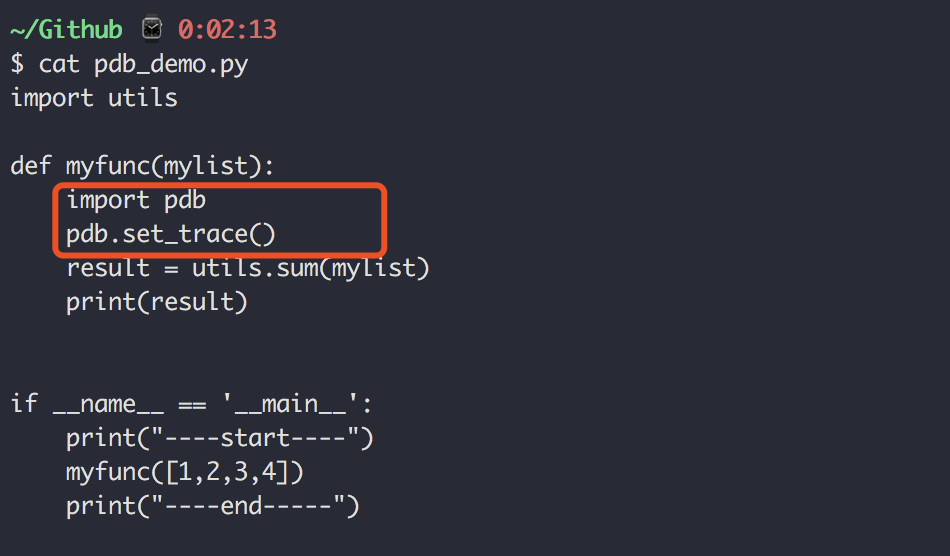
Under normal circumstances, you will hit a breakpoint directly where you need it. How to hit it?
Just add these two lines where you want to break.
import pdb
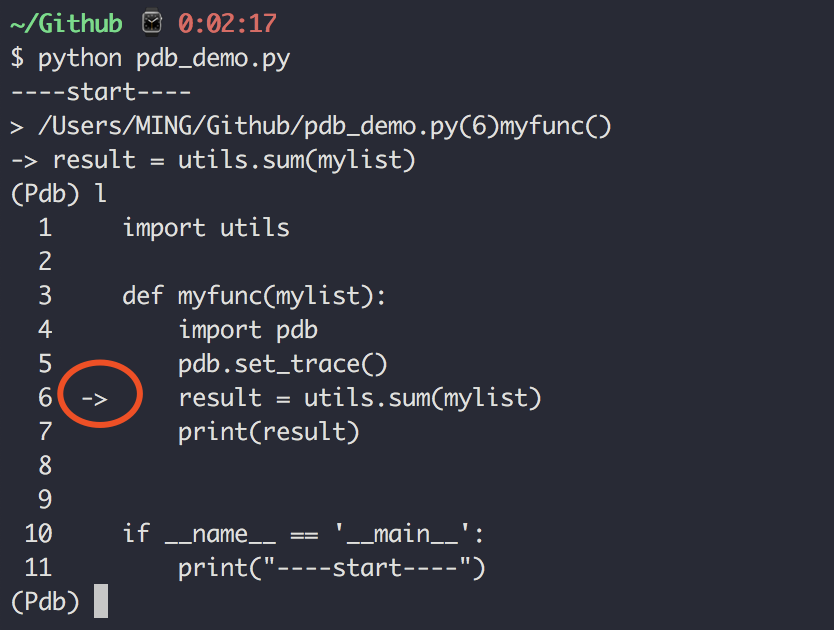
pdb.set_trace()Then when it is executed, there is no need to specify it -m pdbagain, directly python pdb_demo.py, it will directly pause at this place.
3. Debugging instructions
Those who are familiar with Pycharm know that we execute the next step, and the execution to the next breakpoint is
Similarly, pdb also requires you to remember more such commands.
When you see identifier pdb mode (Pdb)when you can enter this command.
Here I divide these commands into three levels according to the frequency of use.
Most used
| instruction | English | Explanation |
|---|---|---|
| n | Next | Next step |
| l | list | List the source code at the current breakpoint |
| p | Print variable | |
| s | step into | Execute the current line, you can enter the function |
| r | return | After running the current function, return the result |
| c | continue | Execute to the next breakpoint or end |
| b | break | Set breakpoint |
| q | quit | exit the program |
Sometimes use
| instruction | English | Explanation |
|---|---|---|
| a | args | List the parameters of the current function |
| pp | pprint | A better visualization of printing |
| j | jump | Jump to the specified line |
| cl | clear | Clear breakpoint |
| w | where | Print current stack |
| u | up | Execute jump to the upper level of the current stack |
| butter | until | Increment the number of rows (ignoring loops and functions) |
| ll | longlist | List more source code |
| run/restart | run | Restart debug (-m pdb) |
Hardly need
| instruction | English | Explanation |
|---|---|---|
| tbreak | temporary break | Temporary breakpoint |
| disable | Disable breakpoint | |
| enable | Enable breakpoint | |
| alias | Set alias | |
| unalias | Delete alias | |
| whatis | Print object type | |
| ignore | Set ignored breakpoints | |
| source | List the source code of a given object |
All of them are translated from official documents by me. The original text is here: https://docs.python.org/3/library/pdb.html
In fact, you don't have to memorize these commands by rote. When you forget, just type in helpand press Enter to see all the commands.

4. Start debugging
Here are a few of the most commonly used designations to demonstrate again.
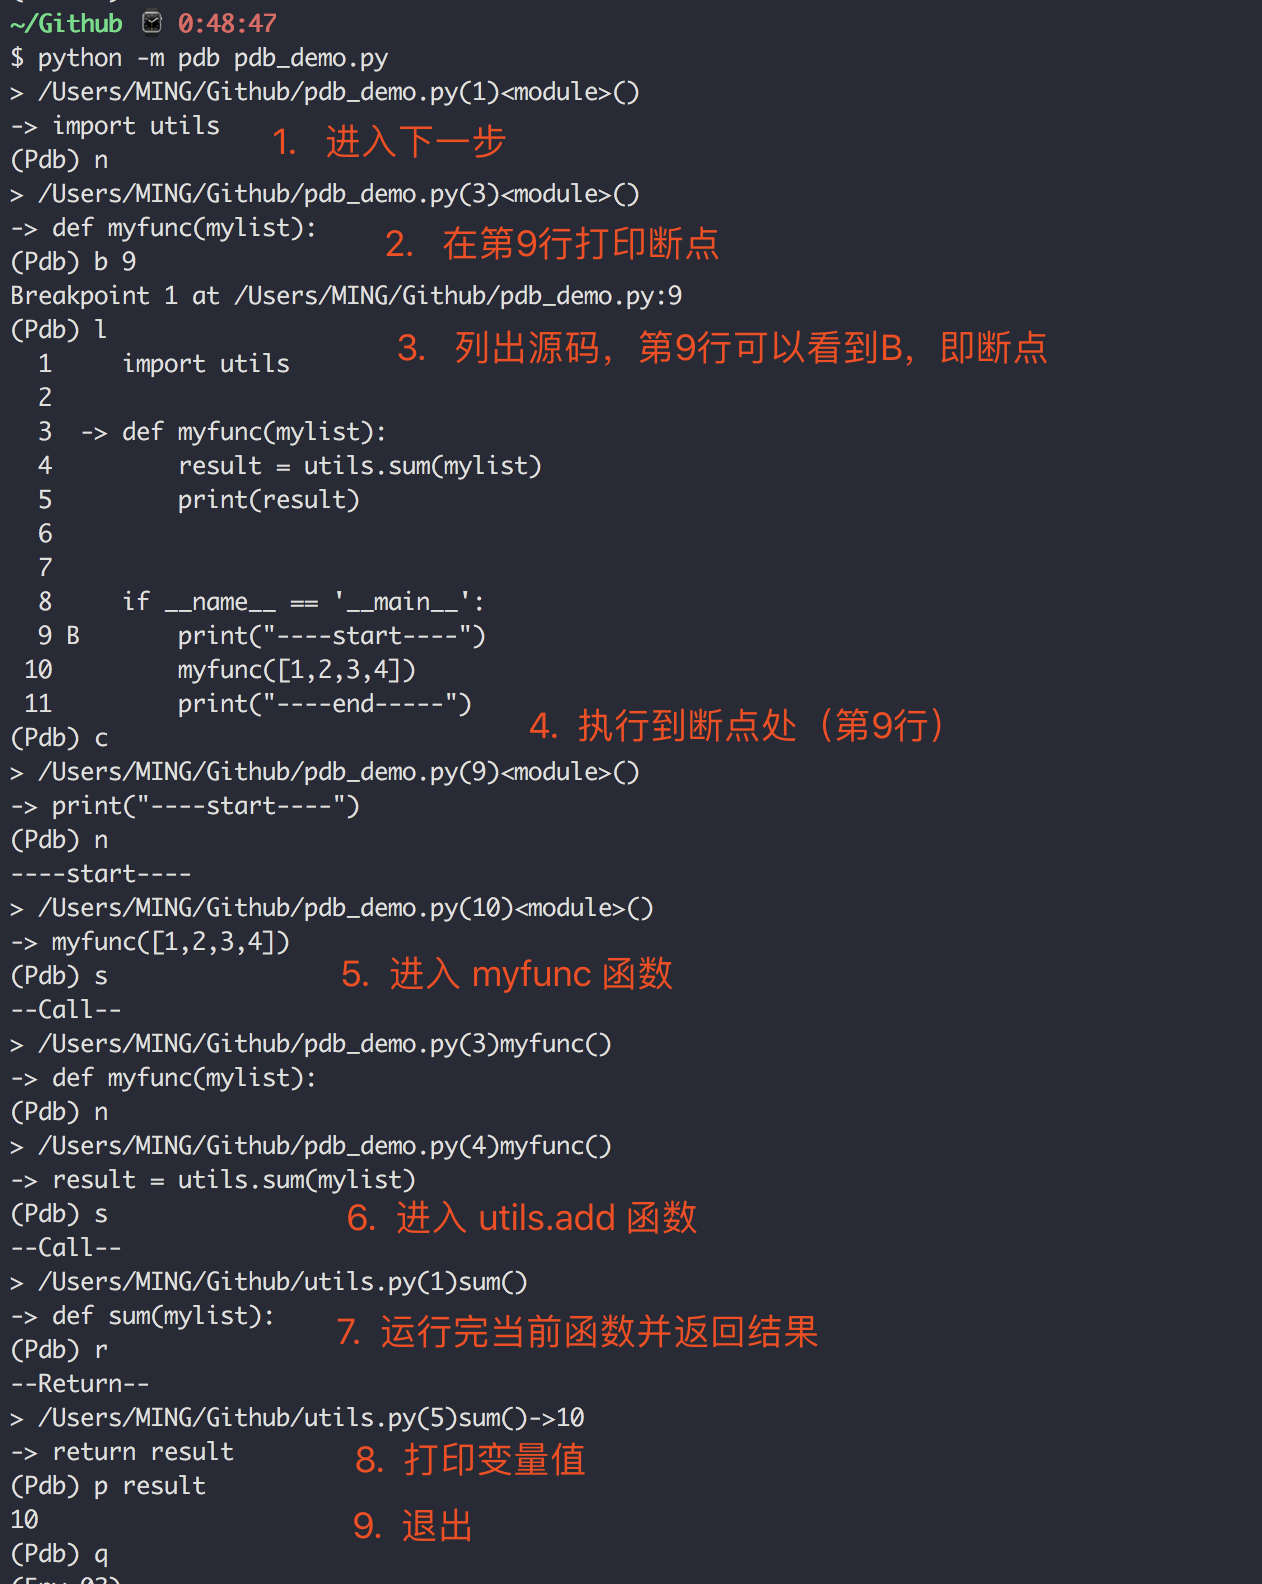
This debugging process, I added some comments, you should be able to easily understand this debugging method.
Today's pdb debugging content is probably this, have you learned it?
See the time of the screenshot above? Yes, another article written late at night. Hope it will help you.