Recently, I have been using Pico Technology's engine hydraulic system kit and flowmeter for some work. Using them in combination can help me view the engine and hydraulic system at the same time to determine whether one of them is faulty or both are faulty.
The common test to check the reliability of hydraulic pumps is called PQ test. In the PQ test, the hydraulic pump is given the maximum pressure that the system can withstand to ensure that the specified flow rate can still be generated under certain pressures. If this test is performed on a regular basis, the operating conditions of the pump can be tracked and any obvious signs of wear or performance degradation can be detected in advance.
Use Pico's 300 Lpm (L/min) and 600 Lpm flow meters to perform PQ testing. Use the loading valve function to "load" the pump and record the data instead of recording all the data on paper. In addition, once the math channel file is stored, the settings can be automatically completed for you, and you only need to connect to the computer to perform the next test. Now we see where the mathematical channel formula comes from?
What I found to be very helpful for hydraulic systems is to compare the theoretical flow with the actual flow and calculate the volumetric efficiency of the pump. How to set up the oscilloscope and which signals need to be captured will be based on the mathematical channel formula we will use. First, we need theoretical traffic, as shown below:
Theoretical flow (LPM) = pump displacement (cc / rev) * pump speed (RPM) / 1000
If you use gallons as the flow unit, the formula should be:
Theoretical flow (GPM) = pump displacement (cu ins / rev) * pump speed (RPM) / 231
Here I will use the first formula to calculate the theoretical flow, assuming the pump displacement is 51 cc/rev. What we need to pay attention to is that this theoretical calculation is based on a pump with an efficiency of 100%, but it is impossible due to internal leakage, but we can still calculate the volumetric efficiency according to the formula.
We also need to calculate the speed of the hydraulic pump . For most automotive hydraulic systems, the hydraulic pump is directly connected to the engine: the engine speed is equal to the pump speed. If we use the engine crankshaft position sensor or other signals to collect data, it is easy to get the pump speed curve. If the pump is driven externally by the engine (possibly a belt or gear), the speed can be obtained by an optical sensor, or the transmission ratio between the crankshaft and the pump can be calculated and included in the formula. I this embodiment the sub , the motor and pump directly connected, but we still need to crankshaft position sensor signal output is converted to an engine RPM.
During the test, I set the engine speed to a fixed value of 1500 RPM. For most cars, this is a suitable driving speed, and it can also be used when testing again in the future. All of this information can be added to the notes of the PicoScope software and stored in a file. In this case, if others need to test according to your method, they can follow the remarks to make the same settings.
In this case, we can choose to use the crank math channel, but because the RPM is fixed, from a diagnostic point of view, we are not very concerned about the fluctuation of the engine speed. So I will use the filtered math channel introduced in the following article : Application of math channel (9)-calculate the theoretical value of air flow .
This will make the speed curve smoother, but due to pump loading and unloading, it will still show a large engine speed change. The math channel formula is from a forum article, but I did some fine-tuning to improve the RPM waveform. Since there is a 37-tooth signal plate on the crankshaft sensor, we need to add a scale factor to ensure that our RPM is accurate. In this case, I chose a scale factor of 1.616. So the formula is as follows: RPM=1.616*LowPass(freq(A), 4)
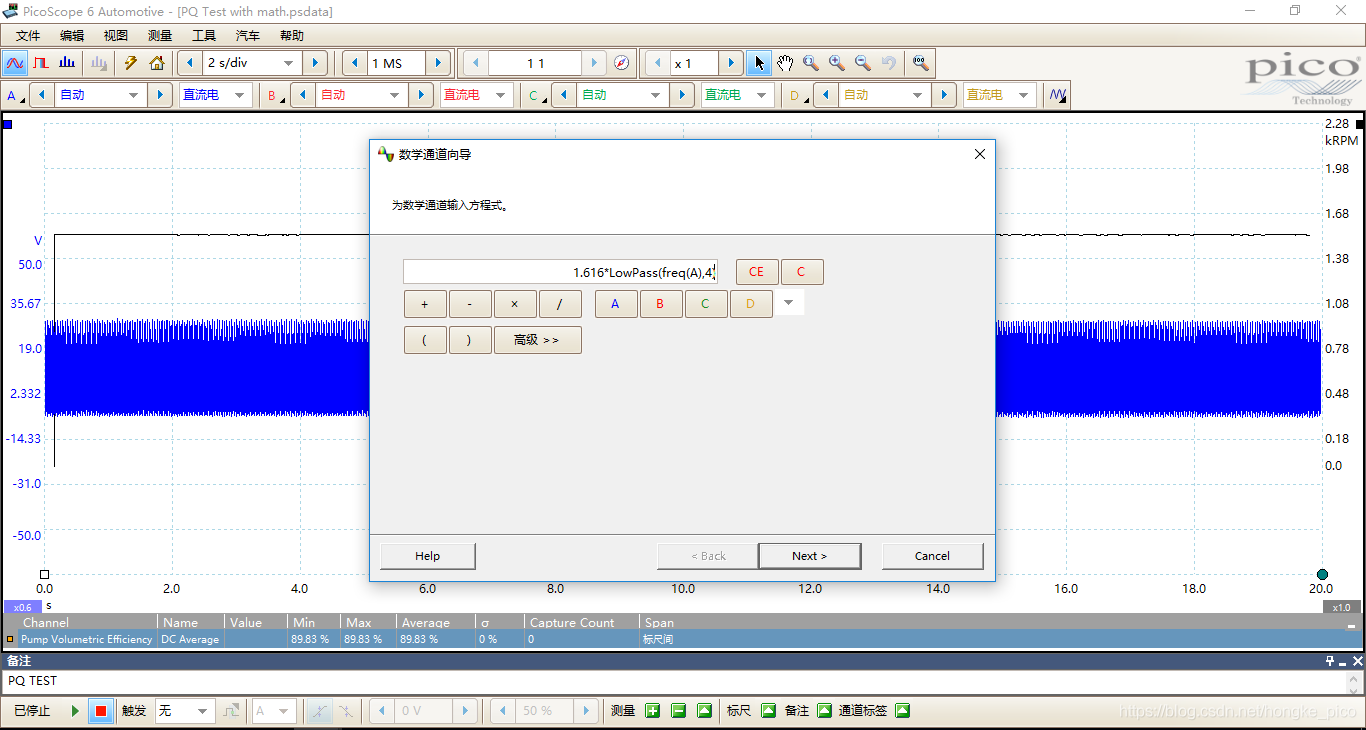
Figure 1 RPM math channel
To accurately measure RPM, the best method is an enlarged curved shaft sensor signals and time scale measured RPM.
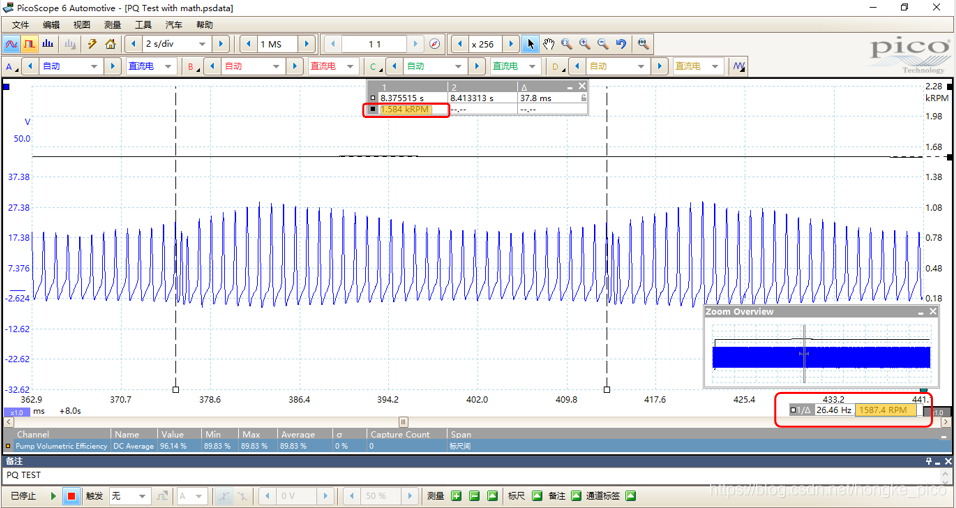
Figure 2 Crankshaft sensor signal calculation RPM
As shown in Figure 2, I used two methods to measure RPM and compared them. Fortunately, the difference between the two is very small, so the RPM math channel can be saved for future use. To calculate the theoretical flow, we need to modify it according to the RPM math channel formula, which means to create a new math channel:
Theoretical flow (LPM) = pump displacement (cc / rev) * pump speed (RPM) / 1000 = 51 * (1.616 * LowPass (freq (A), 4)) / 1000
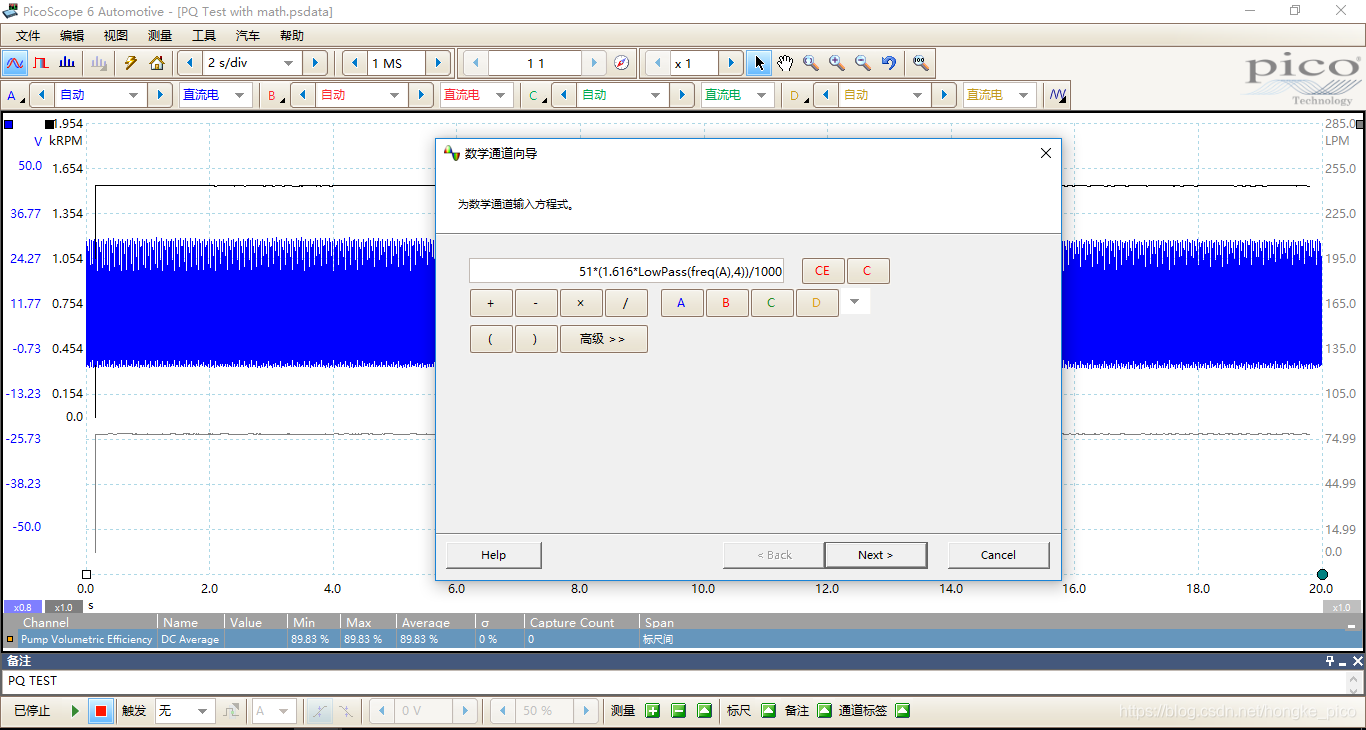
Figure 3 Mathematical channel of theoretical flow
Now, based on the pump speed and the pump displacement of 51cc/rev, we have calculated the theoretical flow. Then perform the PQ test, which needs to be connected to the hydraulic system to measure the flow and pressure. Please make sure you have received relevant training and personal protective equipment PPE, and you must also prevent any potential contamination that may occur. Therefore, we have to check the cleanliness of all hoses, accessories, WPS600C pressure sensors and flow meters.
After installing the system, make sure you know the maximum working pressure of the system. Starts loading pump after , remember to always keep in mind the pressure value . The Pico flowmeter is equipped with an explosion-proof diaphragm, which can provide you with some protection in the event of pressure peaks or leakage of the loading valve. Remember, you must first replace the bursting disc before proceeding to the next step of the test.
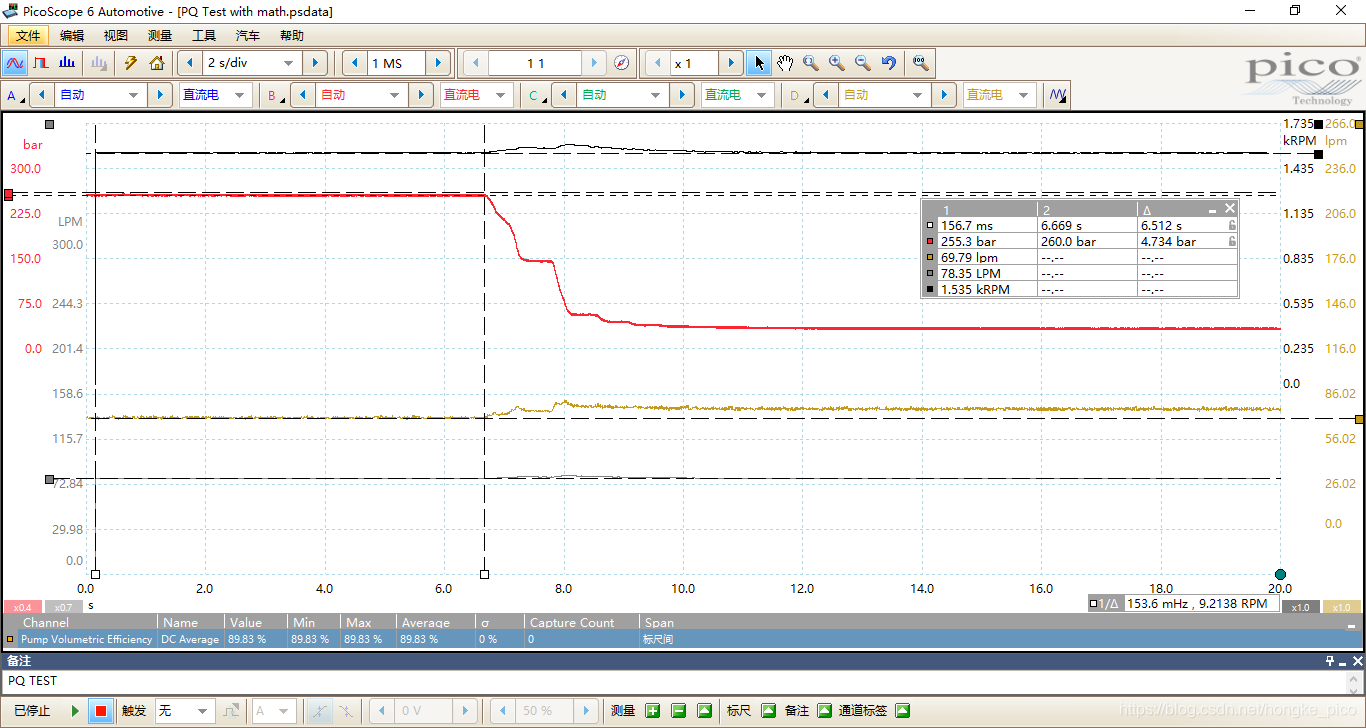
Figure 4 PQ test
Figure 4 shows a system with a maximum working pressure of 260 bar. Through the difference between the time scales, you will see that the pump pressure is 255.3 bar. Because we are not protected by the pressure relief valve, I limit the pressure to the maximum working pressure of 260bar. This can not only ensure safety, but also reflect the output power of the pump. The most important waveform data is the flow rate, because the flow rate shows the working condition of the pump. By using the ruler, we can see that the flow rate at 255.53 bar is 69.79 LPM, which is about 9 LPM away from our theoretical flow value of 78.35 LPM. So we know the pump efficiency and is not 100%, reason is that I mentioned earlier pump internal leakage.
The volumetric efficiency of the pump (%) = (actual flow / theoretical flow ) * 100 . In the above example, the volumetric efficiency of the pump = (69.79 / 78.35) * 100% = 89.07%. We can input the formula into the math channel to get the volumetric efficiency waveform. Remember, you can add any number of math channels, and they will not affect the original data. Therefore, the mathematical formula of volumetric efficiency is:
D/(51*(1.616*LowPass(freq(A),4))/1000)*100
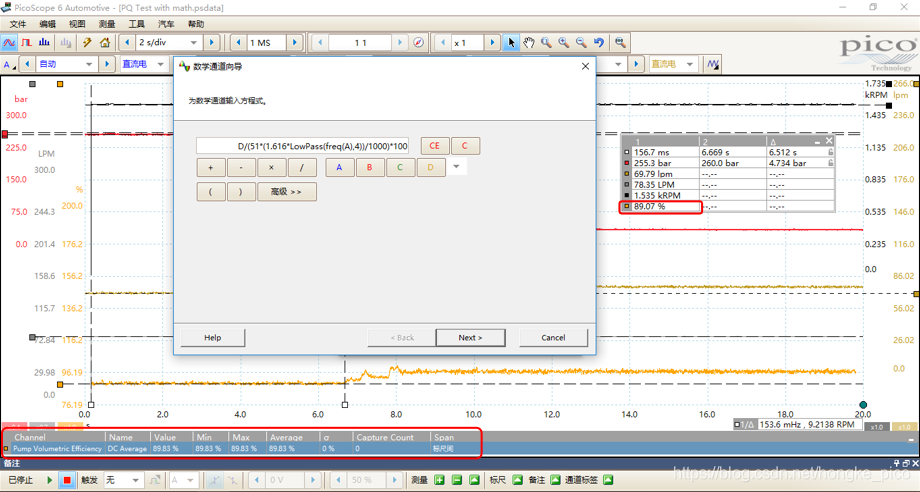
Figure 5 Volumetric efficiency mathematical channel
To make it easier to observe, I added a measurement between the time scale for loading and unloading the pump, which measures the average volumetric efficiency. I have stored the math channel in the PSDATA file . You can download it from the Hongke pico oscilloscope forum .
The application of math channels can reveal many things, and we can use them to perform more calculations. We hope that math channels can play a greater role in calculations in the future.