clear all
load count.dat
c3 = count(:,3);% The third column of data
c3NaNCount = sum(isnan(c3));
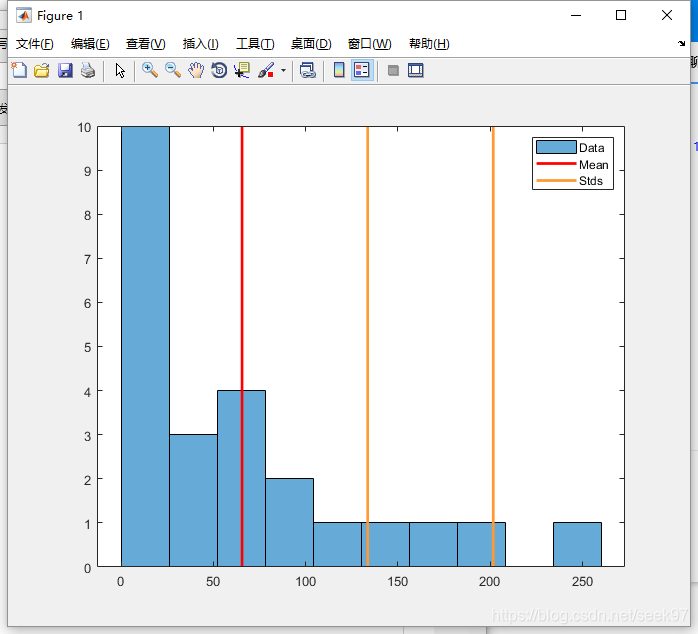
h = histogram(c3,10);% Histogram, the abscissa is the value, the ordinate
N = max(h.Values);% for the number of groups
mu3 = mean(c3); % 求平均值
sigma3 = std(c3); % 求均方差
hold on
plot([mu3 mu3],[0 N],'r','LineWidth',2) % Mean
X = repmat(mu3+(1:2)*sigma3,2,1);
Y = repmat([0;N],1,2);
plot(X,Y,'Color',[255 153 51]./255,'LineWidth',2) % Standard deviations
legend('Data','Mean','Stds')
hold off