Knowledge points: Python dynamic bar graphs, customized QR codes, and rapid deployment of static html pages.
Article Directory
Qixi Festival ( various festivals, anniversaries ) is coming again, and programmers ( how can they not be single ) want to invite their girlfriends to coax their girlfriends. Everyone must know all kinds of coded romances, such as customized QR codes. , Let your girlfriend enter a customized h5 page after scanning the code, then the content that can be placed on this page is——

Memories are the classic option. How to present memories? It is not difficult to think that you can use js to achieve various animation effects. It is good to directly copy various library combinations, but it still needs to be carefully designed and it is difficult to operate.
Here is a simple idea for you to use python to make cool dynamic bar graphs, and show your journey together!
Examples are as follows:

One, dynamic bar graph
First, let's guess how this is achieved. Animation is the continuous playback of static pictures frame by frame, so we only need to draw a picture every day and then compose it into a GIF. The bar graphs for the first and last day are as follows:

Let’s take a look at the daily data used for drawing. Assuming that January 1, 2020 is the starting date, and January 20 is the day ( that is , the date released for review ), it is necessary to draw these data 20 times (do n’t be afraid , Brother dei ).

Enter the code link: first read the data as required ( the pandas library, the favorite for meter reading, appears again ). To facilitate processing of the date, the date values excel in one of the format into a string, and then use datatimethe start date to the timestamp format.
import pandas as pd
import datetime

df = pd.read_excel("数据.xlsx")
df['日期文本'] = df['日期'].apply(lambda x: str(x)[:10])
t = datetime.datetime(2020,1,1) # 起始日期
Select matplotlib library for drawing: first set the canvas, return the model and drawing objects. Then don't forget to set the font to avoid abnormal Chinese display. Because there are 3 items that need to be colored separately, create a color list again, and you can make your own color code that Baidu likes.
import matplotlib.pyplot as plt

fig, ax = plt.subplots(figsize=(10,6)) # 画布
plt.rcParams['font.sans-serif'] = ['Microsoft YaHei'] # 字体设为微软雅黑
colors = ['#ADD8E6', '#DC143C', '#FFC0CB'] # 颜色列表
Write a drawing function: the parameter passed in is the number of days elapsed for the start date. By t + datetime.timedelta(days=date)calculating the need to draw the date specified number of days, and then use strftime("%Y-%m-%d")it to restore the text date, day and taken out by the new data into the text date df_in. The next step is, by barhdrawing bar method, and each drawing on the front FIG requires emptying a new image.
def draw(date):
    # 数据处理 ------
    current_date = (t + datetime.timedelta(days=date)).strftime("%Y-%m-%d")
    df_ = df[df['日期文本'].eq(current_date)]
    days = df_['天数']
    item = df_["项目"]
    # 绘制条形图 ------
    ax.clear() # 重绘
    # for i in range(1,len(itme.uni))
    ax.barh(item, days, color = colors)
So after the call draw(19)to draw after 19 days, which is the 20th day of the image, through plt.show()temporary look.

There is still a certain gap with the final renderings. There are more axis labels, and series labels, data labels and scrolling time in the upper right corner are missing. Continue to improve the draw function:
for y, (x,name) in enumerate(zip(days.values,item.values)): # 系列标注
        ax.text(x, y, "%s" % x, size=12)
        if x > 1:
            ax.text(x-0.5, y, name, size=14, ha = 'right')
ax.text(1, 1.01, current_date, transform = ax.transAxes, size= 20, ha='right') # 滚动时间
ax.get_xaxis().set_visible(False) # 隐藏坐标轴
ax.get_yaxis().set_visible(False)
The next step is to draw a loop for 20 Photo by plt.savefig('xxx.png')eleven saving, re-use imageio library or other tools to synthesize gif image it!
( No, no, wait a little longer ) If you really want to do this, it would be too much trouble, now it's time to sacrifice the protagonist this time!
import matplotlib.animation as ani
The matplotlib library provides a dynamic drawing module, which can help us make gifs more easily. You only need to pass in the model, drawing function, and a list of int type, so when the draw function was originally designed, the required parameter was the number of days date. intervalEach parameter is plotted in FIG time interval for plt.show()the inspection results. Gif by saving the final image fpssetting parameter frames.
timeSlot = [x for x in range(0,20)] # 时间轴
animator = ani.FuncAnimation(fig, draw, frames=timeSlot ,interval = 100)
animator.save('test.gif',fps=10)
Attach the complete code:
import matplotlib.pyplot as plt
import matplotlib.animation as ani
import pandas as pd
import datetime

df = pd.read_excel("数据.xlsx")
df['日期文本'] = df['日期'].apply(lambda x: str(x)[:10])
t = datetime.datetime(2020,1,1) # 起始日期
fig, ax = plt.subplots(figsize=(10,6)) # 画布
plt.rcParams['font.sans-serif'] = ['Microsoft YaHei'] # 字体设为微软雅黑
timeSlot = [x for x in range(0,20)] # 时间轴
colors = ['#ADD8E6', '#DC143C', '#FFC0CB'] # 颜色列表

def draw(date):
    print(date)
    # 数据处理 ------
    current_date = (t + datetime.timedelta(days=date)).strftime("%Y-%m-%d")
    df_ = df[df['日期文本'].eq(current_date)]
    days = df_['天数']
    item = df_["项目"]
    # 绘制条形图 ------
    ax.clear() # 重绘
    ax.barh(item, days, color = colors)
    for y, (x,name) in enumerate(zip(days.values,item.values)): # 系列标注
            ax.text(x, y, "%s" % x, size=12)
            if x > 1:
                ax.text(x-0.5, y, name, size=14, ha = 'right')
    ax.text(1, 1.01, current_date, transform = ax.transAxes, size= 20, ha='right') # 滚动时间
    ax.get_xaxis().set_visible(False) # 隐藏坐标轴
    ax.get_yaxis().set_visible(False)

# draw(19)
# plt.savefig('test.png')
animator = ani.FuncAnimation(fig, draw, frames=timeSlot ,interval = 100) # interval时间间隔
plt.show()
# animator.save('test.gif',fps=10)
Two, customized QR code
No explanation! ( See comments ) Directly on the code:
from MyQR import myqr # 需先安装MyQR库

def QR_myqr():
    myqr.run(
        'https://', # 二维码指向链接,或无格式文本(但不支持中文)
        version = 5, # 大小1~40
        level='H', # 纠错级别
        picture = 'img.jpg', # 底图路径
        colorized = True, # 彩色
        contrast = 1.0, # 对比度
        brightness = 1.0, # 亮度
        save_name = 'save.jpg', # 保存文件名
        save_dir = 'D:/' #保存目录
    )
Three, quickly deploy static html pages
1. Write a page
If you need to access your website through a QR code, you need to deploy it to the server first, and there are many ways to do it. For example, in a Penguin cloud, individual users have 6 months of free time. What we are going to introduce here is github ( actually because our company’s computers cannot be connected to the Internet, and Penguin Cloud can’t use github when testing, domestic mobile phone access is still faster on domestic servers, probably )
( Huh? Even if you can't access the external network but you can access github, I also...probably the restricted network segment is not covered, haha )
( Huh? Did I expose the company paddling ).
But before that, let's write the local html first!
Through the final ( not final ) renderings at the beginning, it can be found that the gif is played end to end in a loop. The images of the last day flashed past and you can’t see clearly. You can modify the incoming time series to change the last one. Draw the picture a few more times and it will have the effect of staying. In order to better show the effect, the time period of the data used in the figure below has been changed from June 1 to August 25 (Chinese Valentine's Day), 86 days have passed, and two items have been added.
timeSlot = [x for x in range(0,86)]+[85]*15

Put it directly into the html page, just a single picture seems to be missing something, then follow the rhythm of the animated picture and print the text below. First set the style of two divs, one for displaying gif and one for printing text:
<head>
<style>
		.process_gif{

       /*显示动态barh*/
            background-image:url("./process.gif");
            background-repeat: no-repeat;
            background-size: cover;
            margin:0 auto;
            width: 370px;
            height: 220px;
            position: relative;
			z-index: 1;
        }
		.show_txt{

       /*显示文字*/
            margin:0 auto;
            background-color: azure;
			width: 370px;
            height: 200px;
            position: relative;
			text-align: center;
			padding-top: 10px;
			z-index: 1;
        }
</style>
</head>
Then display them in the body:
<body>
	<div class="process_gif" id="process"></div>
	<div class="show_txt" id="content_1"></div>
</body>

Write a js script to realize the printing function, call the printing function when the page is loaded typing, and replace it with a static picture when the dynamic picture is played to the last picture:
<script type="text/javascript">
	/// 显示文字功能 ----------------------------------
	let divTyping = document.getElementById('content_1'); //通过id获取div节点
	let a = 0;
	timer = 0;
	str = "我们已经相遇 20 天<br>告白后过了 13 天<br>First Kiss 至今 5 天";
	function typing () {


		if (a <= str.length) {

      # 从第一个字开始逐个打印
	  		divTyping.innerHTML = str.slice(0, a++) + '_';
			timer = setTimeout(typing, 50); # 设置打印时间间隔
		}
		else {


			divTyping.innerHTML = str; //结束打字,移除 _ 光标
	  		clearTimeout(timer);
		}
	}

	window.onload=function(){


			typing();
			setTimeout(function(){


            	thisdiv = document.getElementById("process");
				thisdiv.style.backgroundImage = "url('./process_stop.png')"; # 将div背景图替换
      		},2000); # 单位是毫秒,根据动态图的时长来设置
	}
</script>
Let’s take a look, it’s really real. Real. The final rendering ( will move, you have to stare at it and wait a while, the timing of the screen recording is unsure ):

Note: The duration and number of frames of the animation, as well as the synchronized display of the animation in html and line-by-line printing text, you also need to adjust the code according to the actual content to achieve the best results!
Okay, I don’t want to write anymore, let’s search for the information on the part of rapid deployment...

( I hit myself with a hammer )
2. Deploy the site to github
Closer to home, more tricks in the Html page are waiting for you to play, now to the last link-put the page duang on github.
Skip the process of registering and logging in to the largest gay dating website github (how many largest gay dating... ), and create a new warehouse for storing html files and pictures.

Get a warehouse address after creation.

Ready to upload our site files.

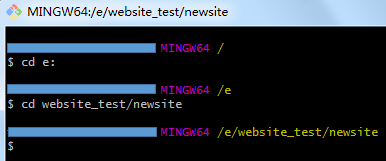
Upload files also need to install git (installation address: https://git-scm.com/downloads/), and then open git-bash.exe in the installation directory.
1. Enter the site directory (the command entered after the $ sign):
2. Generate git management in this directory:

3, enter add *add all the files in the directory, you can also specify a file name or folder, add a folder format is add dirname/:

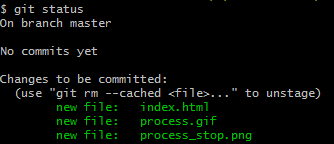
4, the input git statusto see if the required files are added into the buffer:
5, enter the version submitted comments (in quotes as footnotes):

6. Associate the local warehouse management to github (the warehouse address obtained just now):

7. Upload files:

When uploading in the last step, the github account password input box will pop up one after another. After inputting, you can wait for the upload to complete.
After finishing, I returned to github and found that several files were already lying in the warehouse, and then click Settings:

Select master branch in the Gitub Pages column:

Now, your site can be accessed through this link, drop it into the QR code and you're done! You can scan the code with your mobile phone to see the demo.


Things are often not as simple as they seem. Although we have gone through many steps, there are still two pitfalls left: gif images are slow to load on the page (resolved by tool compression image size), some browsers do not support window.onload(optimize js script) ). I won’t go into more details in this article, let’s explore it yourself ( KaKa )! In addition, you can add word clouds, dynamic character paintings, lottery turntables, etc. If you have any other interesting things you can add to the page, please provide me with more ideas!
3. Deploy the site to Penguin Cloud
Recently I found that github is a bit convulsive, and the previously deployed site is inaccessible! So I went home and moved the site to Penguin Cloud. It turned out that the domestic server has a better response experience and the operation is very simple. Let's see how to do it.
First enter the official website of Penguin Cloud, find "Object Storage" in the upper left corner of the column, and click "Use Now" after entering the page.

Then create a bucket, remember to select "Public Read and Private Write", it is completely private and cannot be accessed from outside.


Throw the relevant documents into the bucket.

Return to the bucket list, click "Configuration Management" on the right side of the bucket you just created. After opening the static website, you can browse the site by accessing the node link. Does it feel much faster than the github page haha?

Try it again! ~

thanks for reading! = v =