Article Directory
For the purpose of learning to understand this post, I am out of such a problem:
visit the website nginx released, found that access response is very slow, we should be how to troubleshoot it?
First, the general Linux system is currently analyzed from the following five aspects of performance status:
1、CPU
top
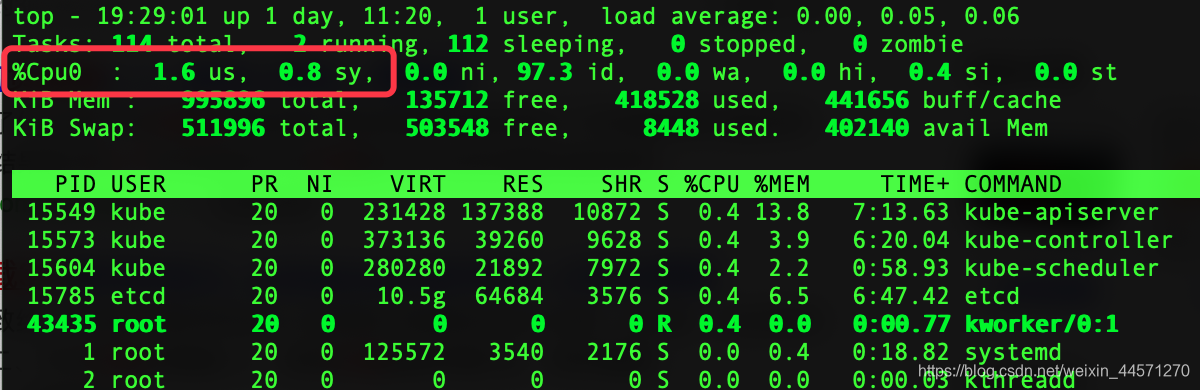 us + sy value of less than 70, indicating that the system is in a normal state, less than 80 greater than 70 is busy, the need to pay attention greater than 80.
2, memory
free -m
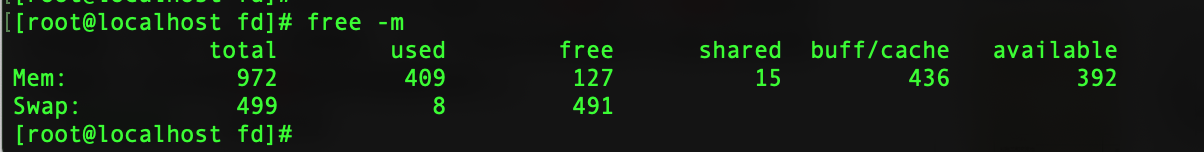 When the swap swap partition is used, indicating that the memory is insufficient!
swap swap partition is in fact a part of the disk capacity planning to act as a memory read and write performance is very low under. Of course, you can use solid-state hard drive!
3, load
yum install procps -y
uptime

top
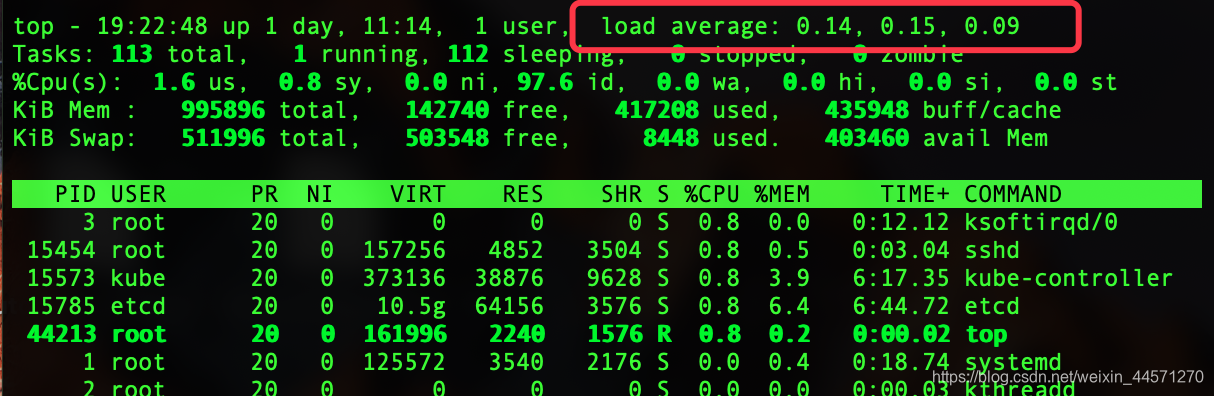 Load: three values, namely, 1 minute, 5 minutes and 15 minutes of average load
generally load size not exceeding twice the number of logical CPU can.
4, disk
df -hT
 To see if the disk is full!
5, disk IO read and write performance
yum install sysstat -y
iostat
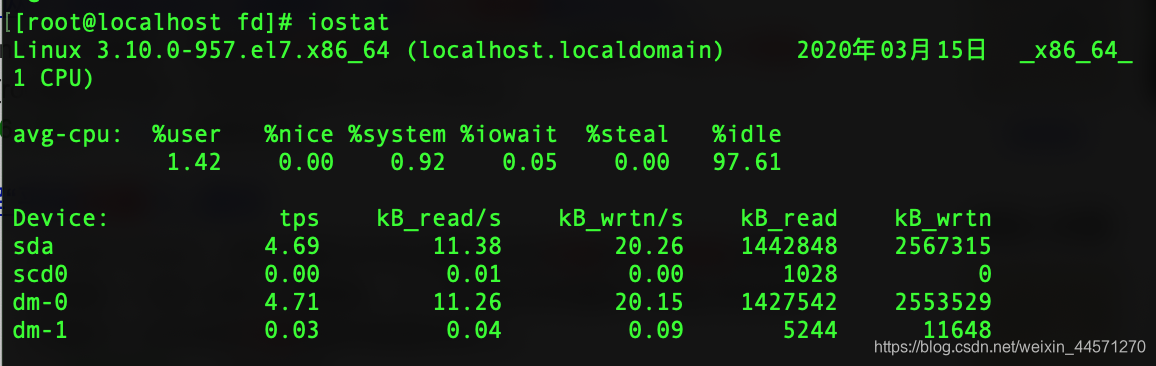
KB_read/s                表示每秒读取的数据块数;
KB_wrtn/s                表示每秒写入的数据块数;
KB_read                  表示读取的所有块数;
KB_wrtn                  表示写入的所有块数。
#同时sar命令也可以看磁盘IO读写性能
sar -d 1 10
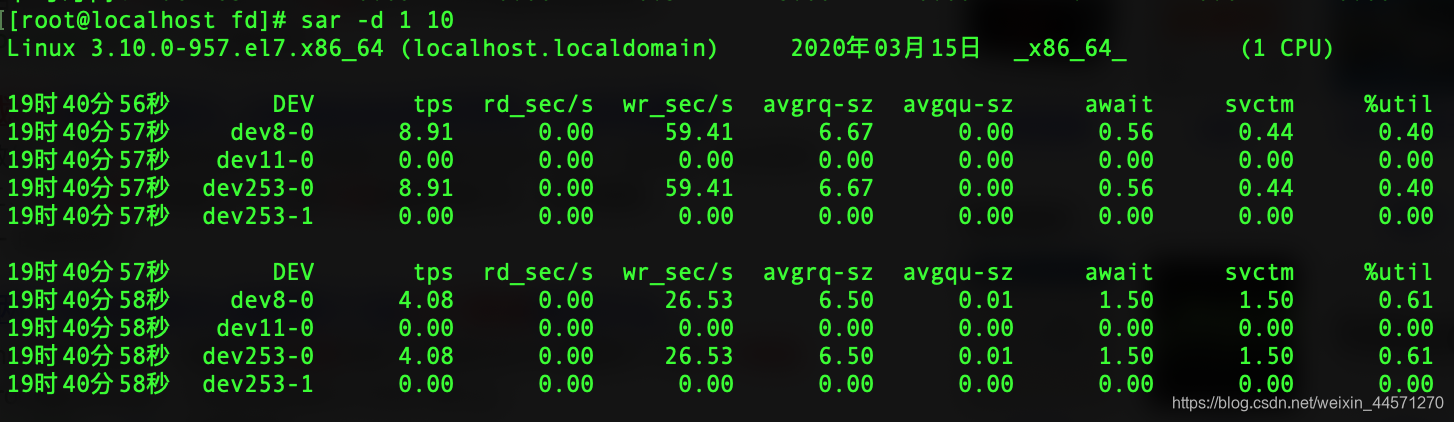
await表示平均每次设备I/O操作的等待时间(以毫秒为单位);
svctm表示平均每次设备I/O操作的服务时间(以毫秒为单位);
%util表示一秒中有百分之几的时间用于I/O操作;
% util term value is a measure of an important indicator of disk I / O's , if% util close to 100%, the resulting disk I / O request is too much, I / O system has been working at full capacity, the disk may be a bottleneck . Over time, it is bound to affect system performance by optimizing program or to resolve this problem by replacing the higher, faster disk.
6, network bandwidth
yum install epel-release -y
yum install iftop -y
iftop -i ens33
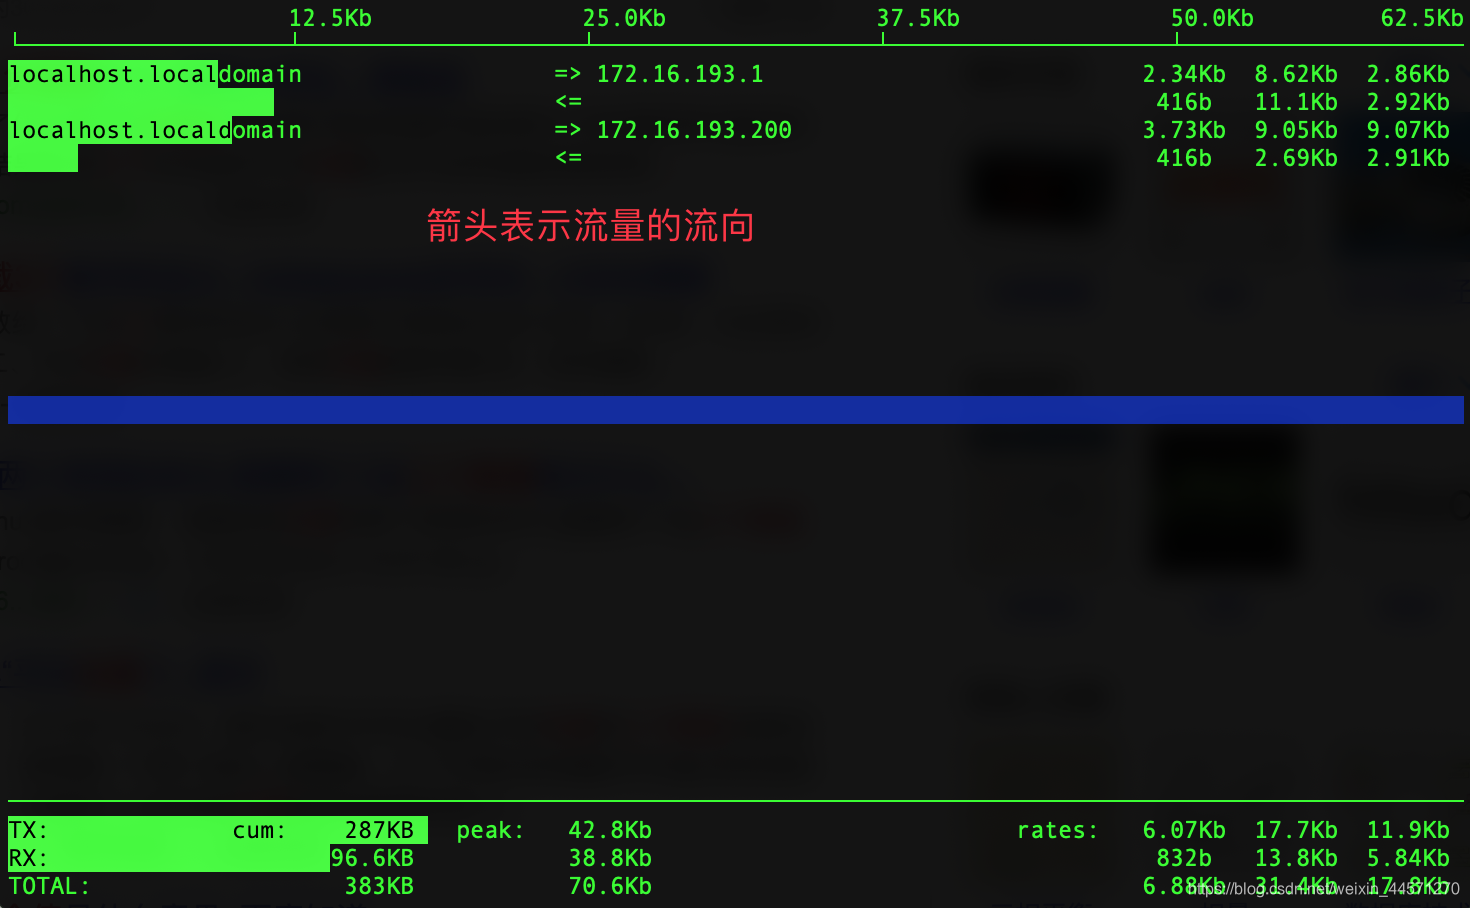
TX					发送流量;
RX					接收流量;
TOTAL				总流量;
Cumm				运行iftop到目前时间的总流量;
peak				流量峰值;
rates				分别表示过去 2s 10s 40s 的平均流量。
#ab压测看ens33接口带宽
ab -n 100000 -c 1000 http://172.16.193.201/
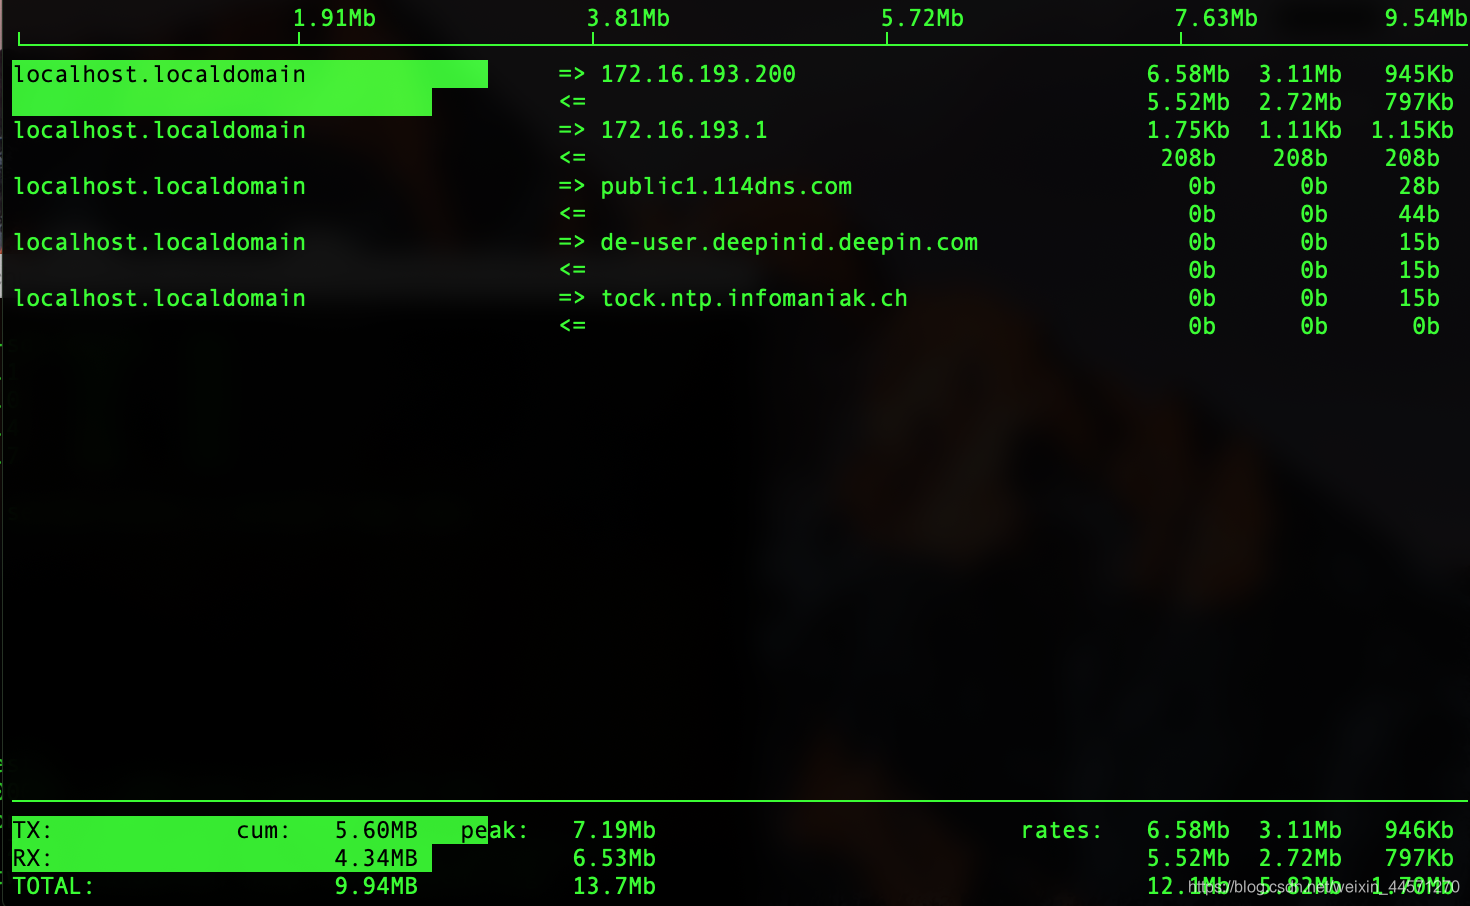 Usually we say megabytes bandwidth rate: 100 divided by 8 = 12.5Mb / s
