LandScan人口数据
LandScan计划于1997年在橡树岭国家实验室(ORNL)启动,以满足为后果评估改进人口估计的需要。例如,全球范围内的自然和人为灾害使大量的人口处于危险之中,而且往往没有什么预先警告。开发高分辨的估计值是至关重要的,这样他们就可以对多个地理范围内的事件进行评估。自1998年以来,这一直是一个年度产品。
在为LandScan Global开发的建模方法的基础上,利用美国更高质量的数据,我们在2004年的LandScan USA的第一个版本中提高了空间和时间分辨率。创建LandScan USA的目的是为了捕捉人口的昼夜变化,这对各种分析和行动(包括应急准备和响应)至关重要。2016年,最初的LandScan USA模型被重新设计,以纳入地理空间技术的进步、机器学习方法和新的输入数据源。从那时起,我们每年都对基础模型进行改进,并每年发布一个新版本的数据集。
在LandScan USA首次启动的时候,ORNL也在机器学习和计算机视觉方面进行了开拓性的工作,特别是为了识别高空图像中明显的人为信号。这项工作最终实现了从高分辨率图像中快速、大规模地检测人类住区,并成为早期开发美国以外地区改进的分辨率人口分布的努力的基础,被称为Landscan HD。LandScan HD模型采用了多模式数据融合、空间数据科学、大数据资源和卫星图像利用的混合物。第一个国家尺度的LandScan HD数据集创建于2014年,此后不断有新的国家尺度数据集被开发出来。
免责声明:数据集的全部或部分描述是由作者或其作品提供的。
论文引用:
Sims, K., Reith, A., Bright, E., McKee, J., & Rose, A. (2022). LandScan Global 2021 [Data set]. Oak Ridge National Laboratory. https://doi.org/10. 48690/1527702
Weber, E., Moehl, J., Weston, S., Rose, A., Brelsford, C., & Hauser, T. (2022). LandScan USA 2021 [Data set]. Oak Ridge National Laboratory. https:// doi.org/10.48690/1527701
GEE 中的代码连接:
Earth Engine Snippet: LANDSCAN GLOBAL
var landscan_global = ee.ImageCollection("projects/sat-io/open-datasets/ORNL/LANDSCAN_GLOBAL");
var popcount_intervals =
'<RasterSymbolizer>' +
' <ColorMap type="intervals" extended="false" >' +
'<ColorMapEntry color="#CCCCCC" quantity="0" label="No Data"/>' +
'<ColorMapEntry color="#FFFFBE" quantity="5" label="Population Count (Estimate)"/>' +
'<ColorMapEntry color="#FEFF73" quantity="25" label="Population Count (Estimate)"/>' +
'<ColorMapEntry color="#FEFF2C" quantity="50" label="Population Count (Estimate)"/>' +
'<ColorMapEntry color="#FFAA27" quantity="100" label="Population Count (Estimate)"/>' +
'<ColorMapEntry color="#FF6625" quantity="500" label="Population Count (Estimate)"/>' +
'<ColorMapEntry color="#FF0023" quantity="2500" label="Population Count (Estimate)"/>' +
'<ColorMapEntry color="#CC001A" quantity="5000" label="Population Count (Estimate)"/>' +
'<ColorMapEntry color="#730009" quantity="185000" label="Population Count (Estimate)"/>' +
'</ColorMap>' +
'</RasterSymbolizer>';
// Define a dictionary which will be used to make legend and visualize image on map
var dict = {
"names": [
"0",
"1-5",
"6-25",
"26-50",
"51-100",
"101-500",
"501-2500",
"2501-5000",
"5001-185000"
],
"colors": [
"#CCCCCC",
"#FFFFBE",
"#FEFF73",
"#FEFF2C",
"#FFAA27",
"#FF6625",
"#FF0023",
"#CC001A",
"#730009"
]};
// Create a panel to hold the legend widget
var legend = ui.Panel({
style: {
position: 'bottom-left',
padding: '8px 15px'
}
});
// Function to generate the legend
function addCategoricalLegend(panel, dict, title) {
// Create and add the legend title.
var legendTitle = ui.Label({
value: title,
style: {
fontWeight: 'bold',
fontSize: '18px',
margin: '0 0 4px 0',
padding: '0'
}
});
panel.add(legendTitle);
var loading = ui.Label('Loading legend...', {margin: '2px 0 4px 0'});
panel.add(loading);
// Creates and styles 1 row of the legend.
var makeRow = function(color, name) {
// Create the label that is actually the colored box.
var colorBox = ui.Label({
style: {
backgroundColor: color,
// Use padding to give the box height and width.
padding: '8px',
margin: '0 0 4px 0'
}
});
// Create the label filled with the description text.
var description = ui.Label({
value: name,
style: {margin: '0 0 4px 6px'}
});
return ui.Panel({
widgets: [colorBox, description],
layout: ui.Panel.Layout.Flow('horizontal')
});
};
// Get the list of palette colors and class names from the image.
var palette = dict['colors'];
var names = dict['names'];
loading.style().set('shown', false);
for (var i = 0; i < names.length; i++) {
panel.add(makeRow(palette[i], names[i]));
}
Map.add(panel);
}
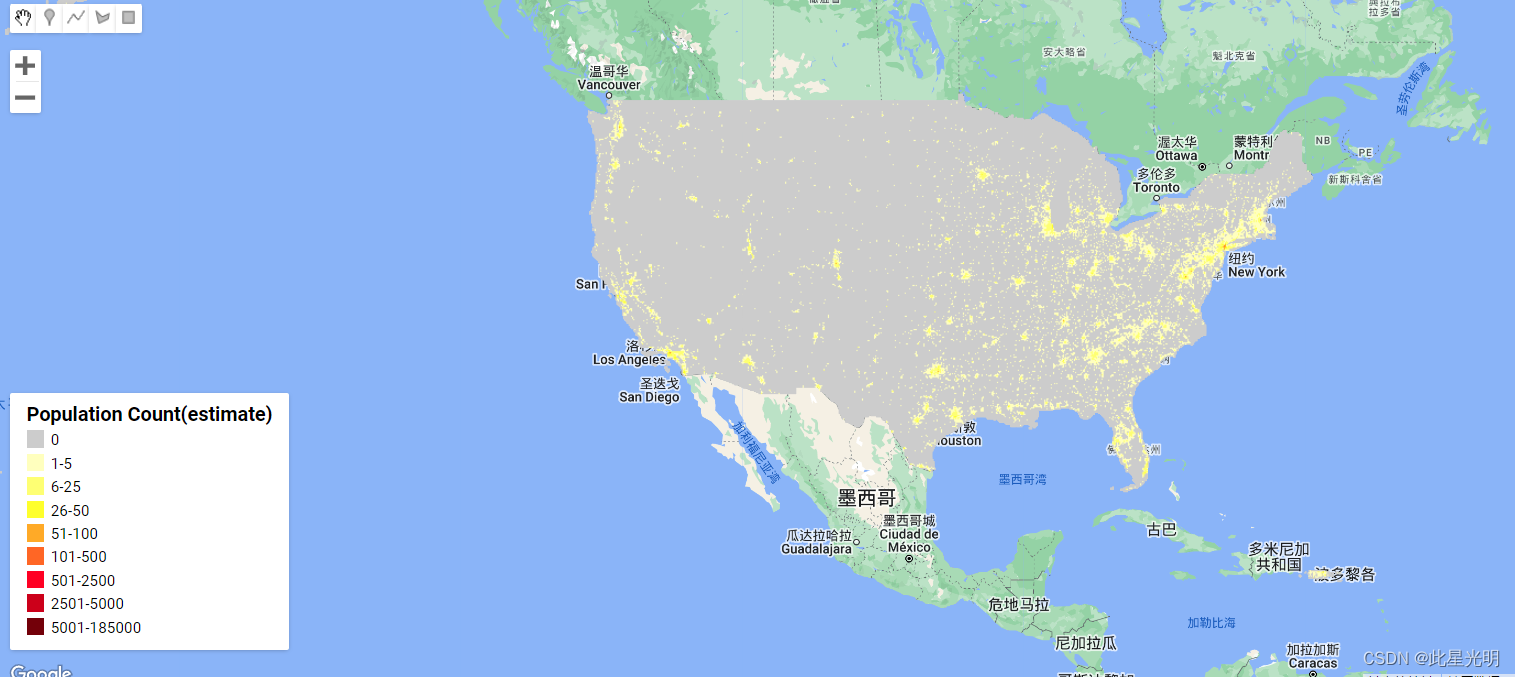
addCategoricalLegend(legend, dict, 'Population Count(estimate)');
Map.addLayer(landscan_global.sort('system:time_start').first().sldStyle(popcount_intervals), {}, 'Population Count Estimate 2000');
Map.addLayer(landscan_global.sort('system:time_start',false).first().sldStyle(popcount_intervals), {}, 'Population Count Estimate 2021');

Earth Engine Snippet: LANDSCAN USA
var landscan_usa_night = ee.ImageCollection("projects/sat-io/open-datasets/ORNL/LANDSCAN_USA_NIGHT");
var landscan_usa_day = ee.ImageCollection("projects/sat-io/open-datasets/ORNL/LANDSCAN_USA_DAY");

var popcount_intervals =
'<RasterSymbolizer>' +
' <ColorMap type="intervals" extended="false" >' +
    '<ColorMapEntry color="#CCCCCC" quantity="0" label="No Data"/>' +
    '<ColorMapEntry color="#FFFFBE" quantity="5" label="Population Count (Estimate)"/>' +
    '<ColorMapEntry color="#FEFF73" quantity="25" label="Population Count (Estimate)"/>' +
    '<ColorMapEntry color="#FEFF2C" quantity="50" label="Population Count (Estimate)"/>' +
    '<ColorMapEntry color="#FFAA27" quantity="100" label="Population Count (Estimate)"/>' +
    '<ColorMapEntry color="#FF6625" quantity="500" label="Population Count (Estimate)"/>' +
    '<ColorMapEntry color="#FF0023" quantity="2500" label="Population Count (Estimate)"/>' +
    '<ColorMapEntry color="#CC001A" quantity="5000" label="Population Count (Estimate)"/>' +
    '<ColorMapEntry color="#730009" quantity="185000" label="Population Count (Estimate)"/>' +
  '</ColorMap>' +
'</RasterSymbolizer>';

// Define a dictionary which will be used to make legend and visualize image on map
var dict = {
  "names": [
    "0",
    "1-5",
    "6-25",
    "26-50",
    "51-100",
    "101-500",
    "501-2500",
    "2501-5000",
    "5001-185000"
  ],
  "colors": [
    "#CCCCCC",
    "#FFFFBE",
    "#FEFF73",
    "#FEFF2C",
    "#FFAA27",
    "#FF6625",
    "#FF0023",
    "#CC001A",
    "#730009"
  ]};

  // Create a panel to hold the legend widget
var legend = ui.Panel({
  style: {
    position: 'bottom-left',
    padding: '8px 15px'
  }
});

// Function to generate the legend
function addCategoricalLegend(panel, dict, title) {

  // Create and add the legend title.
  var legendTitle = ui.Label({
    value: title,
    style: {
      fontWeight: 'bold',
      fontSize: '18px',
      margin: '0 0 4px 0',
      padding: '0'
    }
  });
  panel.add(legendTitle);

  var loading = ui.Label('Loading legend...', {margin: '2px 0 4px 0'});
  panel.add(loading);

  // Creates and styles 1 row of the legend.
  var makeRow = function(color, name) {
    // Create the label that is actually the colored box.
    var colorBox = ui.Label({
      style: {
        backgroundColor: color,
        // Use padding to give the box height and width.
        padding: '8px',
        margin: '0 0 4px 0'
      }
    });

    // Create the label filled with the description text.
    var description = ui.Label({
      value: name,
      style: {margin: '0 0 4px 6px'}
    });

    return ui.Panel({
      widgets: [colorBox, description],
      layout: ui.Panel.Layout.Flow('horizontal')
    });
  };

  // Get the list of palette colors and class names from the image.
  var palette = dict['colors'];
  var names = dict['names'];
  loading.style().set('shown', false);

  for (var i = 0; i < names.length; i++) {
    panel.add(makeRow(palette[i], names[i]));
  }

  Map.add(panel);
}

addCategoricalLegend(legend, dict, 'Population Count(estimate)');

//Cast to Int 16 & mask no data value
function cast(image){
  var img = image.toInt16()
  return img.mask(img.neq(-32768)).copyProperties(image)

}

//Datasets need explicit casting owing to difference in data type from source
landscan_usa_night= landscan_usa_night.map(cast)
landscan_usa_day= landscan_usa_day.map(cast)

Map.addLayer(ee.Image(landscan_usa_night.filterDate('2016-01-01','2016-12-31').median()).sldStyle(popcount_intervals),{},'LANDSCAN USA NIGHT 2016',false)
Map.addLayer(ee.Image(landscan_usa_night.filterDate('2021-01-01','2021-12-31').median()).sldStyle(popcount_intervals),{},'LANDSCAN USA NIGHT 2021',false)

Map.addLayer(ee.Image(landscan_usa_day.filterDate('2016-01-01','2016-12-31').median()).sldStyle(popcount_intervals),{},'LANDSCAN USA DAY 2016',false)
Map.addLayer(ee.Image(landscan_usa_day.filterDate('2021-01-01','2021-12-31').median()).sldStyle(popcount_intervals),{},'LANDSCAN USA DAY 2021',false)
Earth Engine Snippet: LANDSCAN HD
var landscan_hd = ee.ImageCollection("projects/sat-io/open-datasets/ORNL/LANDSCAN_HD");
var popcount_intervals =
'<RasterSymbolizer>' +
' <ColorMap type="intervals" extended="false" >' +
    '<ColorMapEntry color="#CCCCCC" quantity="0" label="No Data"/>' +
    '<ColorMapEntry color="#FFFFBE" quantity="5" label="Population Count (Estimate)"/>' +
    '<ColorMapEntry color="#FEFF73" quantity="25" label="Population Count (Estimate)"/>' +
    '<ColorMapEntry color="#FEFF2C" quantity="50" label="Population Count (Estimate)"/>' +
    '<ColorMapEntry color="#FFAA27" quantity="100" label="Population Count (Estimate)"/>' +
    '<ColorMapEntry color="#FF6625" quantity="500" label="Population Count (Estimate)"/>' +
    '<ColorMapEntry color="#FF0023" quantity="2500" label="Population Count (Estimate)"/>' +
    '<ColorMapEntry color="#CC001A" quantity="5000" label="Population Count (Estimate)"/>' +
    '<ColorMapEntry color="#730009" quantity="185000" label="Population Count (Estimate)"/>' +
  '</ColorMap>' +
'</RasterSymbolizer>';

// Define a dictionary which will be used to make legend and visualize image on map
var dict = {
  "names": [
    "0",
    "1-5",
    "6-25",
    "26-50",
    "51-100",
    "101-500",
    "501-2500",
    "2501-5000",
    "5001-185000"
  ],
  "colors": [
    "#CCCCCC",
    "#FFFFBE",
    "#FEFF73",
    "#FEFF2C",
    "#FFAA27",
    "#FF6625",
    "#FF0023",
    "#CC001A",
    "#730009"
  ]};

  // Create a panel to hold the legend widget
var legend = ui.Panel({
  style: {
    position: 'bottom-left',
    padding: '8px 15px'
  }
});

// Function to generate the legend
function addCategoricalLegend(panel, dict, title) {

  // Create and add the legend title.
  var legendTitle = ui.Label({
    value: title,
    style: {
      fontWeight: 'bold',
      fontSize: '18px',
      margin: '0 0 4px 0',
      padding: '0'
    }
  });
  panel.add(legendTitle);

  var loading = ui.Label('Loading legend...', {margin: '2px 0 4px 0'});
  panel.add(loading);

  // Creates and styles 1 row of the legend.
  var makeRow = function(color, name) {
    // Create the label that is actually the colored box.
    var colorBox = ui.Label({
      style: {
        backgroundColor: color,
        // Use padding to give the box height and width.
        padding: '8px',
        margin: '0 0 4px 0'
      }
    });

    // Create the label filled with the description text.
    var description = ui.Label({
      value: name,
      style: {margin: '0 0 4px 6px'}
    });

    return ui.Panel({
      widgets: [colorBox, description],
      layout: ui.Panel.Layout.Flow('horizontal')
    });
  };

  // Get the list of palette colors and class names from the image.
  var palette = dict['colors'];
  var names = dict['names'];
  loading.style().set('shown', false);

  for (var i = 0; i < names.length; i++) {
    panel.add(makeRow(palette[i], names[i]));
  }

  Map.add(panel);
}

addCategoricalLegend(legend, dict, 'Population Count(estimate)');


print(landscan_hd.aggregate_array('country'))
Map.addLayer(landscan_hd.mosaic().sldStyle(popcount_intervals), {}, 'Population Count Estimate LANDSCAN HD');
License
These datasets are offered under the Creative Commons Attribution 4.0 International License. Users are free to use, copy, distribute, transmit, and adapt the data for commercial and non-commercial purposes, without restriction, as long as clear attribution of the source is provided.
Created by: Oakridge National Laboratory
Curated in GEE by : Samapriya Roy
keywords: Global Population, Population count, Diurnal population, remote sensing, machine learning