python+opencv
实现图像马赛克效果。
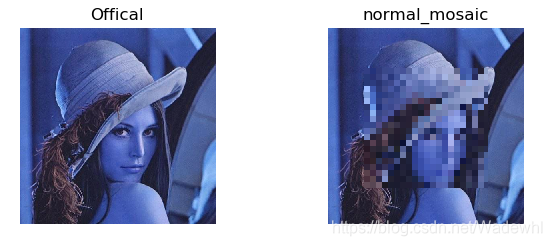
一.常规马赛克
常规马赛克的方法为,指定图像中的某个区域,在该区域的每个像素点的邻域内进行模糊。
import cv2
import numpy as np
import matplotlib.pyplot as plt


# 常规马赛克
def do_mosaic(img, x, y, w, h, neighbor=9):
    """
    :param rgb_img
    :param int x :  马赛克左顶点
    :param int y:  马赛克左顶点
    :param int w:  马赛克宽
    :param int h:  马赛克高
    :param int neighbor:  马赛克每一块的宽
    """
    for i in range(0, h, neighbor):
        for j in range(0, w, neighbor):
            rect = [j + x, i + y]
            color = img[i + y][j + x].tolist()  # 关键点1 tolist
            left_up = (rect[0], rect[1])
            x2 = rect[0] + neighbor - 1  # 关键点2 减去一个像素
            y2 = rect[1] + neighbor - 1
            if x2 > x + w:
                x2 = x + w
            if y2 > y + h:
                y2 = y + h
            right_down = (x2, y2)
            cv2.rectangle(img, left_up, right_down, color, -1)  # 替换为为一个颜值值

    return img


if __name__ == "__main__":

    img = cv2.imread('Lena.jpg')

    plt.subplot(2, 2, 1)
    plt.imshow(img)
    plt.axis('off')
    plt.title('Offical')

    face_location = [90, 100, 400, 400]
    x = face_location[0]
    y = face_location[1]
    w = face_location[2] - face_location[0]
    h = face_location[3] - face_location[1]
    img_mosaic = do_mosaic(img, x, y, w, h, neighbor=15)

    plt.subplot(2, 2, 2)
    plt.imshow(img_mosaic)
    plt.axis('off')
    plt.title('gaussian_mosaic')

    plt.show()
结果展示:
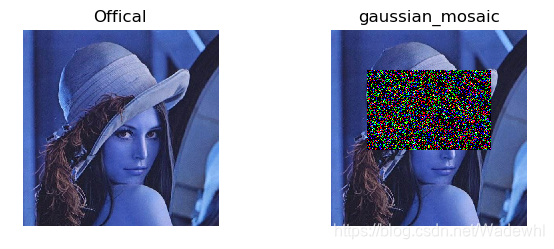
二.高斯马赛克
使用高斯随机噪声,改变指定区域内的像素值。
# 高斯马赛克

import cv2
import numpy as np
import matplotlib.pyplot as plt


def gaussian_mosaic(img, x1, y1, x2, y2):
    img[y1:y2, x1:x2, 0] = np.random.normal(size=(y2 - y1, x2 - x1))
    img[y1:y2, x1:x2, 1] = np.random.normal(size=(y2 - y1, x2 - x1))
    img[y1:y2, x1:x2, 2] = np.random.normal(size=(y2 - y1, x2 - x1))

    return img


if __name__ == "__main__":

    face_location = [90, 100, 400, 300]
    img = cv2.imread('Lena.jpg')

    h, w = (img.shape[0], img.shape[1])
    print(h, w)

    plt.subplot(2, 2, 1)
    plt.imshow(img)
    plt.axis('off')
    plt.title('Offical')

    x1 = face_location[0]
    y1 = face_location[1]
    x2 = face_location[2]
    y2 = face_location[3]
    img_mosaic = gaussian_mosaic(img, x1, y1, x2, y2)

    plt.subplot(2, 2, 2)
    plt.imshow(img_mosaic)
    plt.axis('off')
    plt.title('gaussian_mosaic')

    plt.show()
结果展示: