Wenn Sie den Befehl dstat in einem Container ausführen, wird die Ressourcennutzung innerhalb des Containers angezeigt, nicht auf dem Host. dstat ist ein Tool zum Sammeln und Berichten von Statistiken zu Systemressourcen, einschließlich CPU-, Speicher-, Festplatten- und Netzwerknutzung usw. Wenn Sie den Befehl dstat in einem Container ausführen, wird die Ressourcennutzung in diesem Container erfasst und angezeigt, nicht auf dem Hostcomputer. Dies hilft Ihnen, Ereignisse und Ressourcennutzung im Container zu überwachen und zu diagnostizieren.
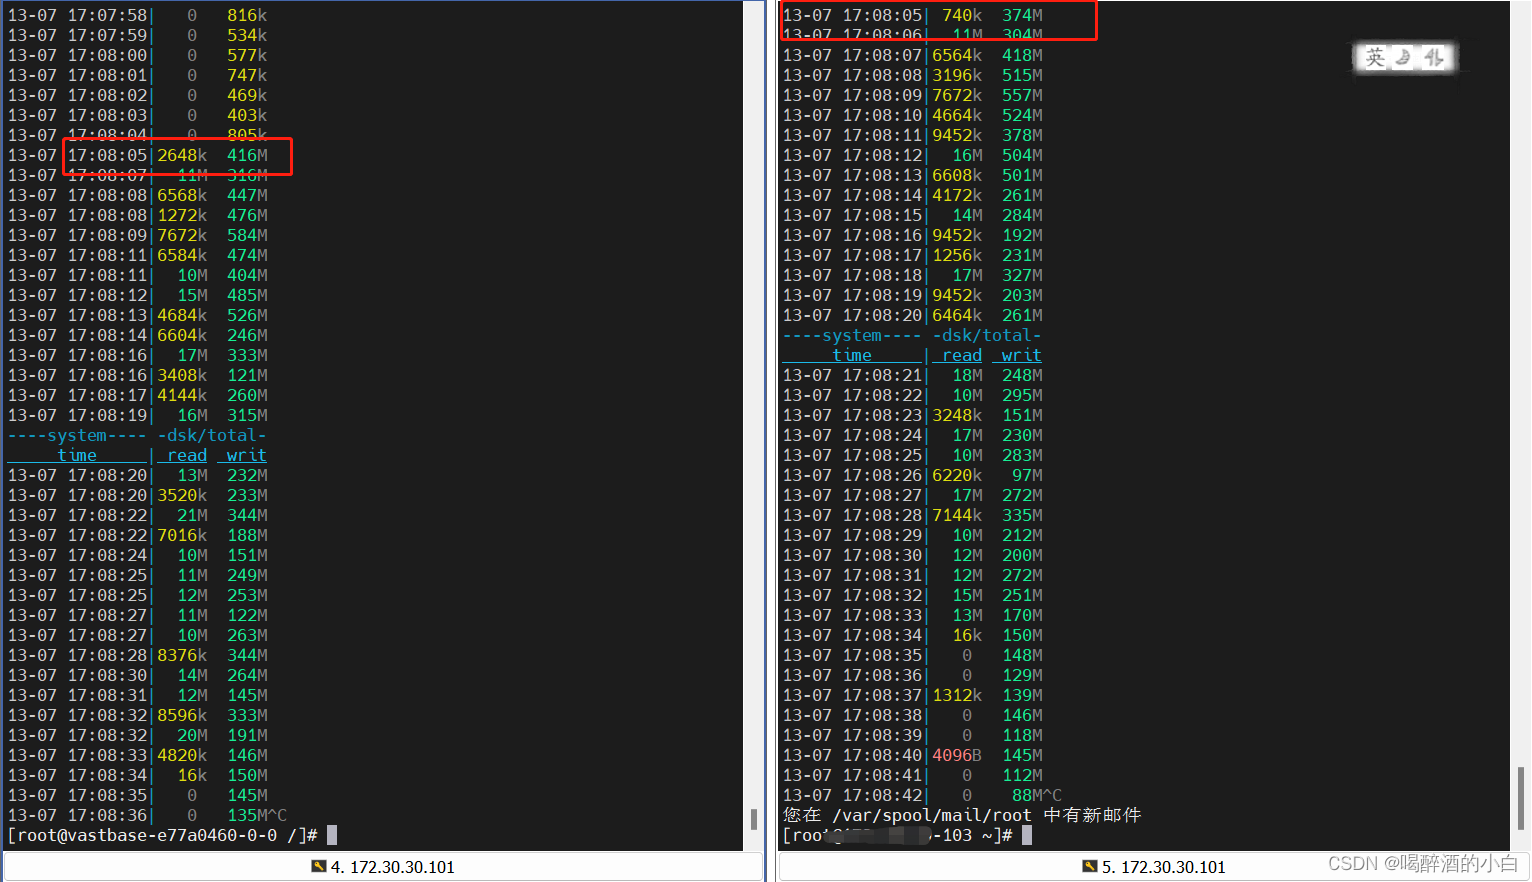
dstat -t -d
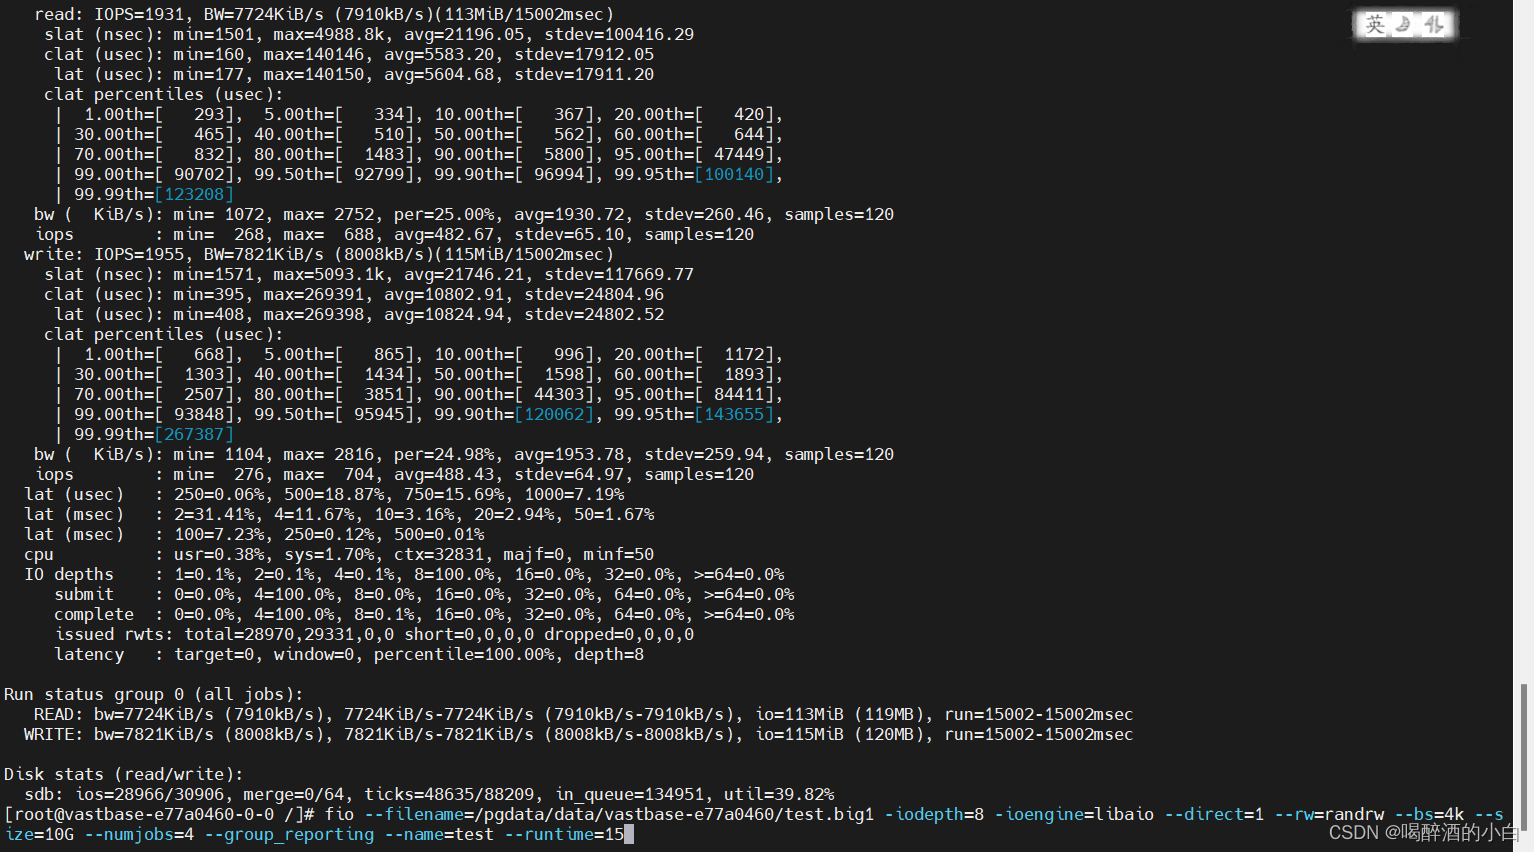
fio --filename=/pgdata/data/vastbase-e77a0460/test.big1 -iodepth=8 -ioengine=libaio --direct=1 --rw=randrw --bs=4k --size=10G --numjobs=4 --group_reporting --name=test --runtime=15
dstat -h
Usage: dstat [-afv] [options..] [delay [count]]
Versatile tool for generating system resource statistics

Dstat options:
  -c, --cpu              enable cpu stats
     -C 0,3,total           include cpu0, cpu3 and total
  -d, --disk             enable disk stats
     -D total,hda           include hda and total
  -g, --page             enable page stats
  -i, --int              enable interrupt stats
     -I 5,eth2              include int5 and interrupt used by eth2
  -l, --load             enable load stats
  -m, --mem              enable memory stats
  -n, --net              enable network stats
     -N eth1,total          include eth1 and total
  -p, --proc             enable process stats
  -r, --io               enable io stats (I/O requests completed)
  -s, --swap             enable swap stats
     -S swap1,total         include swap1 and total
  -t, --time             enable time/date output
  -T, --epoch            enable time counter (seconds since epoch)
  -y, --sys              enable system stats

  --aio                  enable aio stats
  --fs, --filesystem     enable fs stats
  --ipc                  enable ipc stats
  --lock                 enable lock stats
  --raw                  enable raw stats
  --socket               enable socket stats
  --tcp                  enable tcp stats
  --udp                  enable udp stats
  --unix                 enable unix stats
  --vm                   enable vm stats

  --plugin-name          enable plugins by plugin name (see manual)
  --list                 list all available plugins

  -a, --all              equals -cdngy (default)
  -f, --full             automatically expand -C, -D, -I, -N and -S lists
  -v, --vmstat           equals -pmgdsc -D total

  --bits                 force bits for values expressed in bytes
  --float                force float values on screen
  --integer              force integer values on screen

  --bw, --blackonwhite   change colors for white background terminal
  --nocolor              disable colors (implies --noupdate)
  --noheaders            disable repetitive headers
  --noupdate             disable intermediate updates
  --output file          write CSV output to file
  --profile              show profiling statistics when exiting dstat

delay is the delay in seconds between each update (default: 1)
count is the number of updates to display before exiting (default: unlimited)