foreword
- This article mainly introduces how to generate Dump files, including two ways, through code generation and through registry generation. It also introduces the download and use of the WinDbg tool, and how to use the WinDbg tool to statically analyze the Dump file, so as to find the crash location of the program.
Generate Dump file
-
Generated by calling WinAPI SetUnhandledExceptionFilter
- Interface Description
-
  LPTOP_LEVEL_EXCEPTION_FILTER SetUnhandledExceptionFilter(
  	[in] LPTOP_LEVEL_EXCEPTION_FILTER lpTopLevelExceptionFilter
  );
-
- parameter
- [in] lpTopLevelExceptionFilter
- Pointer to the top-level exception filter function that will be called whenever the UnhandledExceptionFilter function gets control and the process will not be debugged. A NULL value for this parameter specifies default handling in UnhandledExceptionFilter.
- The syntax of the filter function is similar to that of UnhandledExceptionFilter: it takes a single parameter of type LPEXCEPTION_POINTERS, has the WINAPI calling convention, and returns a value of type LONG. The filter function should return one of the following values.
-
Value meaning EXCEPTION_EXECUTE_HANDLER 0x1 Returns from UnhandledExceptionFilter and executes the associated exception handler. This usually results in the process terminating EXCEPTION_CONTINUE_EXECUTION 0xffffffff Return from UnhandledExceptionFilter and continue execution from the point of exception. Note that a filter function is free to modify the continuation state by modifying the exception information provided through its LPEXCEPTION_POINTERS parameter. EXCEPTION_CONTINUE_SEARCH 0x0 Continues with normal execution of the UnhandledExceptionFilter. This means honoring the SetErrorMode flag, or invoking an application error popup message box.
- return value
- The SetUnhandledExceptionFilter function returns the address of the last exception filter established using the function. A NULL return value indicates that there is no current top-level exception handler.
- annotation
- Issuing SetUnhandledExceptionFilter replaces the existing top-level exception filter for all existing threads and all future threads in the calling process.
- The exception handler specified by lpTopLevelExceptionFilter executes in the context of the thread that caused the error. This may affect the exception handler's ability to recover from certain exceptions such as an invalid stack.
- reference
- test code
-
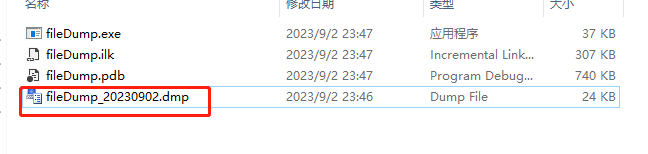
#include <windows.h> #include <stdio.h> #include <DbgHelp.h> #pragma comment(lib, "dbghelp.lib") long __stdcall callback(_EXCEPTION_POINTERS* excp) { //创建dump文件 HANDLE hDumpFile = CreateFile(L"fileDump_20230902.dmp", GENERIC_WRITE, 0, NULL, CREATE_ALWAYS, FILE_ATTRIBUTE_NORMAL, NULL); MINIDUMP_EXCEPTION_INFORMATION dumpinfo; dumpinfo.ExceptionPointers = excp; dumpinfo.ThreadId = GetCurrentThreadId(); dumpinfo.ClientPointers = true; //写入dump文件 MiniDumpWriteDump(GetCurrentProcess(), GetCurrentProcessId(), hDumpFile, MiniDumpNormal, &dumpinfo, NULL, NULL); CloseHandle(hDumpFile); return EXCEPTION_CONTINUE_SEARCH; } void myfunc() { printf("join to myfunc...\n"); //这里程序会崩溃 char* p = NULL; memcpy(p, "hello word", strlen("hello word")); printf("end myfunc"); } void myMath(int a, int b) { int sum = 0; sum = a + b; printf("sum = %d\n", sum); myfunc(); int minus = 0; minus = a - b; printf("sum = %d\n", sum); } int main() { // 捕获异常 SetUnhandledExceptionFilter(callback); myMath(10, 20); system("pause"); return 0; } - Execute the program directly, and a corresponding dump file will be generated in the directory you specify. I created a fileDump_20230902.dmp file in the current directory. You can see that it is automatically generated after the program is executed.
- Interface Description
-
Generated by registry
-
In addition to generating dump files through code, we can also directly modify the registry to generate dump files.
-
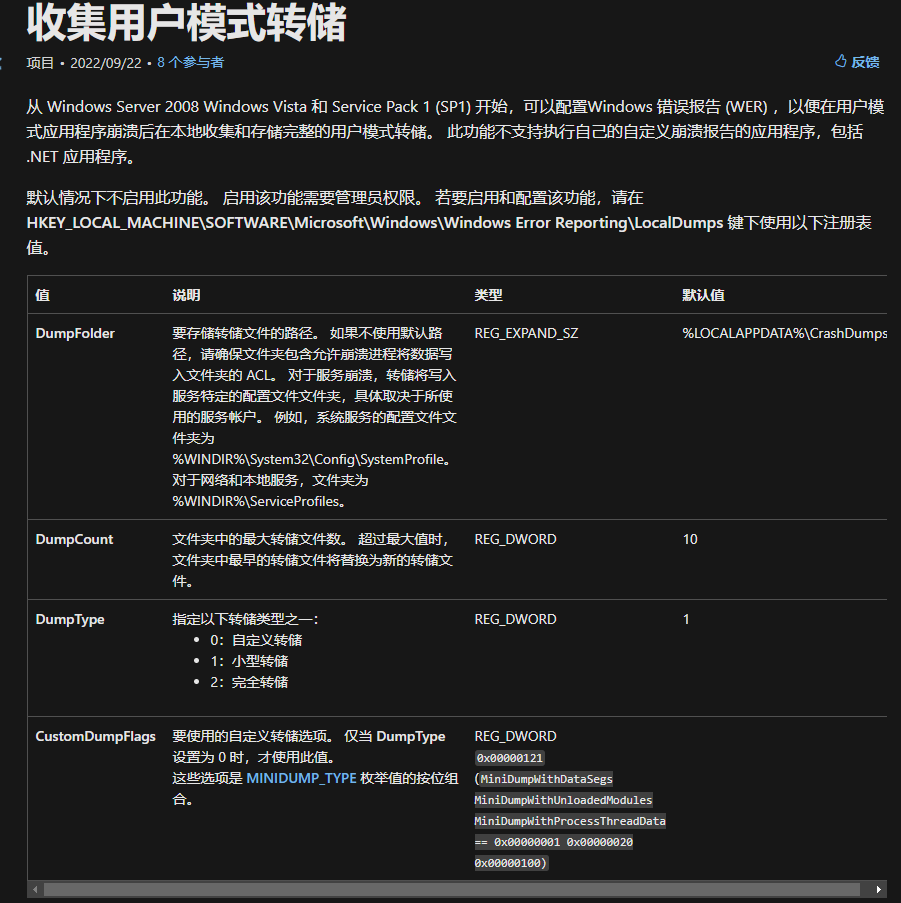
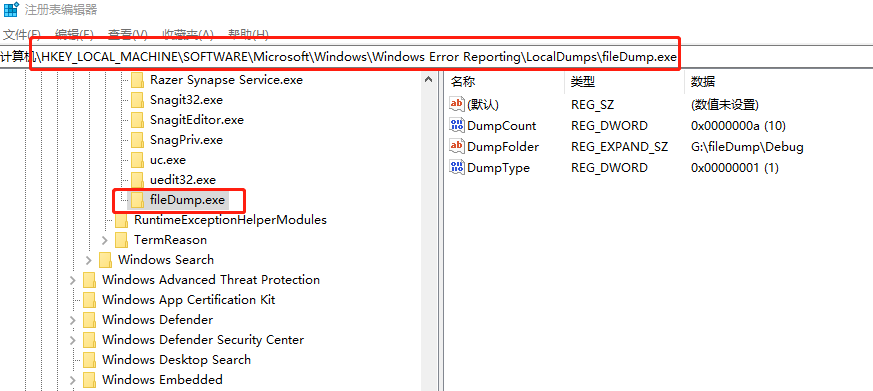
in the registry at the following locationHKEY_LOCAL_MACHINE\SOFTWARE\Microsoft\Windows\Windows Error Reporting\LocalDumps, creating an itemDumpFile.exe, the item name should be consistent with the name of your executable program. Then create three values in the corresponding item, the type and description of the value refer to the figure below. Then execute the above procedure, it will be inDumpFolderGenerate a dump file in the directory specified by the value.
-
You can refer to what I wrote. After the execution program crashes, the corresponding dump file will be generated in the directory specified by DumpFolder here.
-
test code
-
#include <windows.h> #include <stdio.h> void myfunc(){ printf("join to myfunc...\n"); //这里程序会崩溃 char* p = NULL; memcpy(p, "hello word", strlen("hello word")); printf("end myfunc"); } void myMath(int a, int b){ int sum = 0; sum = a + b; printf("sum = %d\n", sum); myfunc(); int minus = 0; minus = a - b; printf("sum = %d\n", sum); } int main(){ myMath(10, 20); system("pause"); return 0; } -
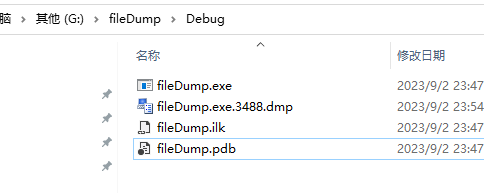
Execute the program, you can see that a dump file is also generated in the specified directory
-
WinDbg download and installation
- download link
- clickdownload the installerDownload, after the download is complete is awinsdksetup.exeInstallation package. Double click to install.
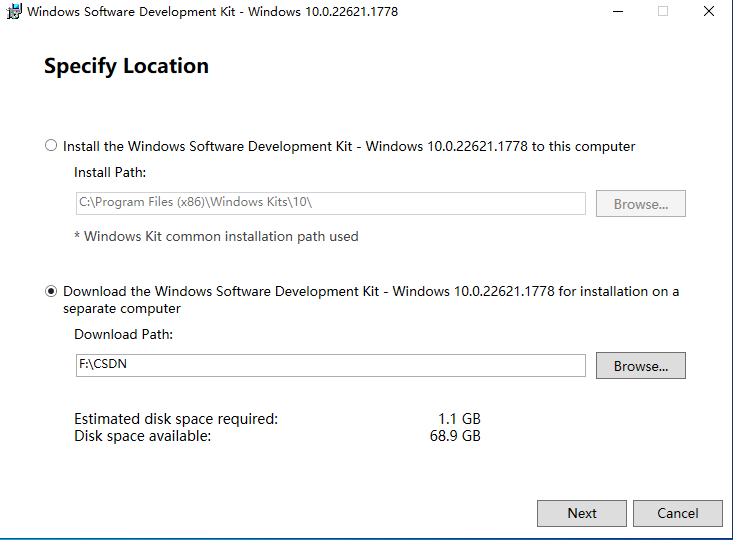
- The above is online installation, select below, first download the WinDbg installation package to the local.
- In this interface, just select Debugging Tools for Windows.
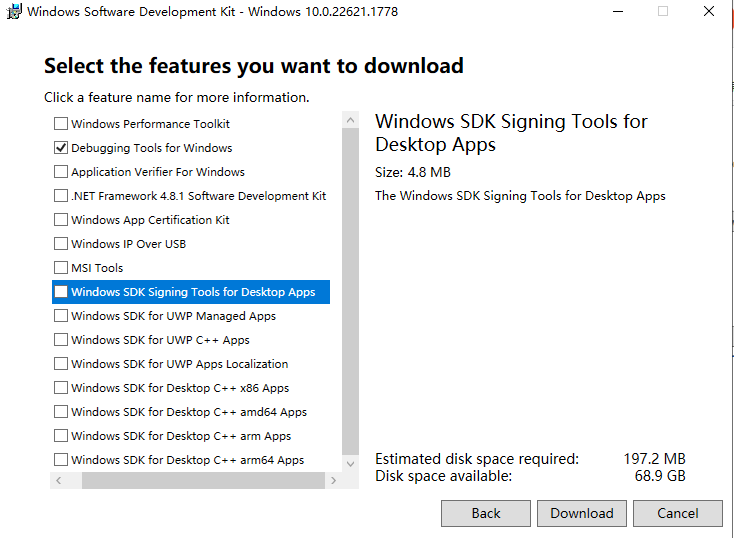
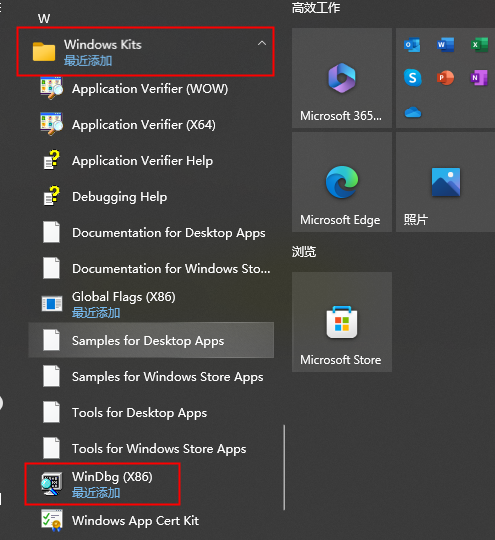
- After the download is complete, there will be aInstallersdirectory, you can choose the 32-bit installation package to installX86 Debuggers And Tools-x86_en-us.msi。
- There is no installation wizard for this installation package, just double-click it to install it. In the windows start menu bar, find Windows Kits, there is installed WinDbg below
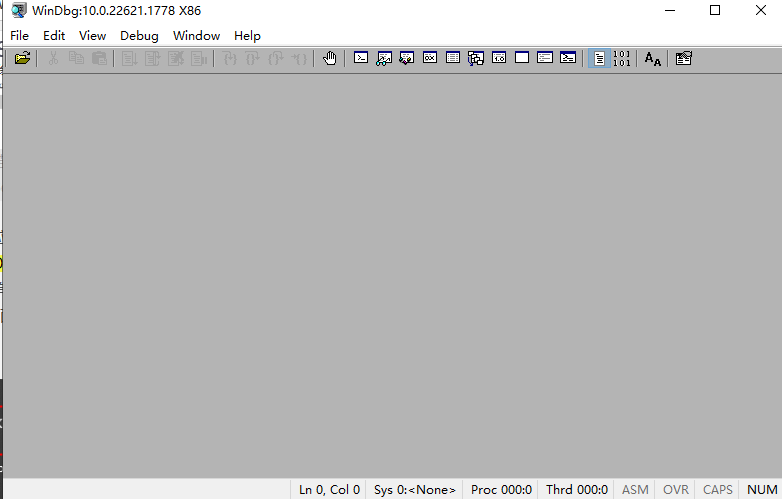
- After double-clicking to open, it is this interface. The installation is complete.
WinDbg static analysis dump
- We open winDbg, upload the dump file directly, and then we can analyze it.
- Analyzing exception types
- First of all, you can first analyze what kind of abnormality, there are mainly the following three
- Access violation: memory access violation
- Integer divided by zero: divide by 0 exception
- Stack overflow: thread stack overflow
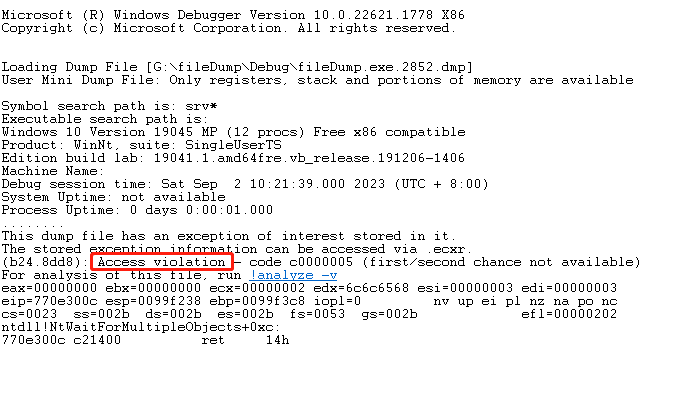
- Just put the dump file in, and you can see the exception type, which is a memory access violation
- First of all, you can first analyze what kind of abnormality, there are mainly the following three
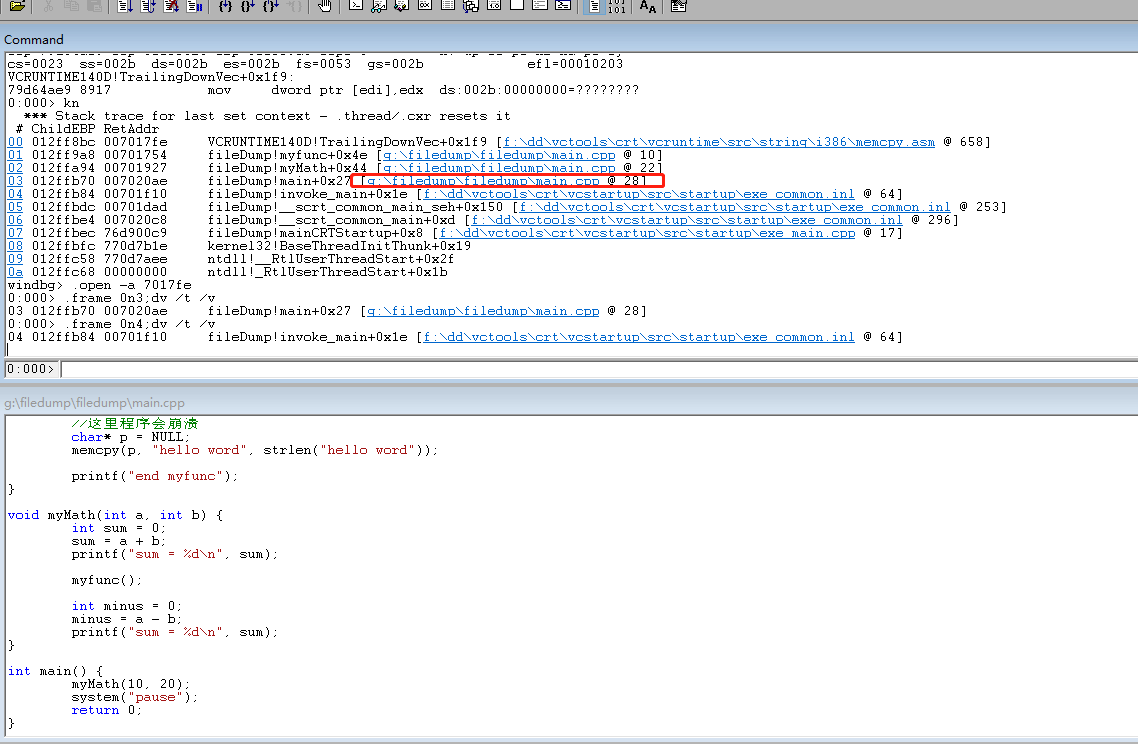
- Use the .ecxr command to view exceptions
- In the command box below, enter the .ecxr command, you can switch to the thread where the exception occurred, and you can view the abnormal assembly instruction.
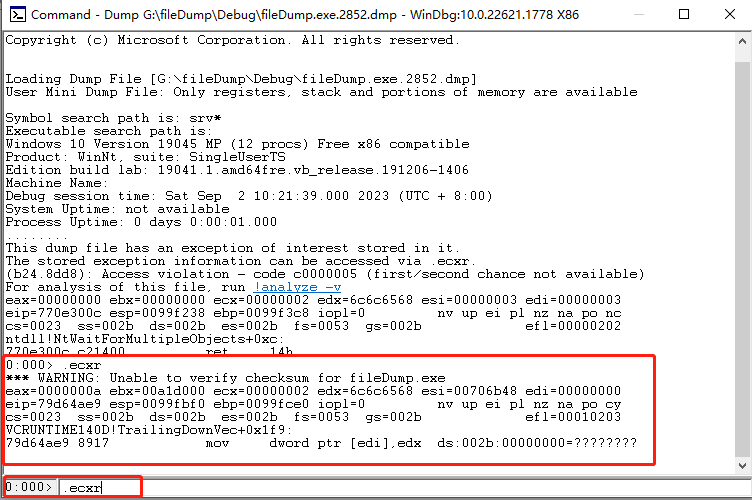
- The analysis here requires some knowledge of assembly. It can probably be analyzed that MOV means transfer. Point the pointer to a register EDI. The address of the register is 000000. This address is not allowed to be accessed by users, so the program will crash. It doesn't matter if you don't understand assembly, you can skip this step and continue to analyze.
- In the command box below, enter the .ecxr command, you can switch to the thread where the exception occurred, and you can view the abnormal assembly instruction.
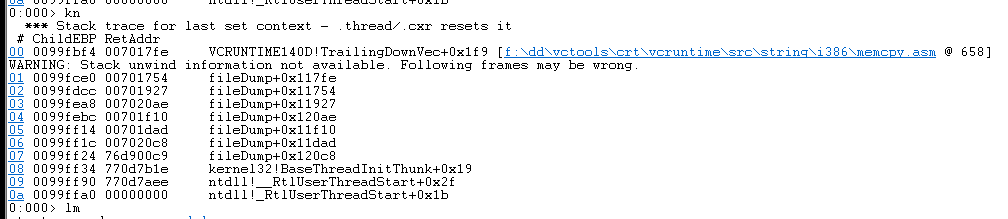
- Use kn/kv/kp to view the function call stack
- The kn command means to print out the crashed function stack.
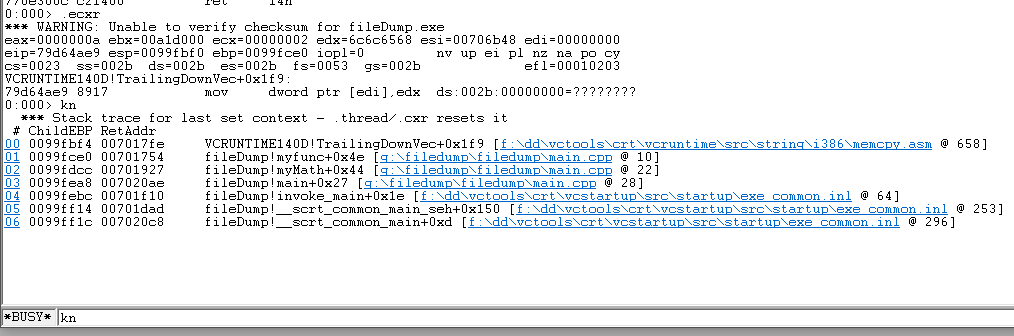
- Here the exclamation point in front of it represents the module name, you can see that the top is crashedvcruntime140dThis module is in, everyone should know this, it is a runtime library of c, the memcpy function is in this library, and the specific line number information will be displayed later.
- You can click the serial number in front to see the variable value directly
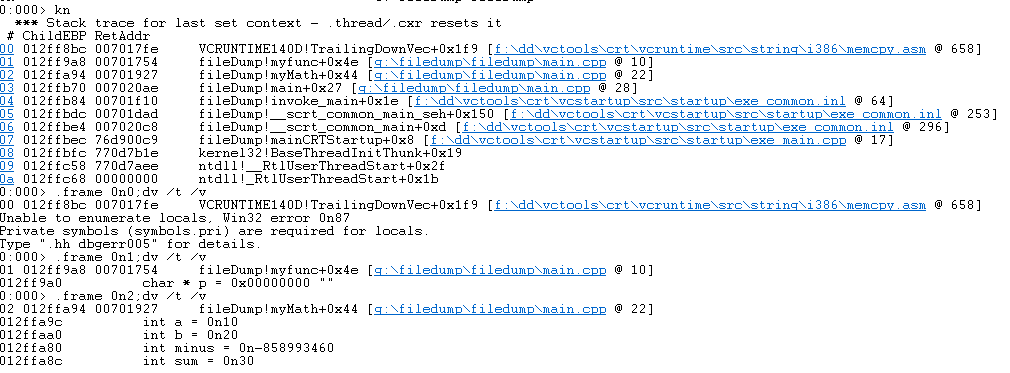
- Here you can also load the source code path through File->Source File Path. Double-click the following file name, you can see the corresponding source code in WinDbg. Click on a different serial number to jump to the corresponding position
- The kv and kp commands can also print out the parameter information of the function, you can compare them
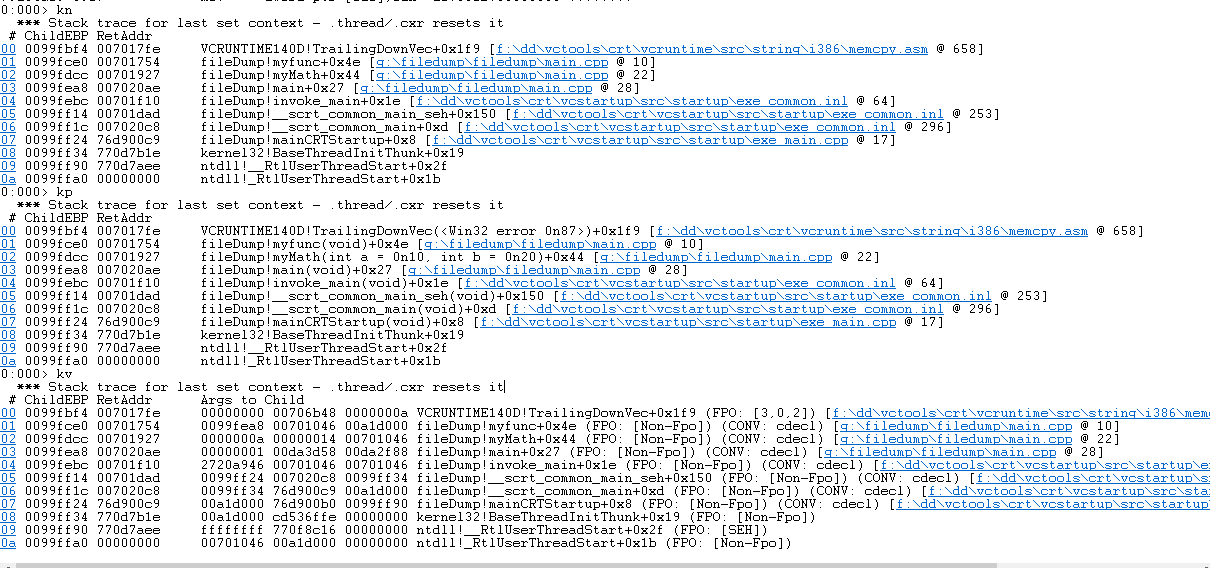
- The difference between kv and kp is that the parameters of kv are displayed in hexadecimal, and at most three digits are displayed. If there is no parameter position, the value is invalid.
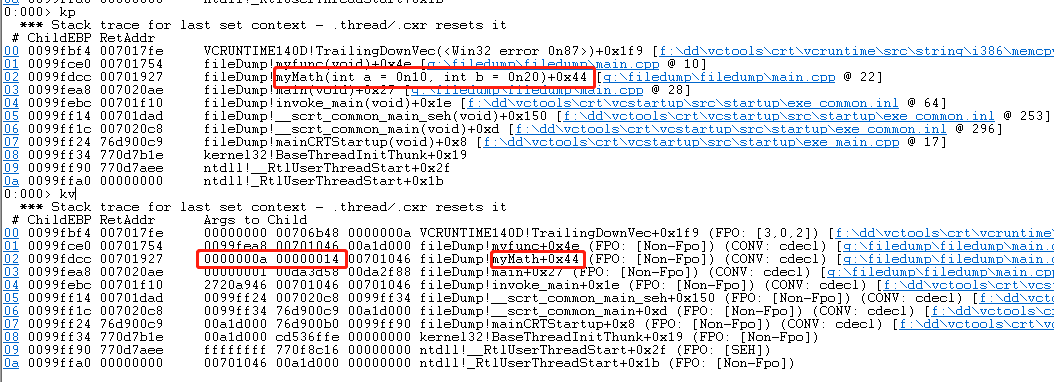
- If we want to view the parameters, we usually just use the kp command directly.
- The kn command means to print out the crashed function stack.
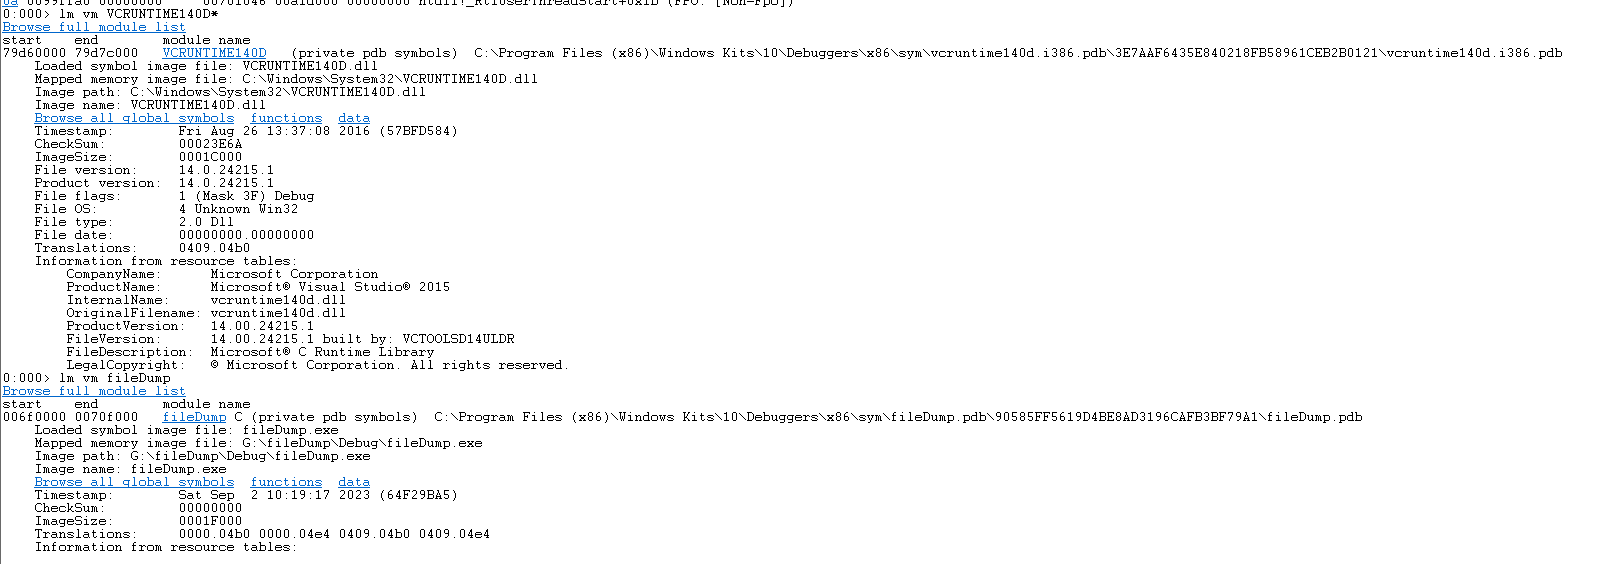
- Use the lm vm command to view the pdb file
- uselm vm module nameThe command can see the pdb file of the corresponding module. If the pdb file cannot be found, we have to add it manually.
- You can load the path where the pdb file is located through File->Symbol Search Path.
- The above example, because it is debugged on a development machine, has already loaded the pdb file by default. If it is not a development machine, we need to manually add the path of the pdb file, so that we can see the specific line number information.
- For example, if we change to a non-development machine and check the stack information, the function name and line number information of the test program can no longer be seen
- uselm vm module namecommand, the pdb file cannot be seen.
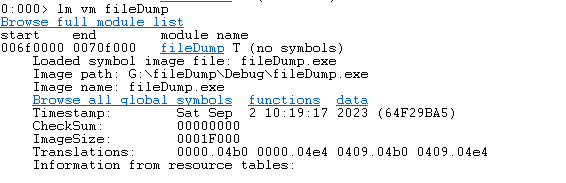
- At this time, we need to copy the pdb file of our program to a non-development machine, then load the path where the pdb file is located, re-execute .ecxr, and then execute the kn command to re-display the function and line number information.
- uselm vm module nameThe command can see the pdb file of the corresponding module. If the pdb file cannot be found, we have to add it manually.