요구 사항: 클러스터에 있는 모든 Java 프로세스의 메모리 사용량을 모니터링합니다.
Linux 시스템에서 실행 중인 Java 프로세스 확인: jps 명령
[root@localhost zabbix]# jps
26490 YarnTaskExecutorRunner
12012 NodeManager
14047 YarnTaskExecutorRunner
25007 Jps
Java 프로세스의 메모리 사용량 보기: jstat 명령 -gc -gcutil
[root@node035 zabbix]# jstat -gc 12012
 S0C    S1C    S0U    S1U      EC       EU        OC         OU       MC     MU    CCSC   CCSU   YGC     YGCT    FGC    FGCT     GCT
2560.0 2560.0  0.0   2208.0 335872.0 180374.6  338432.0   57522.0   51624.0 50525.8 5808.0 5542.1 104079  881.980   3      0.384  882.364
[root@node035 zabbix]# jstat -gcutil 12012
  S0     S1     E      O      M     CCS    YGC     YGCT    FGC    FGCT     GCT
  0.00  86.25  89.43  17.00  97.87  95.42 104079  881.980     3    0.384  882.364
################################################# ######################
데이터 스크립트 수집:
여기서 grep 명령을 사용하여 모니터링하려는 모든 Java 프로세스를 필터링하는 것이 가장 좋습니다. grep -v 제외 방법을 사용하지 마십시오.
일부 프로세스는 jps, jstat, jmap 및 기타 명령과 같은 jps 명령을 사용하는 것보다 빠르게 생성에서 소멸로 이동할 수 있으므로 jps | grep을 사용하여 하나의 프로세스 pid 번호만 얻을 수 있지만 프로세스 이름 및 기타 정보는 얻을 수 없습니다. 정보.
때때로 스크립트가 정지되고 데이터 수집에 일련의 문제가 발생합니다.
부모 및 자식 프로세스 등과 같이 동일한 프로세스 이름을 가진 여러 프로세스가 있을 수 있는 상황을 위해.
여기서 스크립트는 kafka, kafka1, kafka2...와 같이 동일한 프로세스 이름을 표시하는 방법을 사용합니다.
zabbix는 프로세스 이름을 얻기 위해 자동 검색 방법을 사용하기 때문에 프로세스 이름 + pid를 얻기 위해 시도했지만 pid가 변경됩니다.
따라서 현재 동일한 프로세스 이름을 가진 두 가지 방법을 분리하는 좋은 방법이 없습니다.
그러나 모니터링의 중요성은 모니터링 항목의 추세 변화를 관찰하는 것입니다 프로세스의 비정상적인 메모리 상태를 발견하면 스크립트의 데이터 파일로 이동하여 프로세스 이름에 따라 pid를 가져옵니다.
[root@node031 monitor]# cat getJavaMemoryStatus.sh
#!/bin/bash
# Final output
output=""

# Variables
flag=1
last_name=""
currnet_name=""

# JPS Command
result=`/usr/local/jdk/bin/jps | egrep  "QuorumPeerMain|Kafka|CanalAdminApplication|CanalLauncher|JournalNode|DFSZKFailoverController|NameNode|DataNode|ResourceManager|NodeManager|YarnJobClusterEntrypoint|YarnTaskExecutorRunner|HMaster|HRegion" | sort -k2 -k1`

# Main Loop
#echo "$result" | while read -r pid name ; do
while read -r pid name ; do
    #echo "${pid},${name},${last_name}"

	# Add num to same process name, for example: Process1, Process2 ...
	if [ x"$name" = x"$last_name" ]; then
		currnet_name="$name$flag"
		flag=$(( $flag + 1 ))
	else
	    currnet_name="$name"
		flag=1
	fi
	last_name="$name"

	# Get GC Status
	res_gc=`/usr/local/jdk/bin/jstat -gc $pid 2>/dev/null | awk 'NR==2{print $1, $2, $3, $4, $5, $6, $7, $8}'`
	res_gcutil=`/usr/local/jdk/bin/jstat -gcutil $pid 2>/dev/null | awk 'NR==2{print $1, $2, $3, $4, $7, $8, $9, $10}'`

	# Combime output
	if [ x"$output" = x"" ]; then
		output="${currnet_name} $pid ${res_gc} ${res_gcutil}"
	else
		output+=$'\n'"${currnet_name} $pid ${res_gc} ${res_gcutil}"
	fi
	#echo "$output"

done <<< "$result"

# Output
echo "$output" > /tmp/java_memory_status.txt
스크립트 최적화:
데이터 명령을 최대한 한 번만 실행하여 서버 압력을 줄이십시오.
IO를 줄이기 위해 데이터를 가져올 때 파일을 읽지 마십시오.
프로세스 자동 검색 스크립트:
[root@localhost parameter_script]# cat java_discovery.sh
#!/bin/bash
javaProcessList=`cat /tmp/java_memory_status.txt|awk '{print $2"#"$1}'`
echo "{\"data\":["
first=1
for javaProcess in $javaProcessList;
do
    IFS='#' read -r -a items <<< "$javaProcess";
    if [ $first == 1 ]; then
        echo "{\"{#JAVAPSNAME}\":\"${items[1]}\",\"{#JAVAPSPID}\":\"${items[0]}\"}";
        first=0
    else
        echo ",{\"{#JAVAPSNAME}\":\"${items[1]}\",\"{#JAVAPSPID}\":\"${items[0]}\"}";
    fi
done;

echo "]}";
################################################# ######################
Java 프로세스 메모리 데이터 스크립트 가져오기:
[root@node031 parameter_script]# cat getjavastatus.sh
#!/bin/bash
pid=`cat /tmp/java_memory_status.txt | awk '{print $2}'`
case $2 in
# S0总大小
S0C)
	grep -w $1 /tmp/java_memory_status.txt |awk '{print $3}'|bc
	;;
# S1总大小
S1C)
	grep -w $1 /tmp/java_memory_status.txt |awk '{print $4}'|bc
	;;
# S0使用大小
S0U)
	grep -w $1 /tmp/java_memory_status.txt |awk '{print $5}'|bc
	;;
# S1使用大小
S1U)
	grep -w $1 /tmp/java_memory_status.txt |awk '{print $6}'|bc
	;;
# Eden总大小
EC)
	grep -w $1 /tmp/java_memory_status.txt |awk '{print $7}'|bc
	;;
# Eden使用大小
EU)
	grep -w $1 /tmp/java_memory_status.txt |awk '{print $8}'|bc
	;;
#old大小
OC)
	grep -w $1 /tmp/java_memory_status.txt |awk '{print $9}'|bc
	;;
#old使用大小
OU)
	grep -w $1 /tmp/java_memory_status.txt |awk '{print $10}'|bc
	;;
# S0使用率
S0Util)
	grep -w $1 /tmp/java_memory_status.txt |awk '{print $11}'|bc
	;;
# S1使用率
S1Util)
	grep -w $1 /tmp/java_memory_status.txt |awk '{print $12}'|bc
	;;
# Eden使用率
EUtil)
	grep -w $1 /tmp/java_memory_status.txt |awk '{print $13}'|bc
	;;
#old使用率
OUtil)
	grep -w $1 /tmp/java_memory_status.txt |awk '{print $14}'|bc
	;;
# 年轻代垃圾回收次数
YGC)
	grep -w $1 /tmp/java_memory_status.txt |awk '{print $15}'|bc
	;;
# 年轻代垃圾回收消耗时间
YGCT)
	grep -w $1 /tmp/java_memory_status.txt |awk '{print $16}'|bc
	;;
# 老年代垃圾回收次数
FGC)
	grep -w $1 /tmp/java_memory_status.txt |awk '{print $17}'|bc
	;;
# 老年代垃圾回收消耗时间
FGCT)
	grep -w $1 /tmp/java_memory_status.txt |awk '{print $18}'|bc
	;;
esac
구성 파일 추가 및 모니터링 항목 사용자 정의
UserParameter=javaps,/etc/zabbix/parameter_script/java_discovery.sh
UserParameter=javastat[*],/etc/zabbix/parameter_script/getjavastatus.sh $1 $2
zabbix-agent2 프로세스를 다시 시작하십시오.
service zabbix-agent2 restart예약된 작업 구성
*/1 * * * * sh /data/script/monitor/getJavaMemoryStatus.sh
Java 프로세스 자동 검색 구성
템플릿 그룹 만들기: JavaProcess

템플릿 JavaProcess 만들기

JavaProcess 템플릿에서 자동 검색 규칙 생성

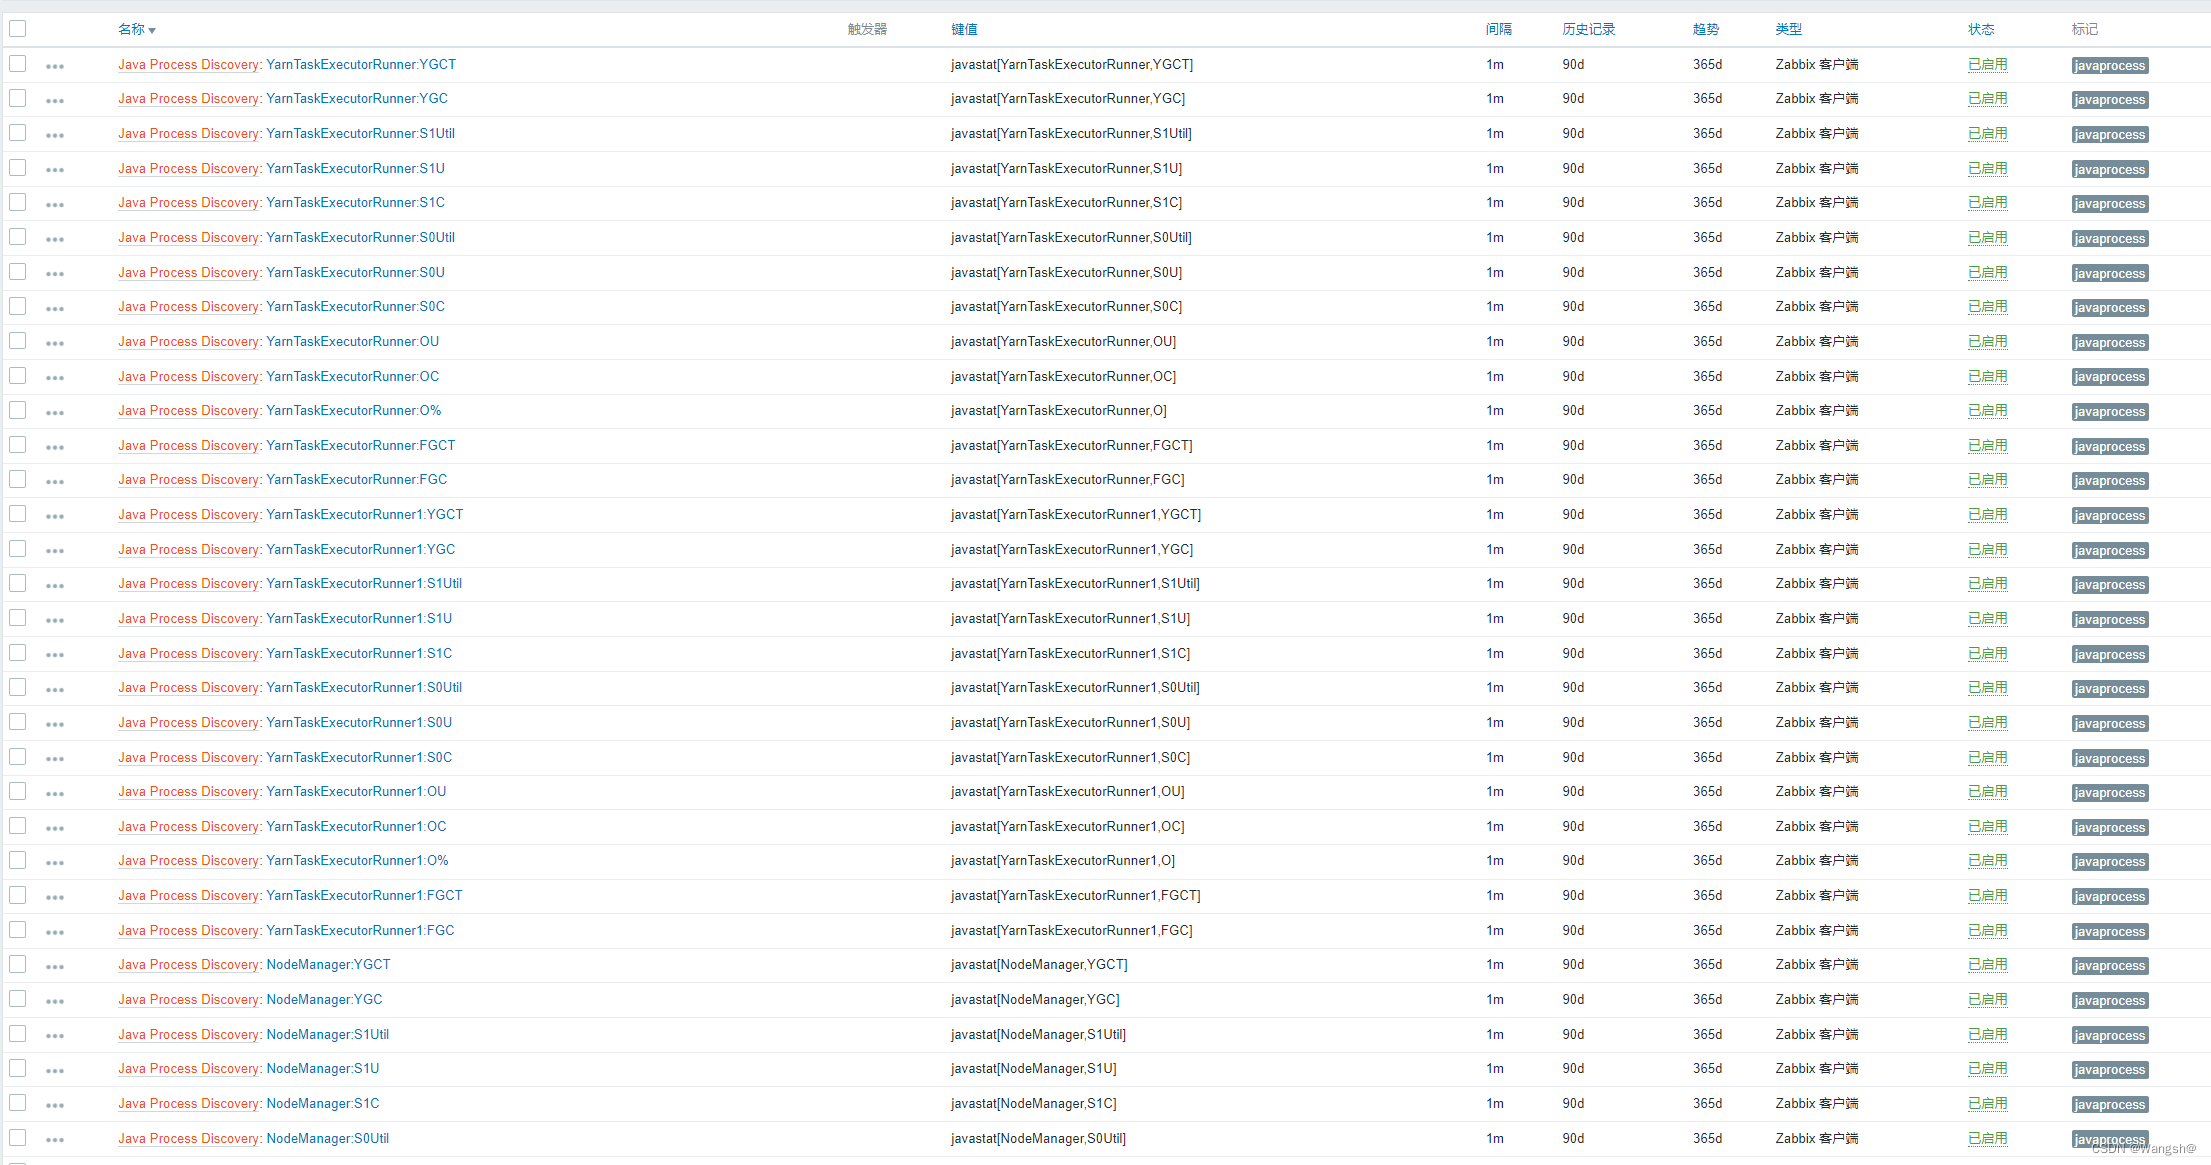
모니터링할 모니터링 항목의 프로토타입 추가

모니터링할 호스트에 JavaProcess 템플릿 추가

Zabbix는 검색된 프로세스를 해당 호스트에 자동으로 추가한 후 모니터링 항목의 프로토타입에 따라 해당 모니터링 항목을 생성하고 데이터를 수집한 후 grafana에서 그래프를 생성합니다.