1. 데이터 분석의 목표를 명확히 한다
모든 주문에서 각 카테고리에 해당하는 제품 수를 계산하고 워드 클라우드 다이어그램을 구성합니다.
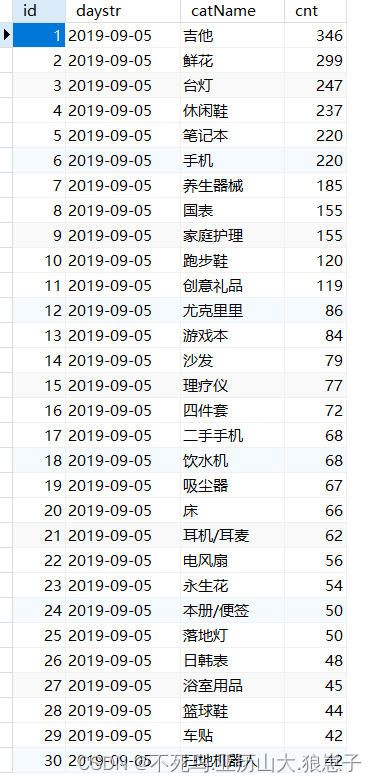
2 데이터 분석 결과를 저장할 테이블을 생성합니다.
create table app_cat_cnt(
  id int primary key auto_increment,
  daystr varchar(20),
  catName varchar(100),
  cnt int
);
3. 데이터 분석을 위한 SQL 문 작성
select
	substring(a.createTime,1,10) as daystr,
	c.catName,
	count(*) as cnt
from	ods_finebi_order_goods a
join ods_finebi_goods b on a.goodsId = b.goodsId
join ods_finebi_good_cats c on b.goodsCatId = c.catId
group by c.catName, substring(a.createTime,1,10)
order by cnt desc;
4 결과 테이블에 로드
insert into app_cat_cnt
select
	null,
	substring(a.createTime,1,10) as daystr,
	c.catName,
	count(*) as cnt
from ods_finebi_order_goods a
join ods_finebi_goods b on a.goodsId = b.goodsId
join ods_finebi_good_cats c on b.goodsCatId = c.catId
group by c.catName, substring(a.createTime,1,10)
order by cnt desc;