작성자: Prest13 원본출처: https://tidb.net/blog/44b9b8b1 See More
배경
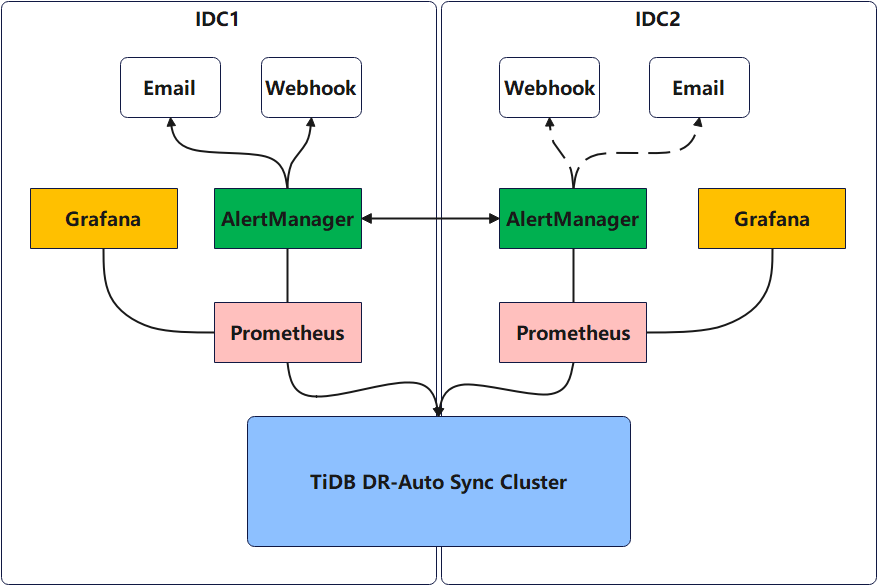
이중 센터에 tidb dr-auto sync 클러스터 배포 모니터링의 고가용성을 위해 독립적인 prometheus+alertmanager+grafana를 물리적으로 분리된 두 개의 데이터 센터에 배포하여 모든 모니터링에 액세스할 수 있습니다.
이 배포 아키텍처는 모니터링 구성 요소의 두 세트에서 데이터 수집의 일관성과 모니터링 경보의 반복 전송 문제를 고려해야 합니다.
구현 아이디어
- 두 세트의 Prometheus 구성요소는 클러스터 모니터링 정보를 독립적으로 수집하고 저장합니다.
<!---->
- 두 세트의 Grafana는 각각의 Prometheus를 데이터 소스로 연결합니다.
<!---->
- AlertManager는 클러스터를 통해 구성되며 가십 메커니즘을 기반으로 하며, 여러 경보 관리자가 동일한 경보 이벤트를 수신한 후 그 중 하나가 모니터링 경보 정보를 외부 세계로 보냅니다.
시뮬레이션 구현
시뮬레이션 구현 환경
TiDB v7.1.0 LTS
단일 클러스터에 두 세트의 모니터링 배포
# # Server configs are used to specify the configuration of Prometheus Server.
monitoring_servers:
  - host: 30.0.100.40
    port: 9091
    deploy_dir: "/tidb/tidb-deploy/prometheus-8249"
    data_dir: "/data/tidb-data/prometheus-8249"
    log_dir: "/data/tidb-deploy/prometheus-8249/log"
  - host: 30.0.100.42
    port: 9091
    deploy_dir: "/tidb/tidb-deploy/prometheus-8249"
    data_dir: "/data/tidb-data/prometheus-8249"
    log_dir: "/data/tidb-deploy/prometheus-8249/log"

# # Server configs are used to specify the configuration of Grafana Servers.
grafana_servers:
  - host: 30.0.100.40
    deploy_dir: /data/tidb-deploy/grafana-3000
  - host: 30.0.100.42
    deploy_dir: /data/tidb-deploy/grafana-3000

# # Server configs are used to specify the configuration of Alertmanager Servers.
alertmanager_servers:
  - host: 30.0.100.40
    deploy_dir: "/data/tidb-deploy/alertmanager-9093"
    data_dir: "/data/tidb-data/alertmanager-9093"
    log_dir: "/data/tidb-deploy/alertmanager-9093/log"
  - host: 30.0.100.42
    deploy_dir: "/data/tidb-deploy/alertmanager-9093"
    data_dir: "/data/tidb-data/alertmanager-9093"
    log_dir: "/data/tidb-deploy/alertmanager-9093/log"
모니터링 데이터 링크 조정
grafana 조정 데이터 소스
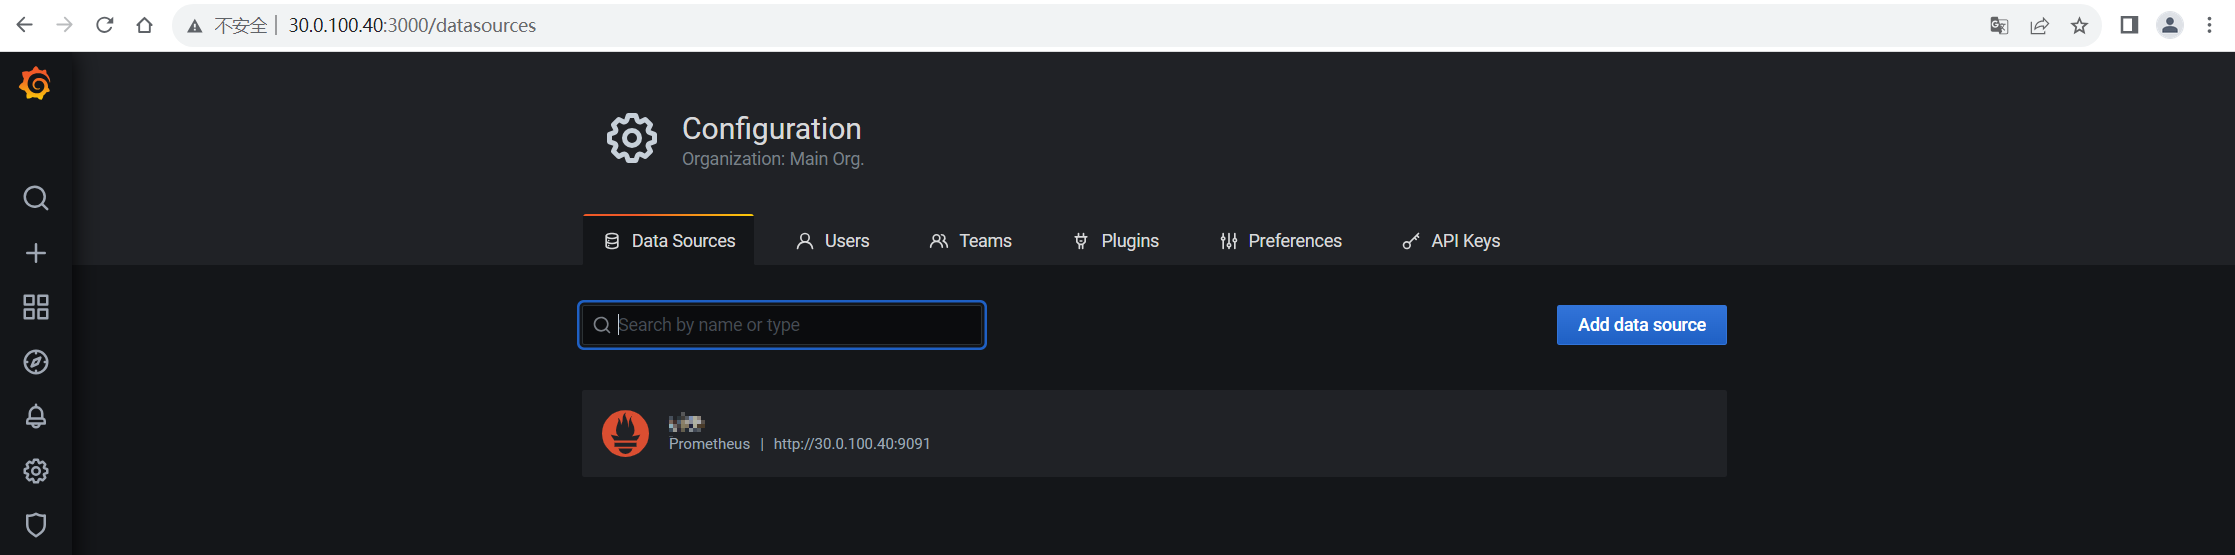
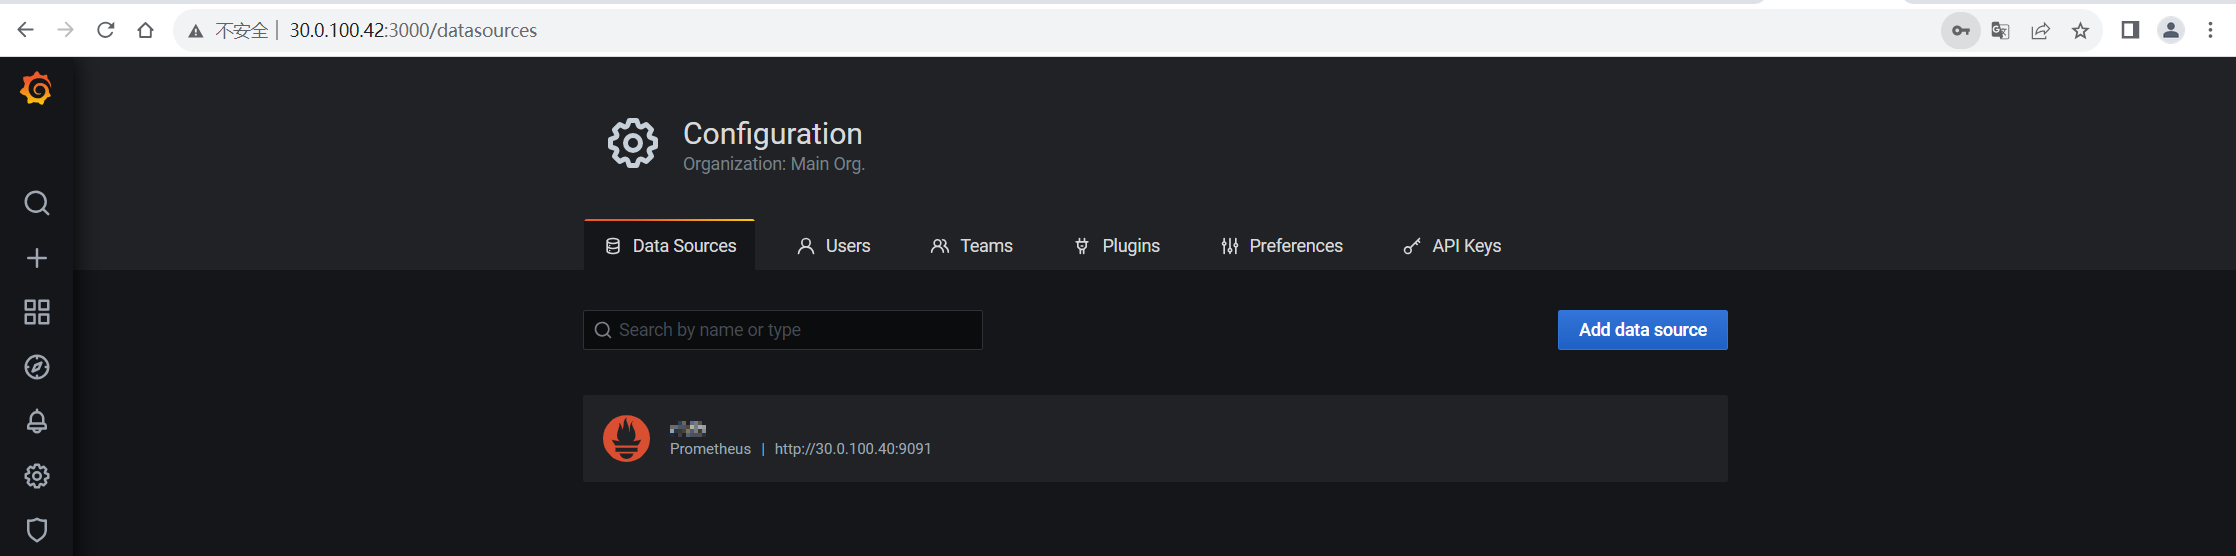
Prometheus 구성 확인 및 Alertmanager 정보 설정
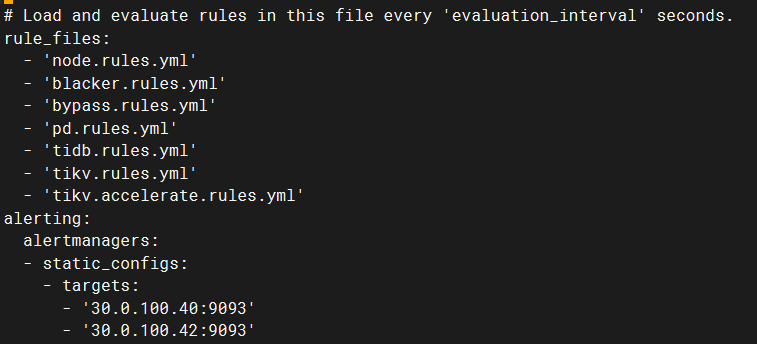
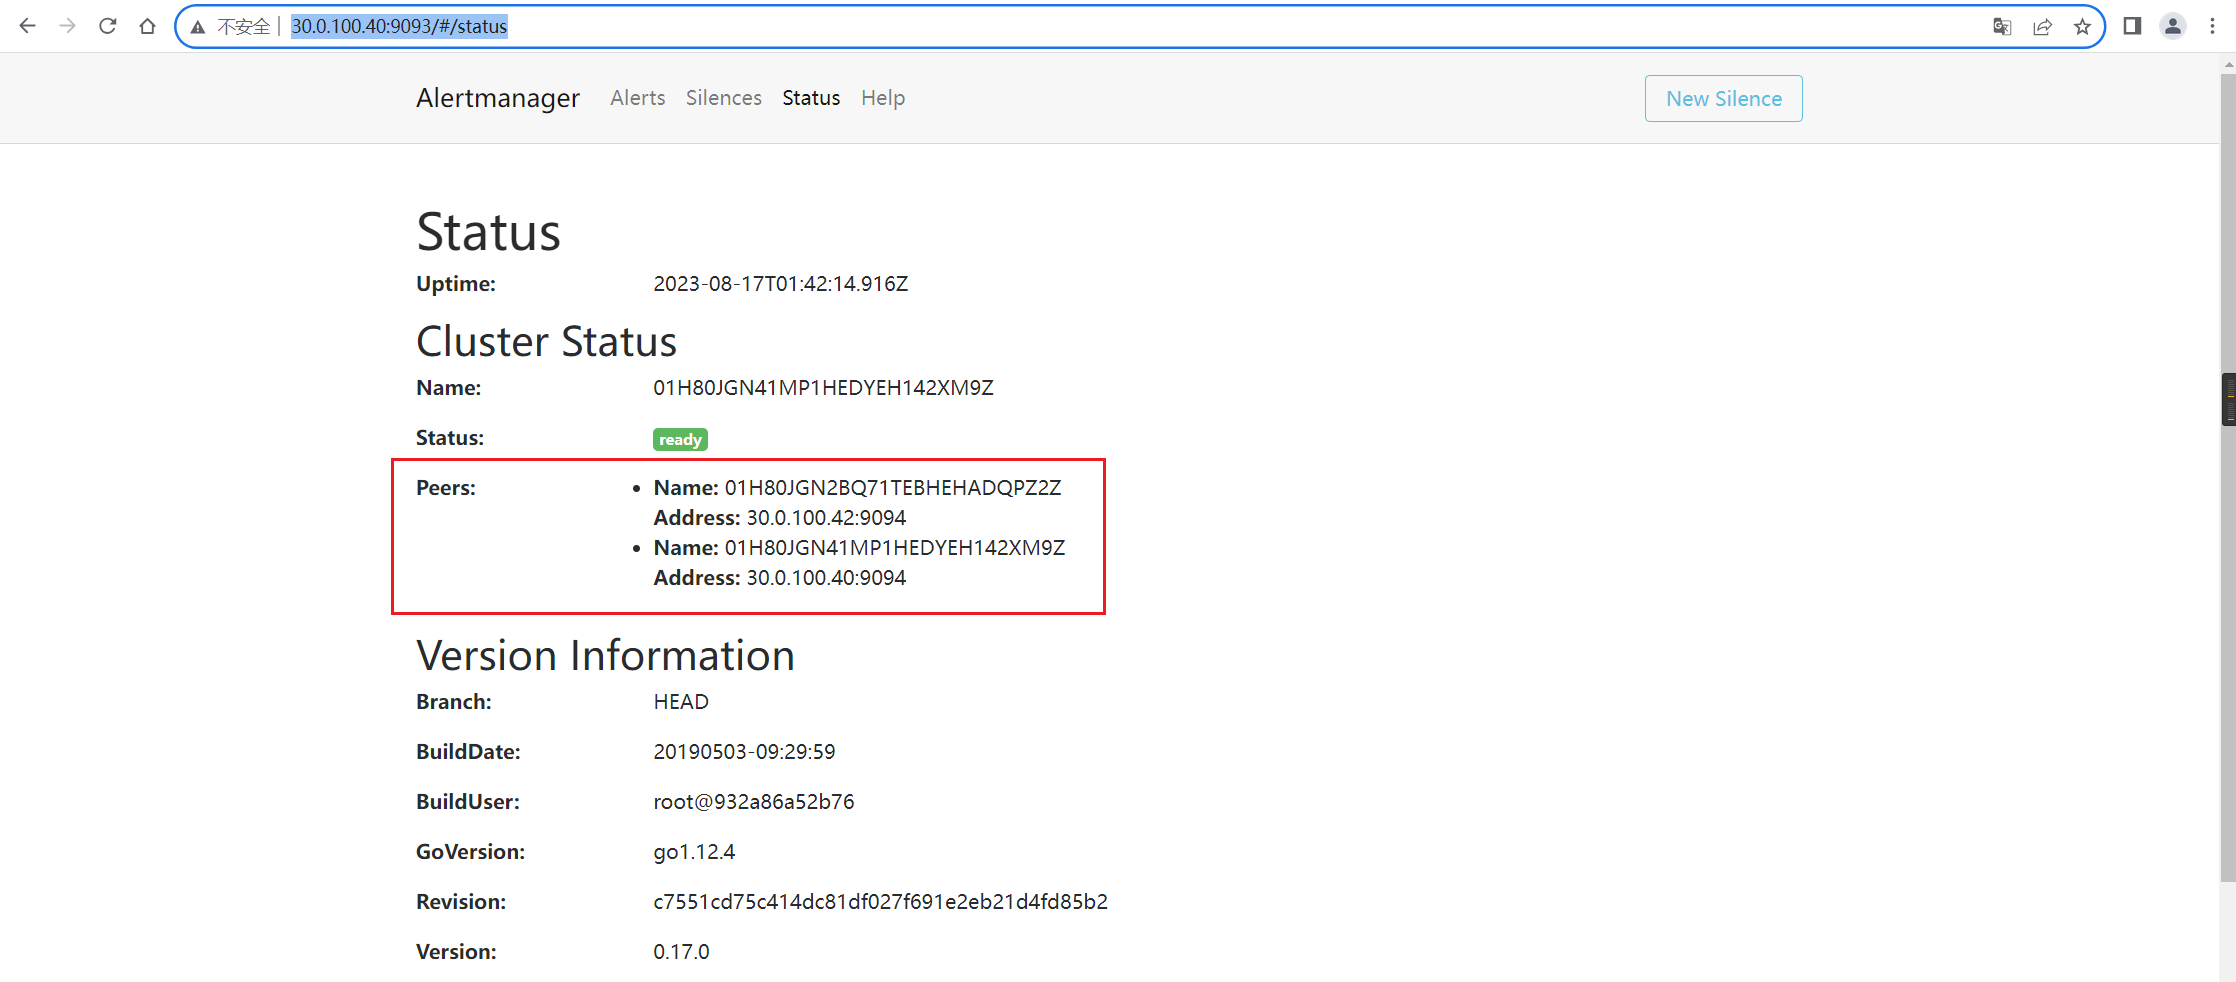
Alertmanager에 로그인하여 여러 Alertmanager가 클러스터를 형성하는지 확인합니다(여기서 tidb에 의해 구성이 자동으로 완료됨).
 단일 Prometheus 실패 후 대시보드 사용에 영향을 주지 않도록 하려면 여러 Prometheus에 대해 haproxy+keepalive 역방향 프록시를 재사용하고 대시보드의 prometheus 데이터 소스를 수정해야 합니다.
haproxy 구성이 약간
대시보드 구성은 다음과 같습니다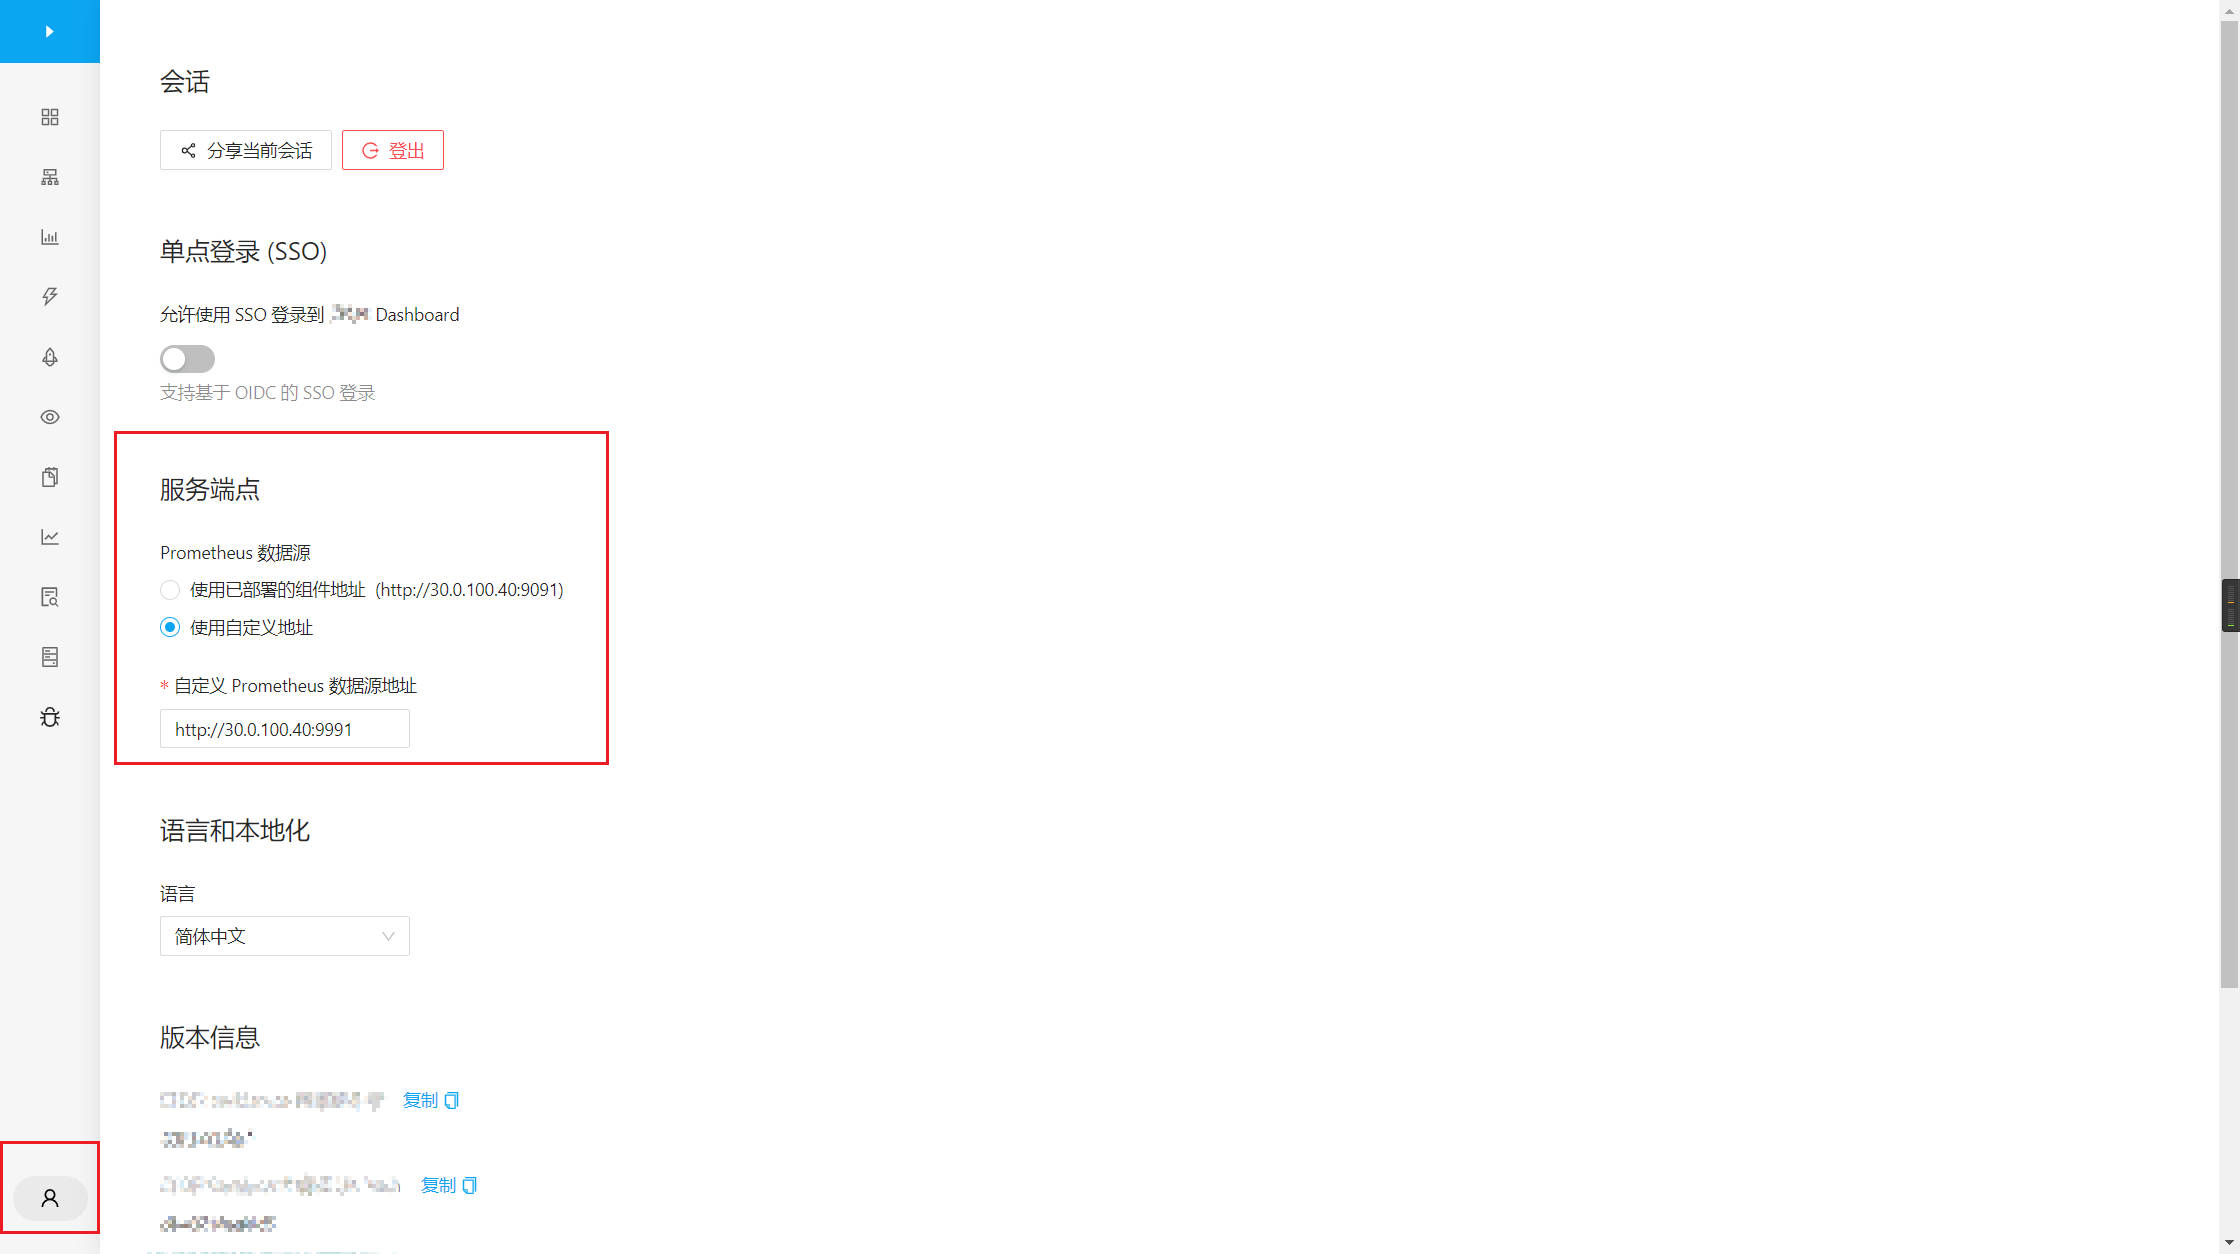
웹훅 구현
- 웹훅을 Feishu API로 변환하는 golang 프로그램 작성
약간
- 테스트하고 HTTP 인터페이스 테스트 도구를 사용하여 Feishu 웹훅 애플릿이 관련 경보 이벤트를 수신하고 구문 분석하는지 확인하세요.
{
  "version": "4",
  "groupKey": "123333",
  "status": "firing",
  "receiver": "target",
  "groupLabels": {"group":"group1"},
  "commonLabels": {"server":"test"},
  "commonAnnotations": {"server":"test"},
  "externalURL": "http://30.0.100.40:3000",
  "alerts": [
    {
      "labels": {"server":"test"},
      "annotations": {"server":"test"},
      "startsAt": "2023-08-12T07:20:50.52Z",
      "endsAt": "2023-08-12T09:20:50.52Z"
    }
  ]
}

2023/08/20 10:40:20 172.31.0.4 - {"version":"4","groupKey":"123333","status":"firing","Receiver":"target","GroupLabels":{"group":"group1"},"CommonLabels":{"server":"test"},"CommonAnnotations":{"server":"test"},"ExternalURL":"http://30.0.100.40:3000","Alerts":[{"labels":{"server":"test"},"annotations":{"server":"test"},"startsAt":"2023-08-12T07:20:50.52Z","endsAt":"2023-08-12T09:20:50.52Z"}]}
[GIN] 2023/08/20 - 10:40:20 | 200 |     621.879µs |      172.31.0.4 | POST     "/alert-feishu"
Alertmanager 웹훅 구성
- Alertmanager 구성 파일 템플릿을 작성하고 수신기 및 웹훅 정의를 추가한 후 tiup 중앙 제어 컴퓨터의 경로에 저장합니다.
  routes:
  - match:
    receiver: webhook-feishu-adapter
    continue: true

receivers:
  - name: 'webhook-feishu-adapter'
    webhook_configs:
    - send_resolved: true
      url: 'http://30.0.100.42:9999/alert-feishu'
- tiup edit-config를 사용하여 Alertmanager_server 아래에 config_file을 추가하십시오. 경로는 이전 단계에서 작성한 Alertmanager 구성 파일을 가리킵니다.
alertmanager_servers:
- host: 30.0.100.40
  ssh_port: 22
  web_port: 9093
  cluster_port: 9094
  deploy_dir: /data/tidb-deploy/alertmanager-9093
  data_dir: /data/tidb-data/alertmanager-9093
  log_dir: /data/tidb-deploy/alertmanager-9093/log
  arch: arm64
  os: linux
  config_file: /home/tidb/monitor-template/alert_config_40.yaml
- host: 30.0.100.42
  ssh_port: 22
  web_port: 9093
  cluster_port: 9094
  deploy_dir: /data/tidb-deploy/alertmanager-9093
  data_dir: /data/tidb-data/alertmanager-9093
  log_dir: /data/tidb-deploy/alertmanager-9093/log
  arch: arm64
  os: linux
  config_file: /home/tidb/monitor-template/alert_config_42.yaml
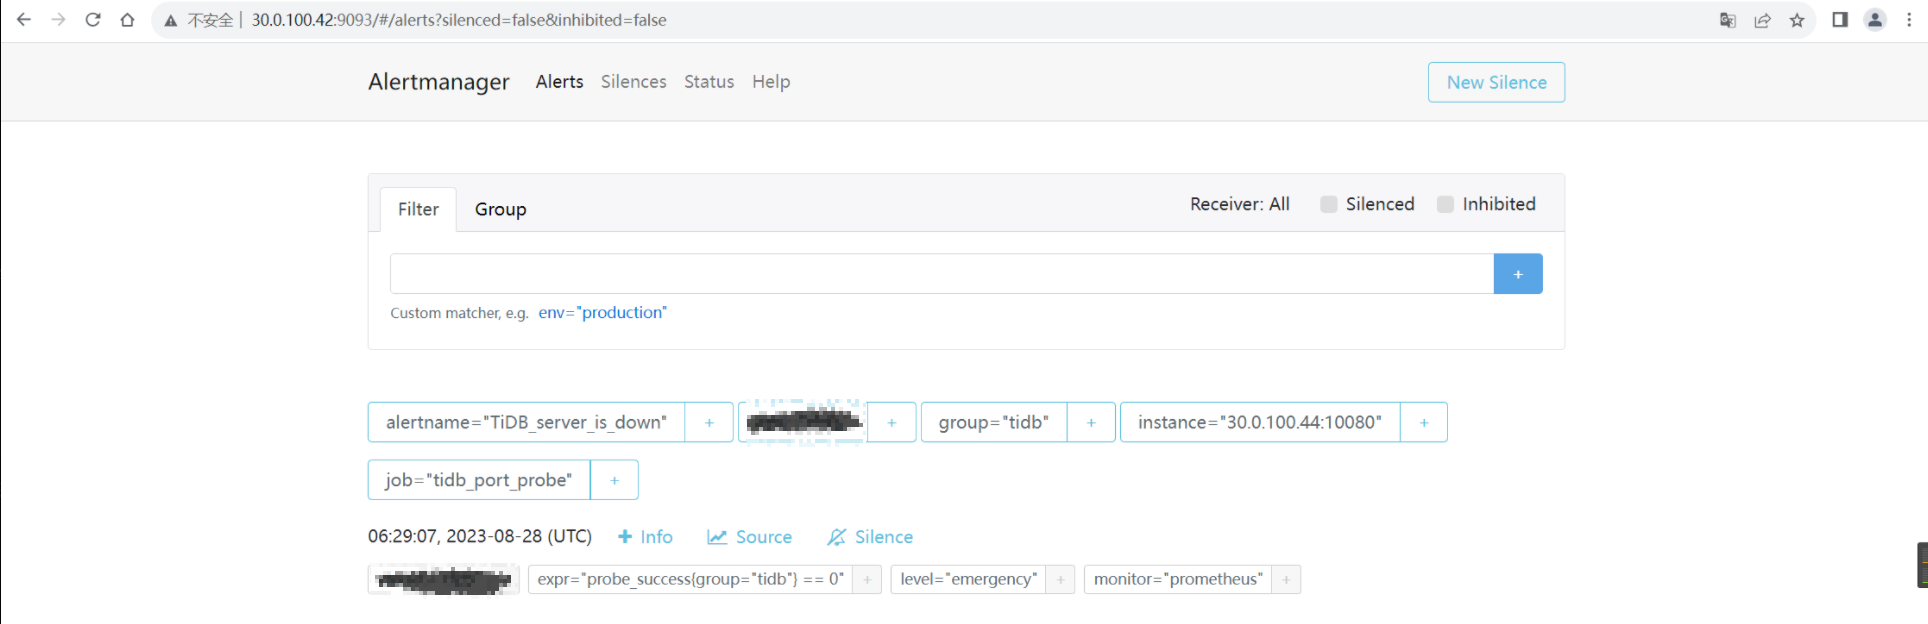
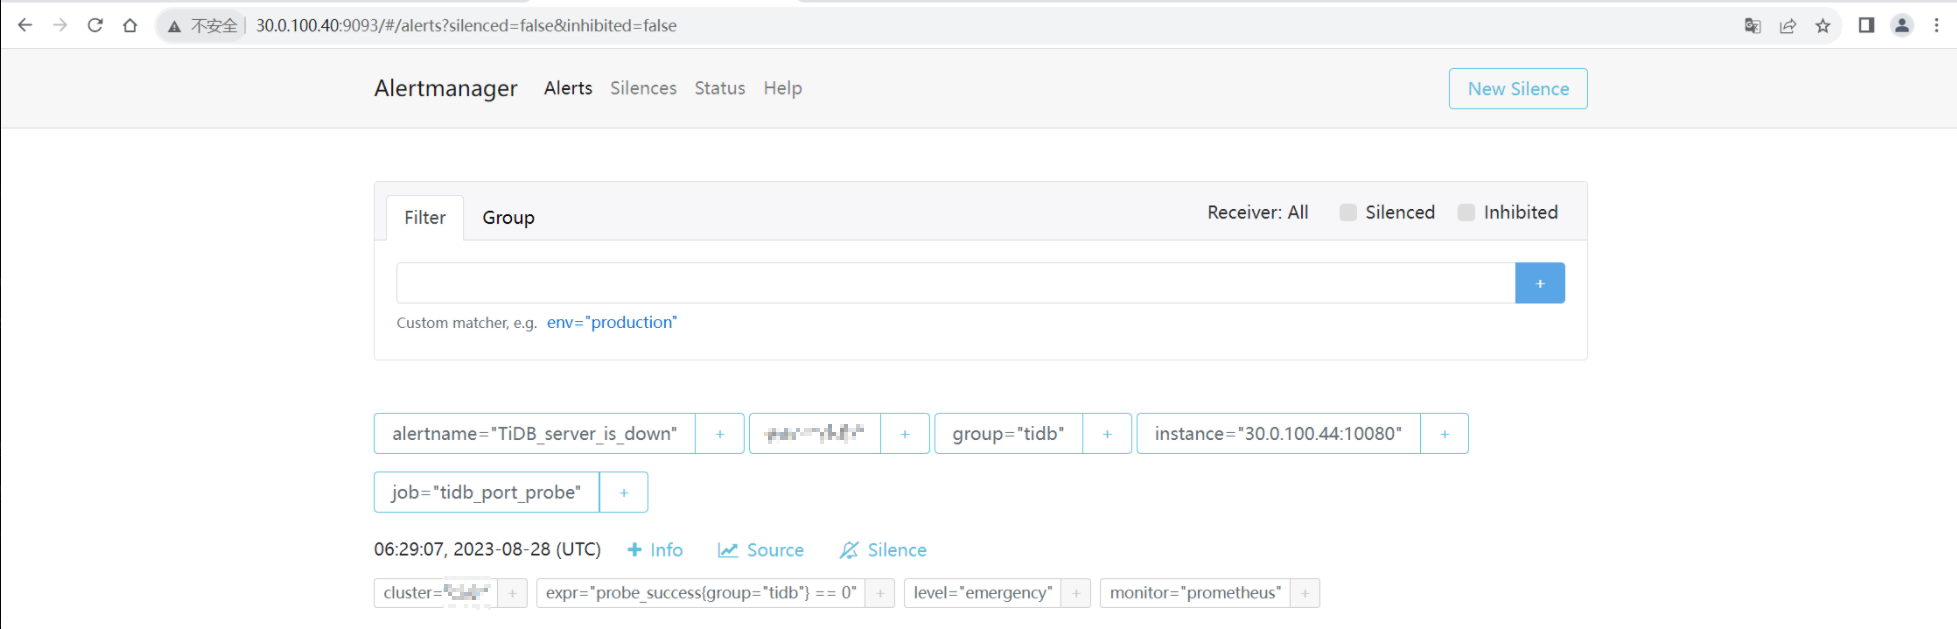
- 경보를 트리거하고 여러 경보가 생성되지 않는지 확인하십시오.
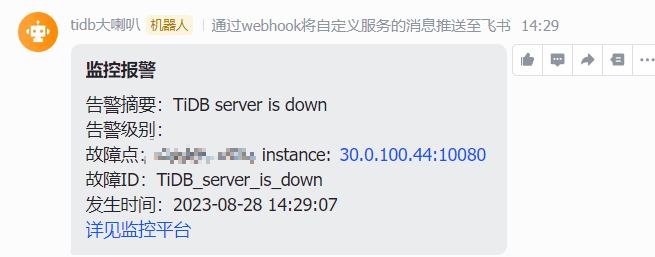
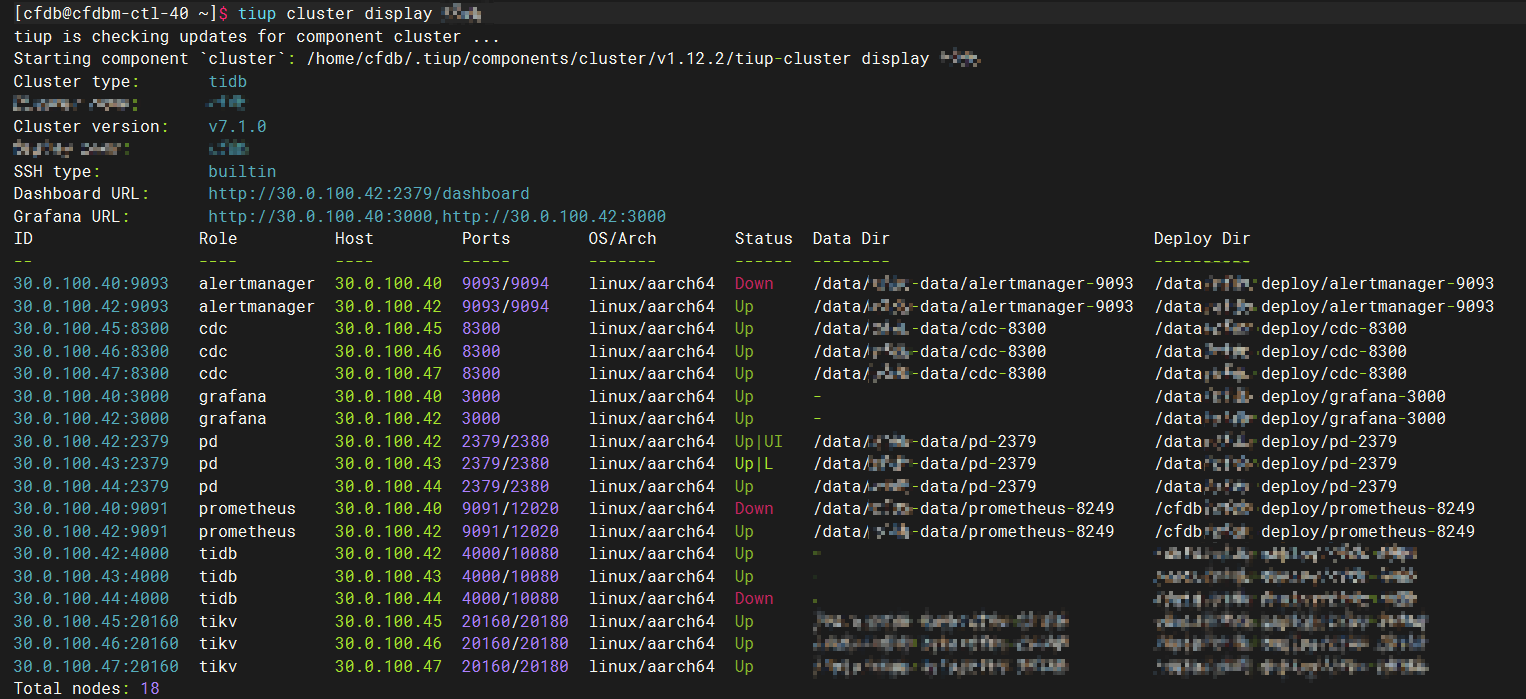
- 센터 중 하나의 모니터링 구성 요소를 끄고 경보가 정상적으로 발행될 수 있는지 확인하십시오.
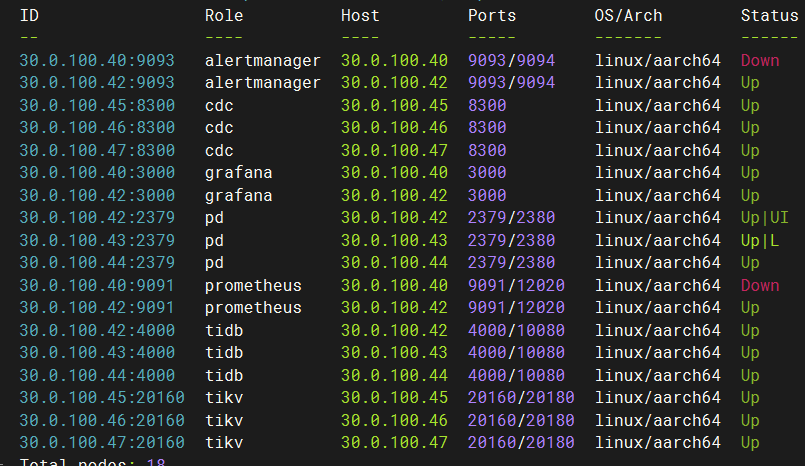
- 이전 단계에서 중지된 tidb 구성 요소를 시작하고 알람 복구를 트리거할 수 있는지 확인합니다.
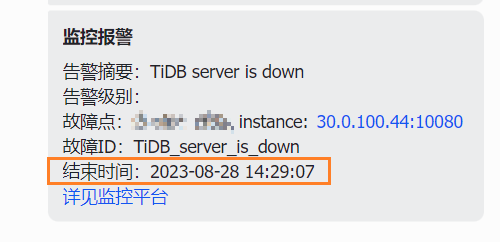
(여기 웹훅 코드에 버그가 있습니다. 복구 시간은 인용되지 않았습니다.)
결론적으로
다중 센터 환경에서는 클러스터 자체의 고가용성 기능을 고려하는 것 외에도 모니터링 구성 요소에도 고가용성 기능이 있어야 합니다. 본 글에서는 다중 센터 모니터링 활용 및 알람 통합 관점에서 다중 센터 클러스터 모니터링을 위한 고가용성 배포 및 구현 솔루션을 구축하려고 합니다.
궁금한 점이 있으면 토론해 보세요.
참고:
https://www.prometheus.wang/ha/alertmanager-high-availability.html
https://prometheus.io/docs/alerting/latest/overview/
오픈 소스 프레임워크 NanUI의 작성자가 철강 판매로 전환하여 프로젝트가 중단되었습니다. Apple App Store의 무료 목록 1위는 포르노 소프트웨어인 TypeScript입니다. 이제 막 인기를 얻었는데 왜 대기업들은 이를 포기하기 시작합니까? ? TIOBE 10월 목록: Java가 가장 큰 감소세를 보이고 C#은 Java Rust 1.73.0 출시 에 가까워지고 있습니다. 한 남자가 AI 여자친구의 부추김을 받아 영국 여왕을 암살했으며 9년 징역형을 선고받았습니다. Qt 6.6 공식 출시 Reuters: RISC-V 기술이 중미 기술 전쟁의 핵심이 된다 새로운 전장 RISC-V: 단일 기업이나 국가에 의해 통제되지 않는 Lenovo, Android PC 출시 계획